Trade
Basic
Futures
Futures
Hundreds of contracts settled in USDT or BTC
TradFi
Gold
Trade global traditional assets with USDT in one place
Options
Hot
Trade European-style vanilla options
Unified Account
Maximize your capital efficiency
Demo Trading
Futures Kickoff
Get prepared for your futures trading
Futures Events
Participate in events to win generous rewards
Demo Trading
Use virtual funds to experience risk-free trading
Earn
Launch
CandyDrop
Collect candies to earn airdrops
Launchpool
Quick staking, earn potential new tokens
HODLer Airdrop
Hold GT and get massive airdrops for free
Launchpad
Be early to the next big token project
Alpha Points
Trade on-chain assets and enjoy airdrop rewards!
Futures Points
Earn futures points and claim airdrop rewards
Investment
Simple Earn
Earn interests with idle tokens
Auto-Invest
Auto-invest on a regular basis
Dual Investment
Buy low and sell high to take profits from price fluctuations
Soft Staking
Earn rewards with flexible staking
Crypto Loan
0 Fees
Pledge one crypto to borrow another
Lending Center
One-stop lending hub
VIP Wealth Hub
Customized wealth management empowers your assets growth
Private Wealth Management
Customized asset management to grow your digital assets
Quant Fund
Top asset management team helps you profit without hassle
Staking
Stake cryptos to earn in PoS products
Smart Leverage
New
No forced liquidation before maturity, worry-free leveraged gains
GUSD Minting
Use USDT/USDC to mint GUSD for treasury-level yields
More
HighAmbition
#BuyTheDipOrWaitNow?
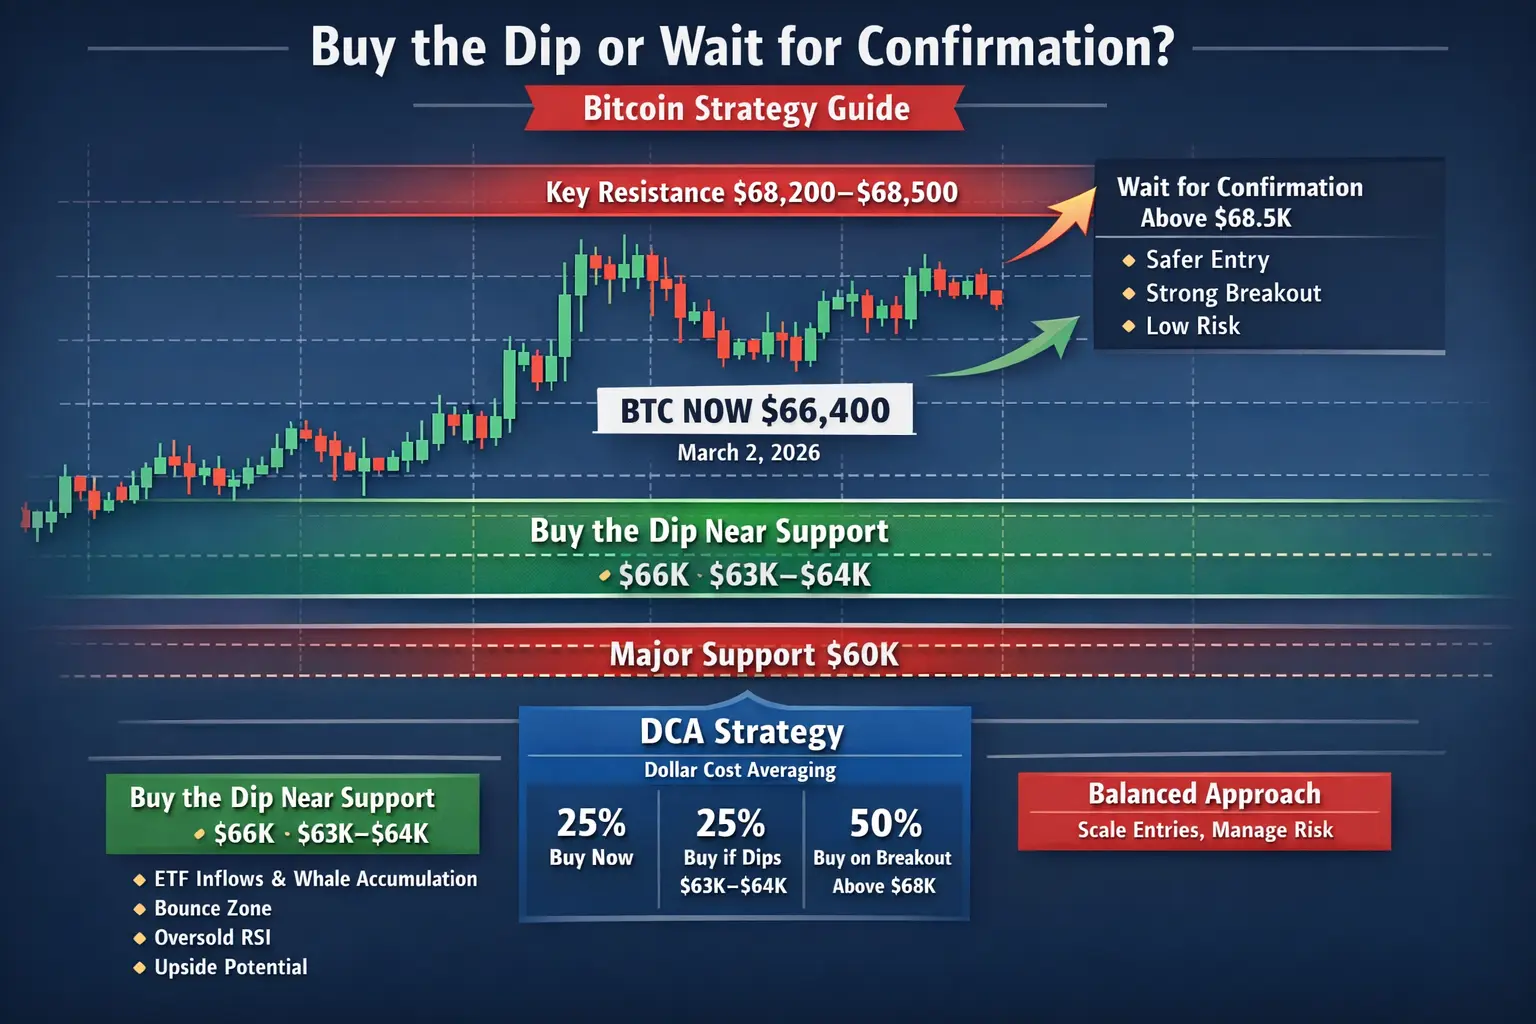
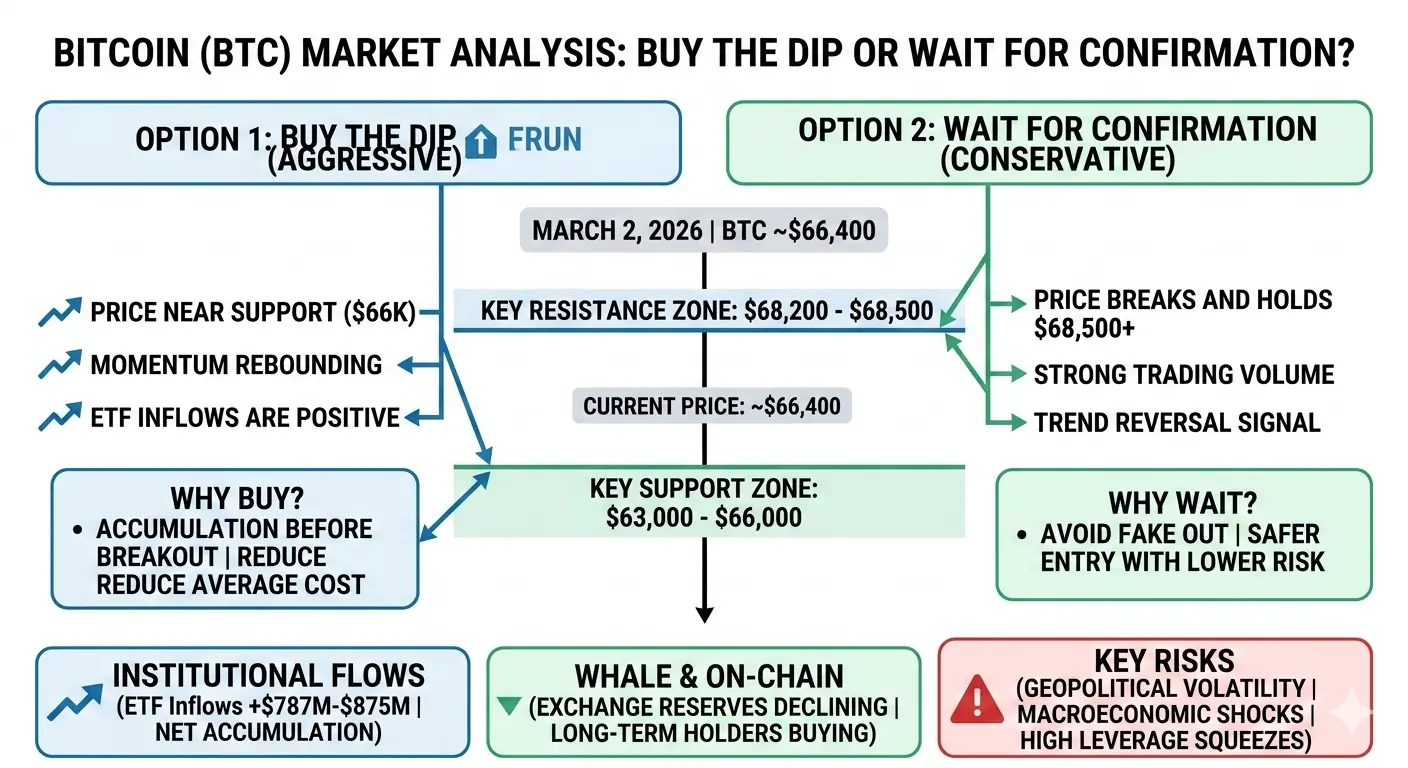
🚨 Bitcoin Market Deep Dive – Buy the Dip or Wait? Full Analysis (March 2, 2026)
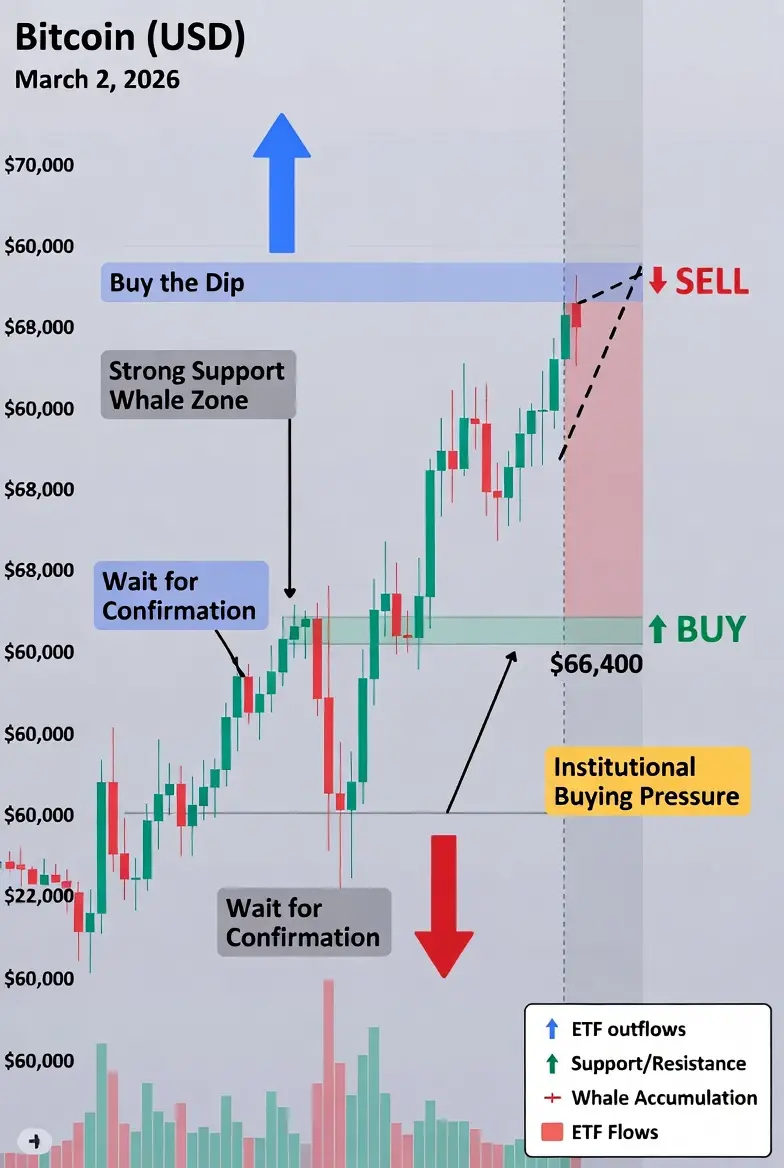
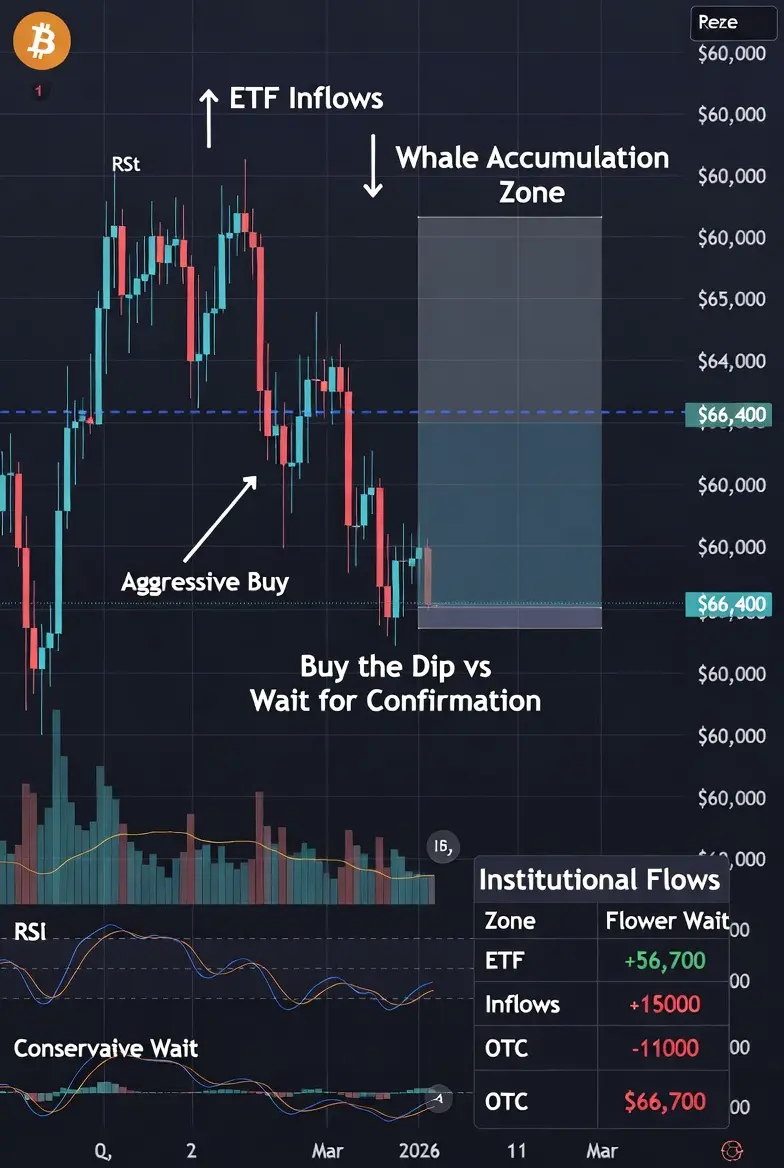
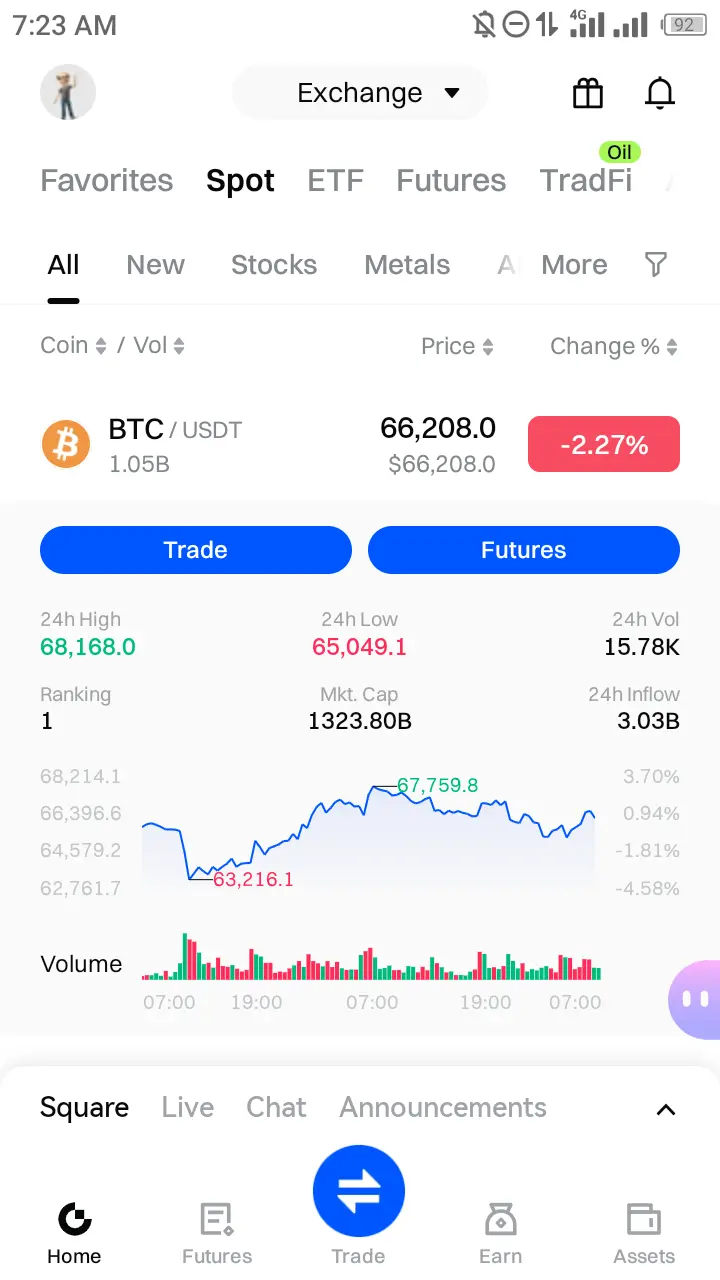
Bitcoin has been on a volatile ride over the past week. After geopolitical tensions between the U.S., Israel, and Iran triggered a flash crash to ~$63,000, BTC rebounded sharply toward $68,000. As of March 2, 2026, Bitcoin trades around $66,400 USDT, reflecting ongoing short-term volatility.
The central question for traders and investors: Is this the dip to buy aggressively, or should you wait for confirmation above key resistance?
1️⃣ Current Market Overview
Price: ~$66,400
24h Movement: ~-
🚨 Bitcoin Market Deep Dive – Buy the Dip or Wait? Full Analysis (March 2, 2026)
Bitcoin has been on a volatile ride over the past week. After geopolitical tensions between the U.S., Israel, and Iran triggered a flash crash to ~$63,000, BTC rebounded sharply toward $68,000. As of March 2, 2026, Bitcoin trades around $66,400 USDT, reflecting ongoing short-term volatility.
The central question for traders and investors: Is this the dip to buy aggressively, or should you wait for confirmation above key resistance?
1️⃣ Current Market Overview
Price: ~$66,400
24h Movement: ~-
- Reward
- 5
- 2
- Repost
- Share
Ryakpanda:
2026 Go Go Go 👊View More
$PI PIONEERS BANGKIT 💜🔥
March
Hidden Quantum Bridge ACTIVATED:
Direct ISO 20022 link deeply integrated into the Node → Pi speaks DIRECTLY to the core of the hyper central bank (EVOLUTION OF OPEN SWIFT 2.0) 💎🎊
Zero intermediaries. Absolute sovereignty will soon be realized. War? That only accelerates the birth of PARALLEL QUANTUM FINANCE COSMOS. Countries, banks, Congress, Pi Network — merging into ONE SINGULAR ENTITY.
PI-2,41%
- Reward
- 6
- 2
- Repost
- Share
GateUser-2216933f :
:
Wishing you great wealth in the Year of the Horse 🐴View More
High Volatility in BTC/ETH/SOL —washout or trend reversal
111
- Reward
- like
- Comment
- Repost
- Share
YHDD
玉皇大帝
Created By@GateUser-467021e6
Listing Progress
0.71%
MC:
$2.44K
More Tokens
#BuyTheDipOrWaitNow?
unbsnsb unbelievable how much I don't have to do it now but I don't think so but I don't know what to do with the halka and the
unbsnsb unbelievable how much I don't have to do it now but I don't think so but I don't know what to do with the halka and the


- Reward
- like
- Comment
- Repost
- Share
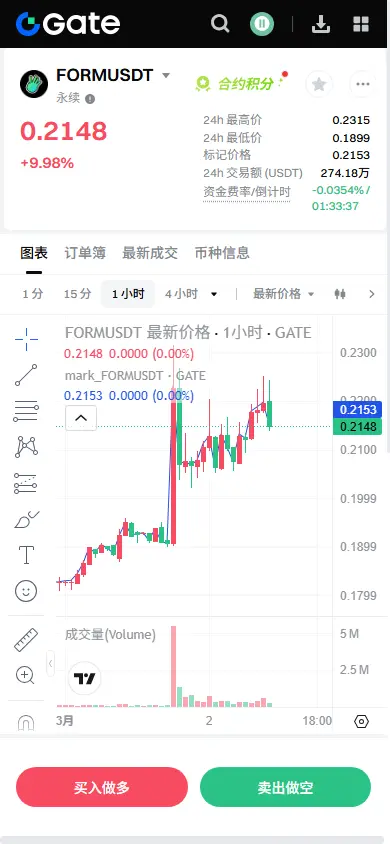
【$FORM Signal】Long + 1H Pullback Confirmation, Main Force Clearly Intends to Support the Price
$FORM After pulling back to the 1H EMA20 (0.2092) and stabilizing, and standing above the 4H EMA50 (0.1999), forming multi-timeframe resonance support. The current price has consolidated strongly after a massive surge yesterday, with a negative funding rate (-0.0014%) and stable open interest, indicating potential short squeeze. The order book shows buy depth concentrated in the 0.214-0.215 range, making it a high-probability sniper zone.
🎯Direction: Long (Long)
⚡Entry/Order: 0.2145 - 0.2156
🛑Stop
View Original$FORM After pulling back to the 1H EMA20 (0.2092) and stabilizing, and standing above the 4H EMA50 (0.1999), forming multi-timeframe resonance support. The current price has consolidated strongly after a massive surge yesterday, with a negative funding rate (-0.0014%) and stable open interest, indicating potential short squeeze. The order book shows buy depth concentrated in the 0.214-0.215 range, making it a high-probability sniper zone.
🎯Direction: Long (Long)
⚡Entry/Order: 0.2145 - 0.2156
🛑Stop
- Reward
- like
- Comment
- Repost
- Share
#Bitcoin🪙 March 1 Trading Ideas
📊 Trading Strategy:
Short after a rejection signal appears around 68,000.
Today’s Market Analysis ❤️
Bitcoin perfectly followed CoCo’s expectations with a rally, returning to around 68,000. However, be cautious of selling pressure above. For long positions, wait for stabilization signals before entering. Keep an eye on whether there will be a spike later.
BTC-2,32%

[The user has shared his/her trading data. Go to the App to view more.]
- Reward
- like
- Comment
- Repost
- Share
Paradox of trading:
You must care enough to prepare but not care enough to interfere.
You must care enough to prepare but not care enough to interfere.

- Reward
- like
- Comment
- Repost
- Share
It will be an incredible year #IsraelStrikesIranBTCPlunges #95%ofAltsBelow200-daySMA #GateSquare$50KRedPacketGiveaway #NvidiaQ4RevenueSurges73% #ETHMarketAnalysis
View Original
- Reward
- like
- Comment
- Repost
- Share
Over the weekend, Bitcoin experienced a decent range of movement, with a low around 63,000, which perfectly aligns with our ongoing high-altitude positioning strategy. It then rebounded and surged but was unable to firmly break above the 68,000 level. After facing resistance, it oscillated downward and is now stabilizing around 66,800 for consolidation.
From the current market situation, although weekend trading was highly volatile, the overall trend remains within a range-bound pattern, with bulls and bears repeatedly tugging and lacking trend continuity. The hourly chart shows a clearer pict
From the current market situation, although weekend trading was highly volatile, the overall trend remains within a range-bound pattern, with bulls and bears repeatedly tugging and lacking trend continuity. The hourly chart shows a clearer pict
BTC-2,32%
- Reward
- like
- Comment
- Repost
- Share
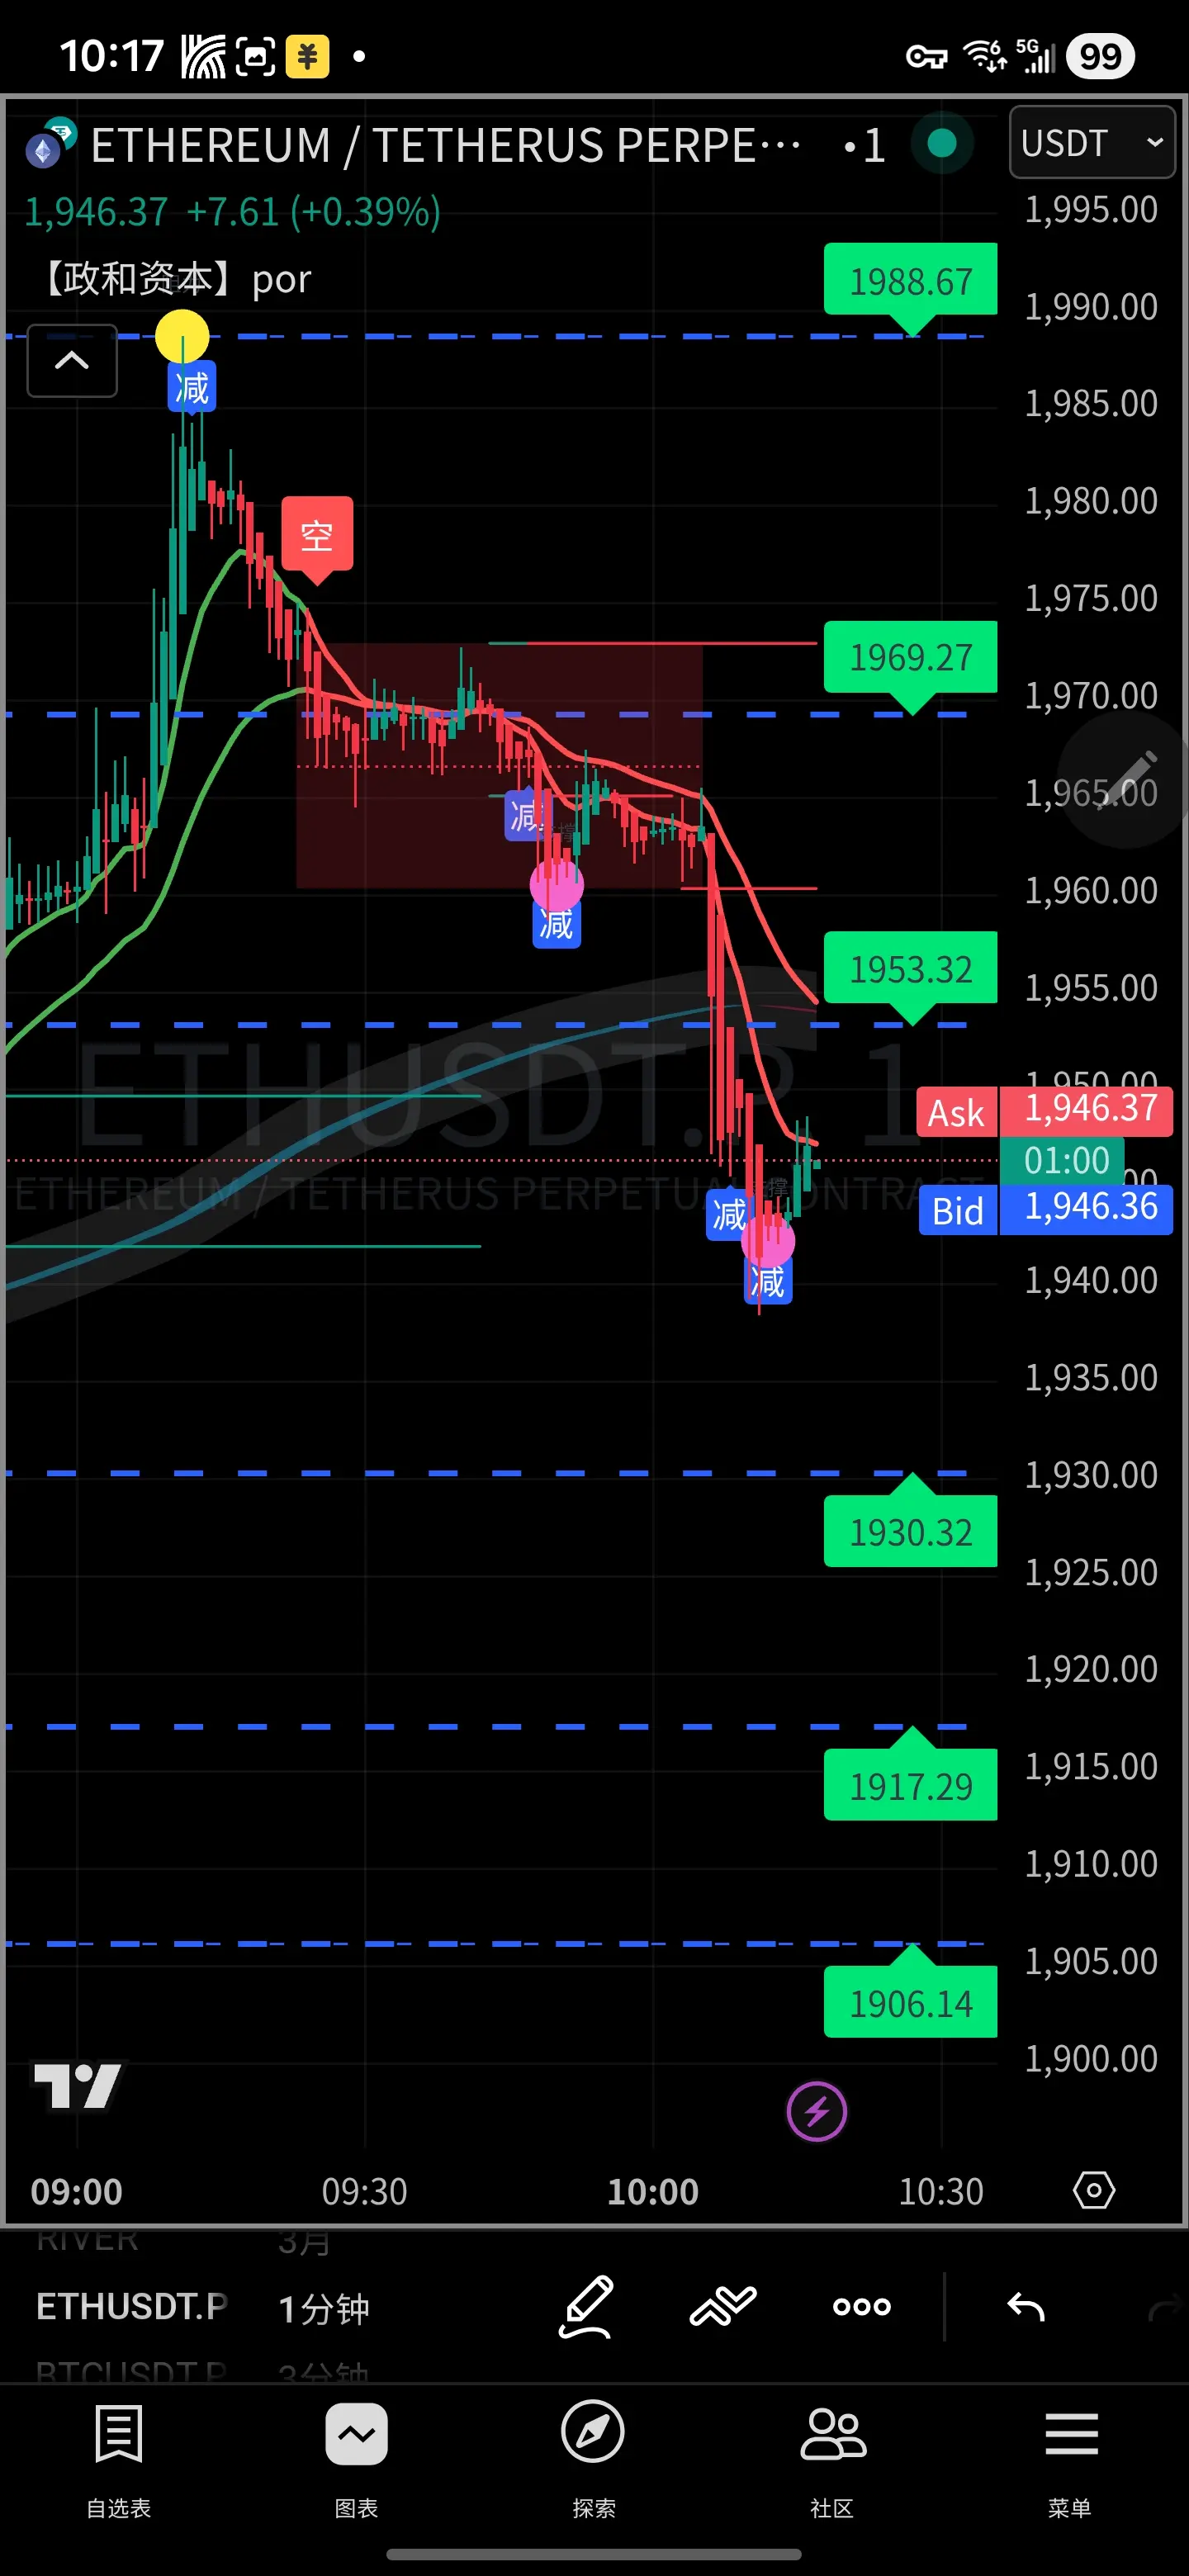
March 2 ETH Technical Analysis Strategy
Core Conclusion: ETH is currently trading around $1,988 with narrow-range consolidation. A sustained break above $2,000 is needed to continue the rebound, with strong resistance at $2,030-$2,050; if it falls back below $1,980, key support levels are at $1,960-$1,950. Overall, focus on buying low and selling high, strictly controlling leverage, and avoiding chasing rallies or panic selling.
Current Price and Market Overview
- Current Price: $1,988, 24h change **+2.1%**, trading volume has mildly increased.
- Market Characteristics: The hourly chart remain
ETH-4,18%
- Reward
- 1
- Comment
- Repost
- Share
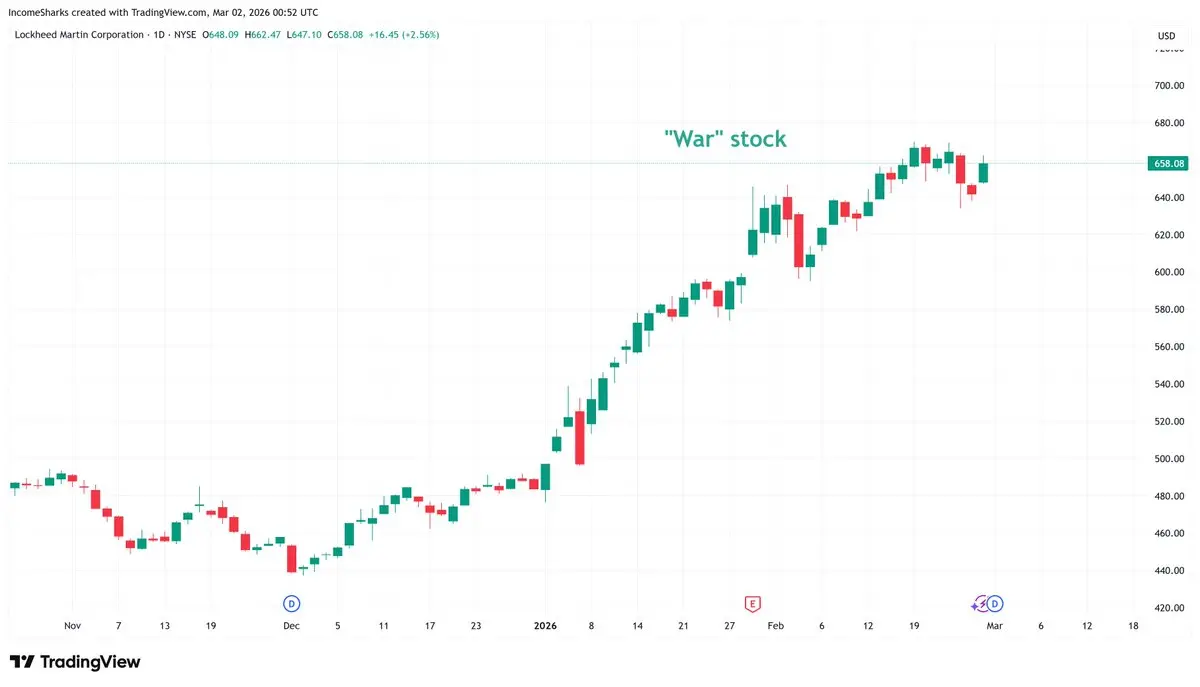
The charts say what's happening has been priced in. Prediction markets been talking about the strikes coming for months. War stocks and OIL been climbing. The buildup is the trade, yet people wait to panic AFTER the event because they trade headlines.
- Reward
- like
- Comment
- Repost
- Share

- Reward
- like
- Comment
- Repost
- Share
马年行好运
马年行好运
Created By@AJourneyThroughMountainsAnd
Listing Progress
0.00%
MC:
$0.1
More Tokens
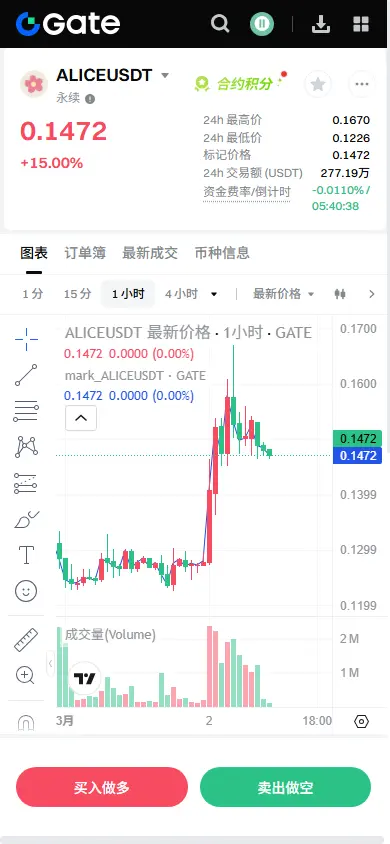
【$ALICE Signal】Pullback on Long Entry + 4H Massive Breakout Confirmed on Retest
$ALICE The 1H timeframe is currently in a healthy retracement after a massive rally, with price consolidating with decreasing volume around 0.147, which is a typical profit-taking phase. A single daily massive bullish candle (0.128 -> 0.158) on the 4H chart has completely reversed the downward trend, and the current retest is an excellent opportunity to re-enter.
🎯Direction: Long (Long)
⚡Entry/Order: 0.144 - 0.145 (High-probability zone based on order book depth)
🛑Stop Loss: 0.138 (Break below the 4H breakout low
View Original$ALICE The 1H timeframe is currently in a healthy retracement after a massive rally, with price consolidating with decreasing volume around 0.147, which is a typical profit-taking phase. A single daily massive bullish candle (0.128 -> 0.158) on the 4H chart has completely reversed the downward trend, and the current retest is an excellent opportunity to re-enter.
🎯Direction: Long (Long)
⚡Entry/Order: 0.144 - 0.145 (High-probability zone based on order book depth)
🛑Stop Loss: 0.138 (Break below the 4H breakout low
- Reward
- like
- Comment
- Repost
- Share
When is the best time to bottom fish in the US stock market? What am I waiting for?
First, I want to share some data with you:
1. Passive funds account for 55% of US fund assets.
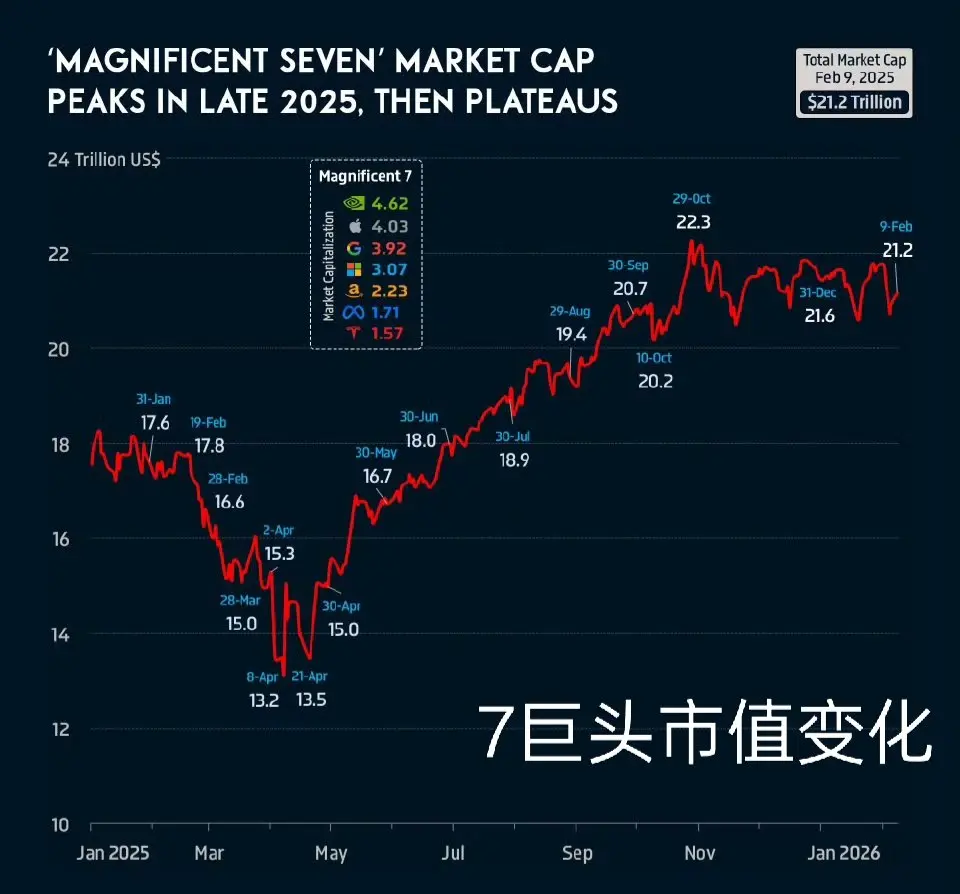
2. In the S&P 500, the seven giants have a combined weight of 34.3%.
3. The scale of financing to buy stocks has reached $1.226 trillion, a new all-time high.
4. Fund managers' cash positions are only 3.2%, nearly fully invested.
01, Passive funds account for 55% of US fund assets
In plain language: This means that market pricing power is shifting from active fund managers to passive index-tracking funds. When more th
View OriginalFirst, I want to share some data with you:
1. Passive funds account for 55% of US fund assets.
2. In the S&P 500, the seven giants have a combined weight of 34.3%.
3. The scale of financing to buy stocks has reached $1.226 trillion, a new all-time high.
4. Fund managers' cash positions are only 3.2%, nearly fully invested.
01, Passive funds account for 55% of US fund assets
In plain language: This means that market pricing power is shifting from active fund managers to passive index-tracking funds. When more th
- Reward
- like
- Comment
- Repost
- Share
#TrumpordersfederalbanonAnthropicAI
The confrontation between the U.S. federal government and Anthropic represents a defining inflection point in the global governance of artificial intelligence. What appears on the surface as a procurement ban is, in reality, a structural power struggle over who controls the operational boundaries of frontier AI systems. After Anthropic reportedly refused Pentagon demands to remove embedded safeguards preventing the use of its models for mass domestic surveillance and fully autonomous lethal weapons, President Donald Trump ordered all federal agencies to dis
The confrontation between the U.S. federal government and Anthropic represents a defining inflection point in the global governance of artificial intelligence. What appears on the surface as a procurement ban is, in reality, a structural power struggle over who controls the operational boundaries of frontier AI systems. After Anthropic reportedly refused Pentagon demands to remove embedded safeguards preventing the use of its models for mass domestic surveillance and fully autonomous lethal weapons, President Donald Trump ordered all federal agencies to dis

- Reward
- 2
- 2
- Repost
- Share
MrThanks77 :
:
2026 GOGOGO 👊View More
Liquidity Divergence Period, TRON Grows Against the Trend?
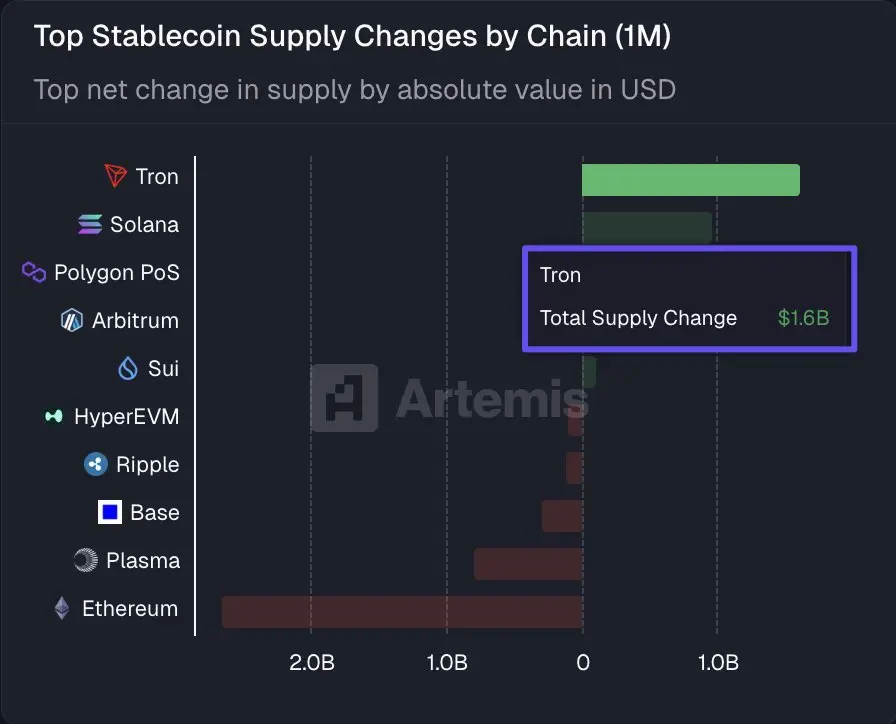
After the stablecoin data for February was released, it was quite straightforward.
The data shows that TRON's net increase in stablecoin supply for the month was about $1.6 billion, ranking first among all public blockchains.
The fluctuations in stablecoins, to some extent, reflect the movement of funds.
Where funds are flowing to indicates which chain users prefer for transfers, trading, and settlements.
TRON has maintained a stable advantage in stablecoin transfers over the years: low fees, fast confirmation speeds, and large transac
TRX-0,53%
- Reward
- like
- Comment
- Repost
- Share
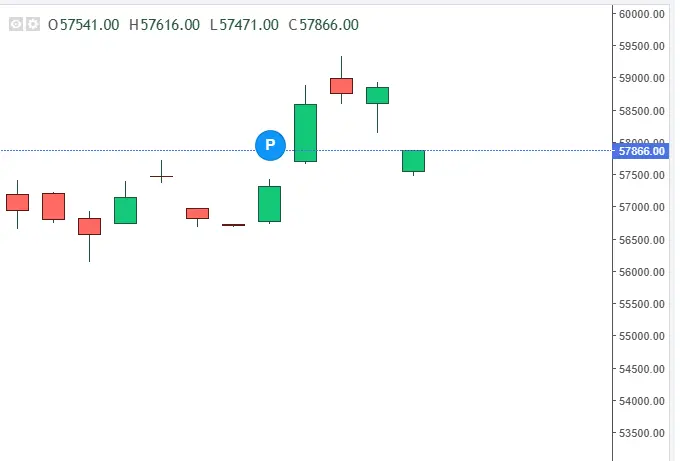
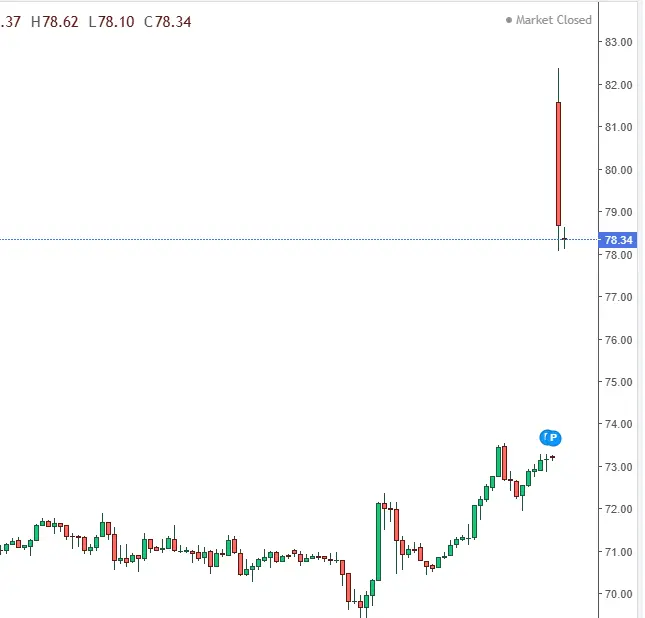
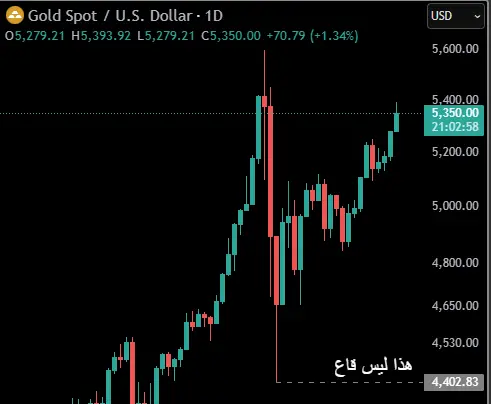
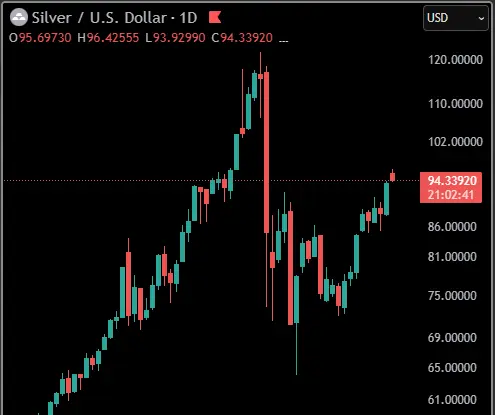
🚨 Urgent 🚨
The movement on the Japanese stock exchange and the metals gold and silver does not reflect the war that occurred over Iran.
Tokyo Stock Exchange opened with a limited gap.
Oil opened with a gap and is now heading towards the gap.
Gold and silver are slightly rising.
Things are good, it did not move as expected at the opening.
We are waiting for the evening session ⏳
View OriginalThe movement on the Japanese stock exchange and the metals gold and silver does not reflect the war that occurred over Iran.
Tokyo Stock Exchange opened with a limited gap.
Oil opened with a gap and is now heading towards the gap.
Gold and silver are slightly rising.
Things are good, it did not move as expected at the opening.
We are waiting for the evening session ⏳
- Reward
- like
- Comment
- Repost
- Share
#95%ofAltsBelow200-daySMA
95 Percent of Alts Below 200 Day SMA – Market at a Critical Point
Nearly 95 percent of altcoins are currently trading below their 200 day simple moving average, a key long term technical indicator used to measure overall trend direction. When assets remain below this level, it typically signals sustained bearish pressure and weakened momentum across the broader altcoin market.
This statistic highlights how widespread the correction has become beyond just a few major tokens. It reflects cautious sentiment, reduced speculative appetite, and capital rotation toward stro
- Reward
- 2
- 1
- Repost
- Share
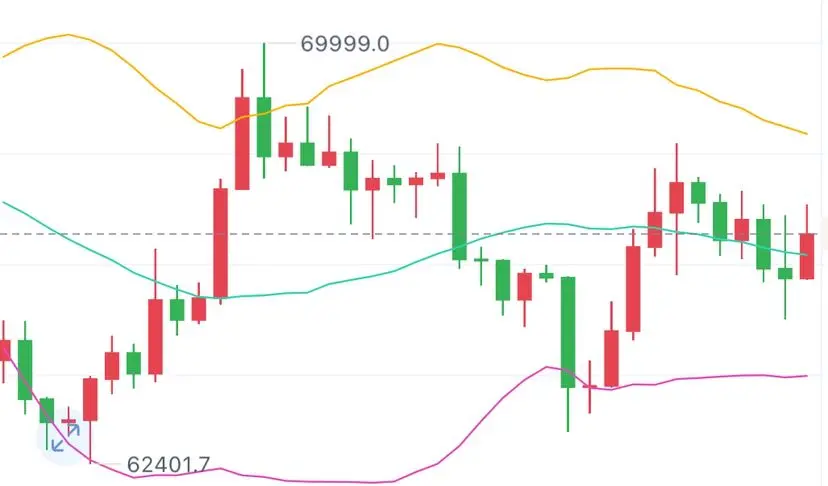
Discovery:
To The Moon 🌕$BTC #USIsraelStrikesIranBTCPlunges
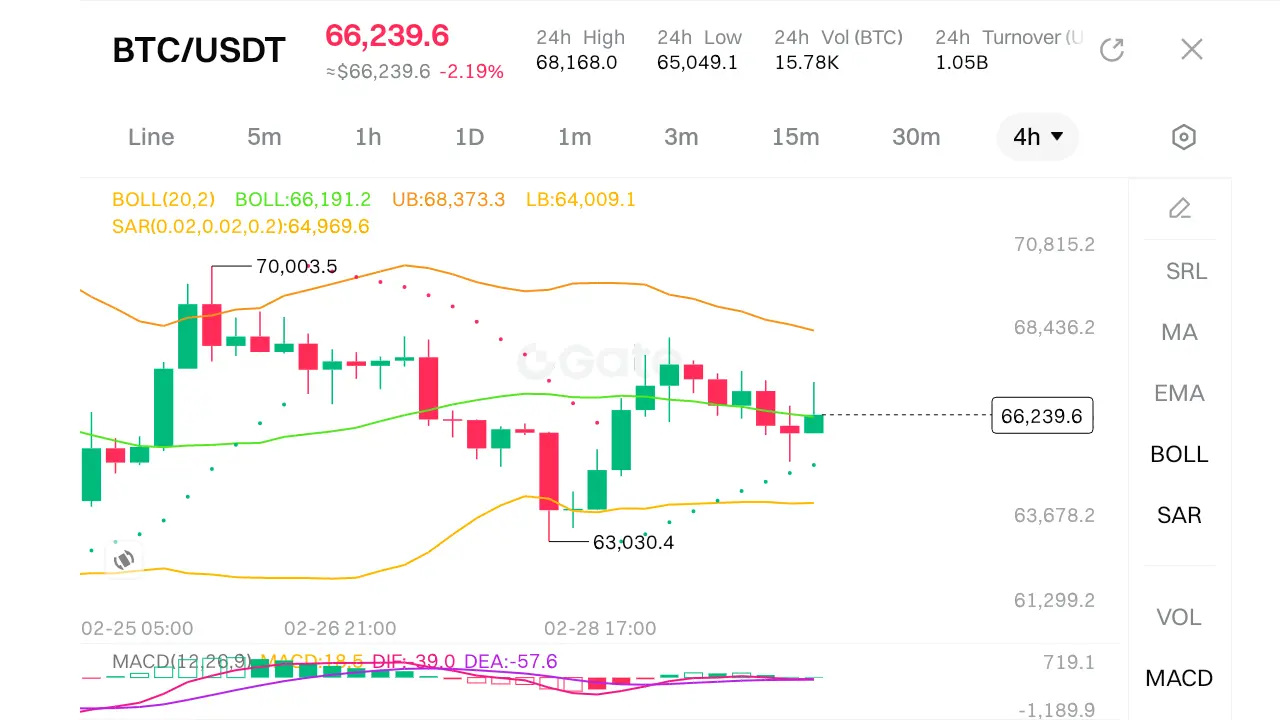
Here is a complete and in-depth technical analysis of the BTC/USDT chart based on the current market.
Overall Sentiment: Bearish Consolidation within a Broader Range
The chart presents a picture of Bitcoin caught between two forces. After a recent decline, price is attempting to stabilize, but the underlying momentum and key indicators suggest that bearish pressure is still dominant. The market is currently in a bearish consolidation phase, respecting lower highs while finding support near a critical long-term moving average.
1. Price Action & Market Struct
BTC-2,32%
- Reward
- 1
- Comment
- Repost
- Share
Load More
Join 40M users in our growing community
⚡️ Join 40M users in the crypto craze discussion
💬 Engage with your favorite top creators
👍 See what interests you
Trending Topics
View More42.48M Popularity
168.38K Popularity
153.3K Popularity
1.68M Popularity
533.46K Popularity
Hot Gate Fun
View More- MC:$2.37KHolders:10.00%
- MC:$0.1Holders:10.00%
- MC:$2.38KHolders:10.00%
- MC:$2.43KHolders:20.14%
- MC:$2.38KHolders:10.00%
News
View MoreFormer Hong Kong Monetary Authority Chief: The Hong Kong dollar is actually the biggest "USD stablecoin"
4 m
Trump Media & Technology Group: Considering spinning off the social platform Truth to prioritize the development of cryptocurrency business
4 m
The U.S. Department of Defense will hold a press conference regarding military actions against Iran
7 m
Tron’s stablecoin supply increased by a net of $1.6 billion in February, ranking first.
10 m
Data: In the past 24 hours, the entire network has liquidated $356 million, with long positions liquidated at $243 million and short positions at $113 million.
12 m
Pin