#FirstTradeOfTheWeek
Bitcoin Weekly Trading Plan - Technical Analysis & Price Action
Current Market Snapshot
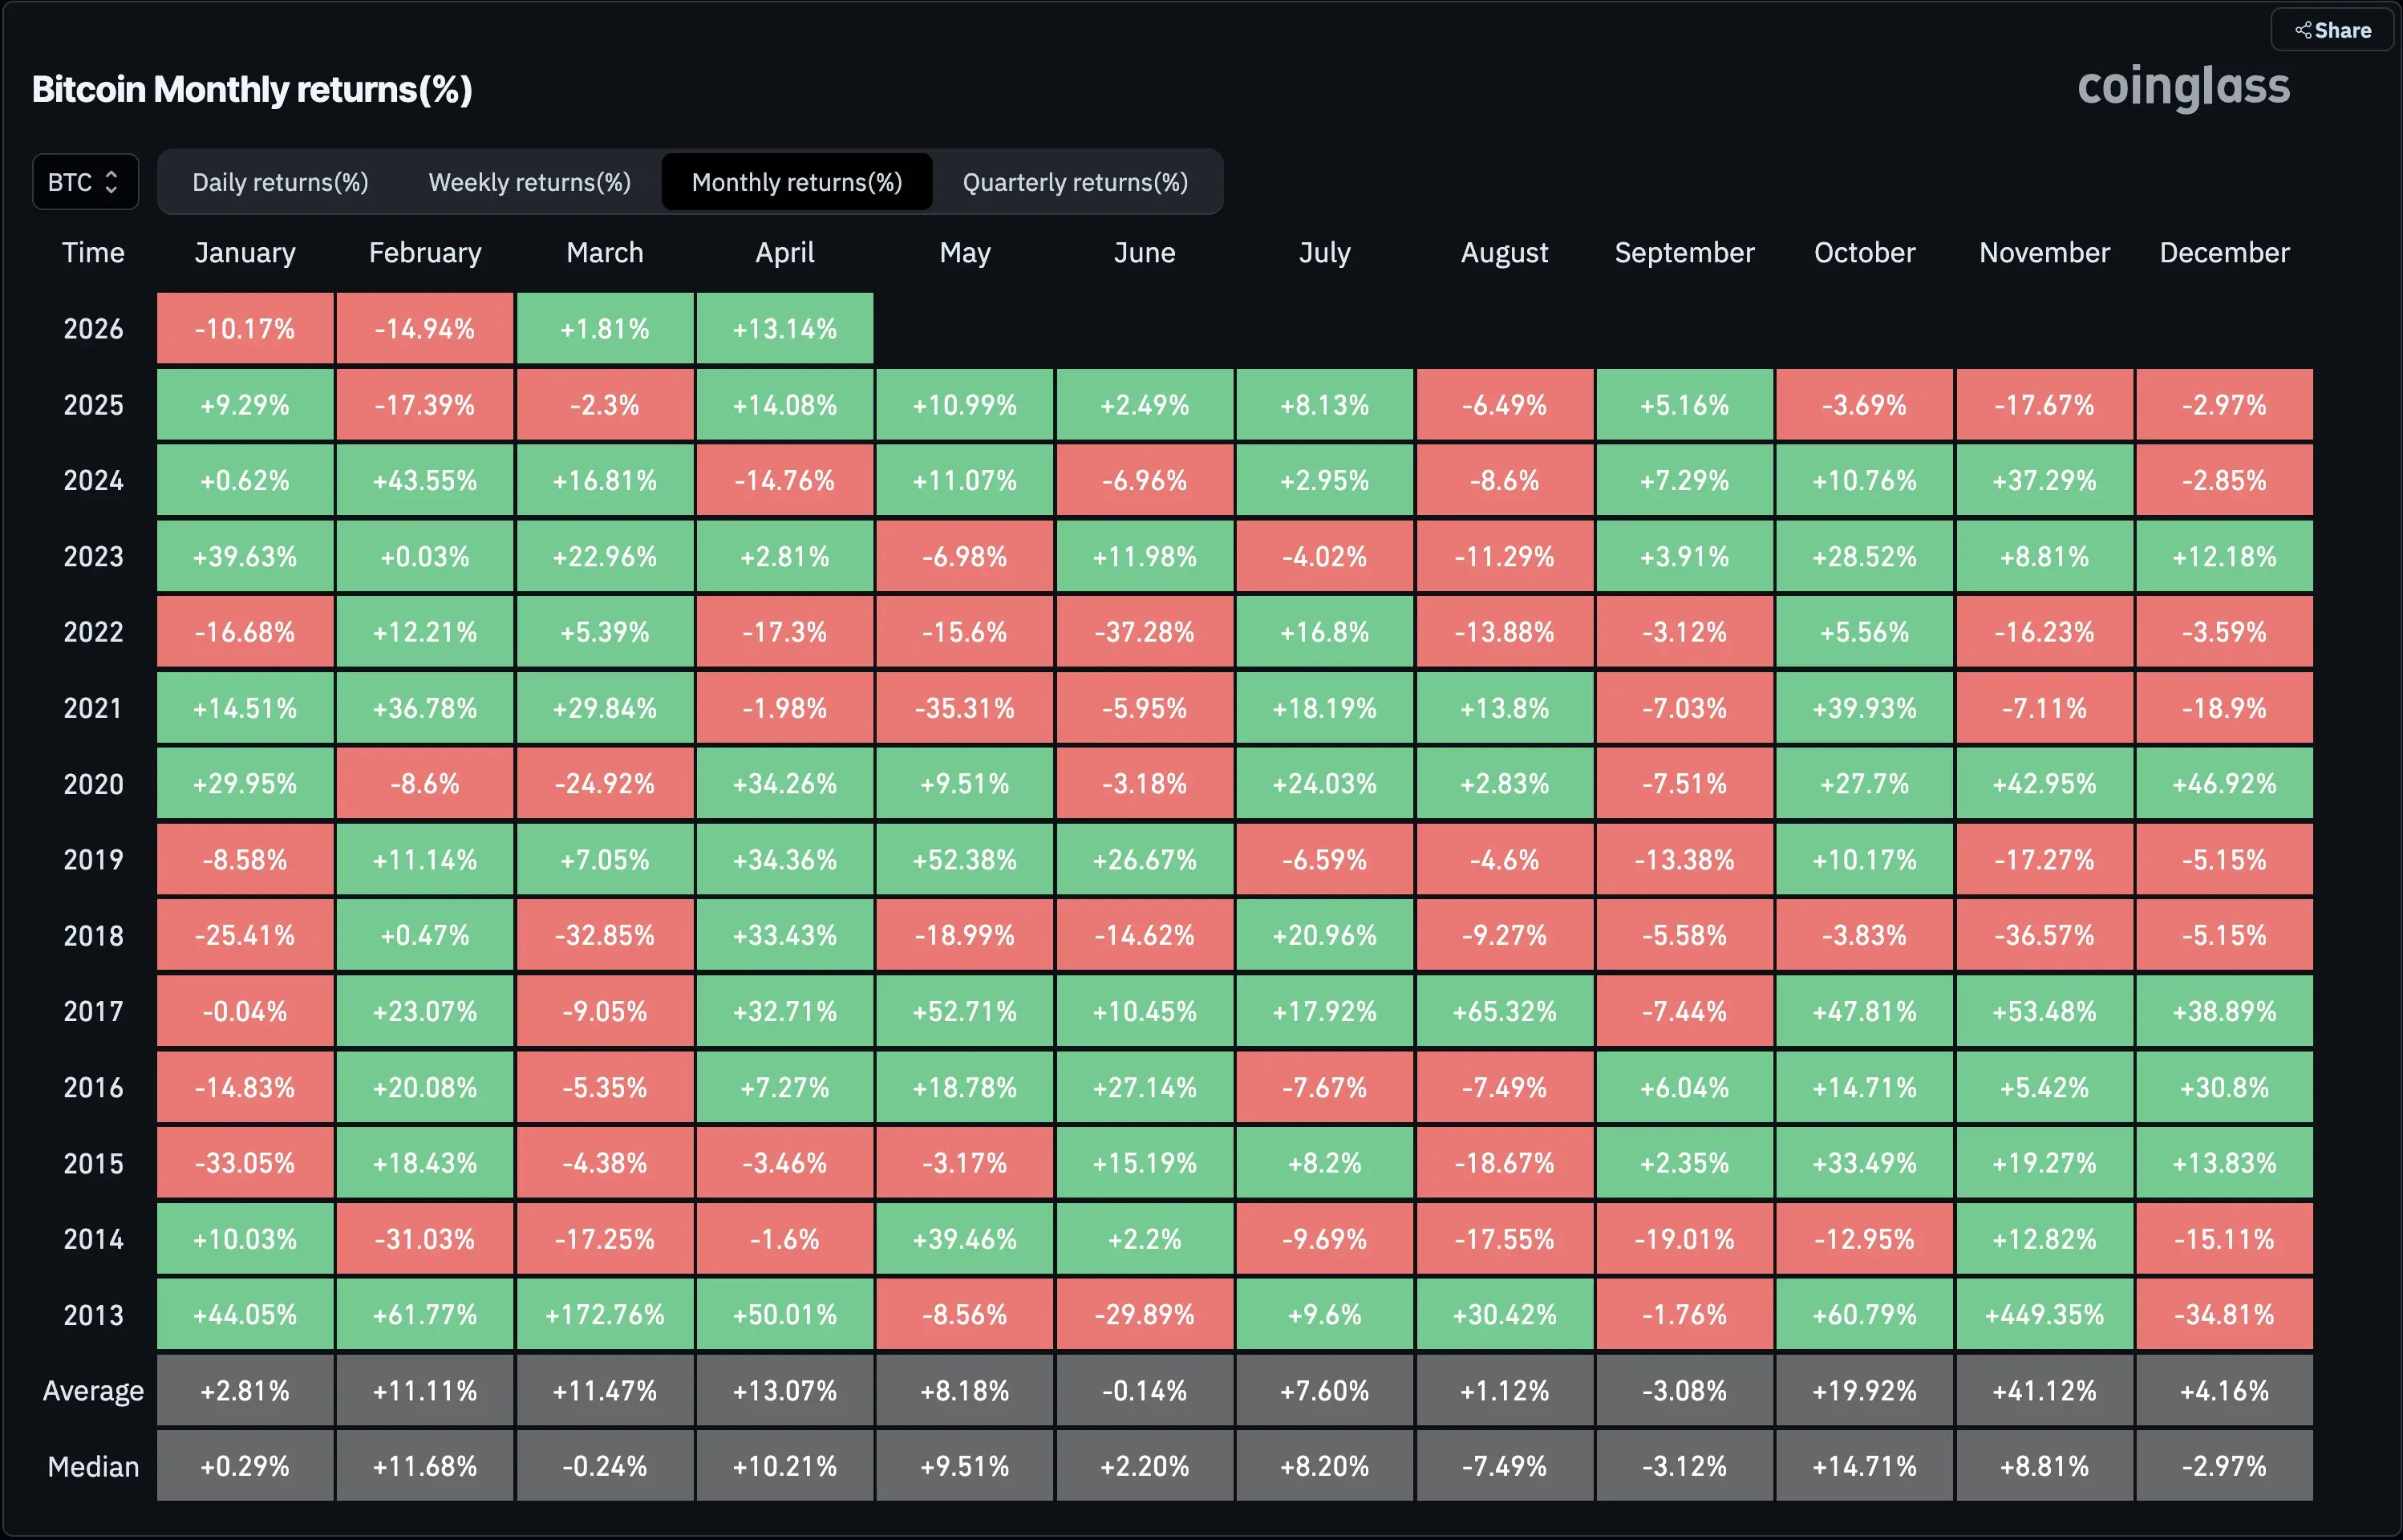
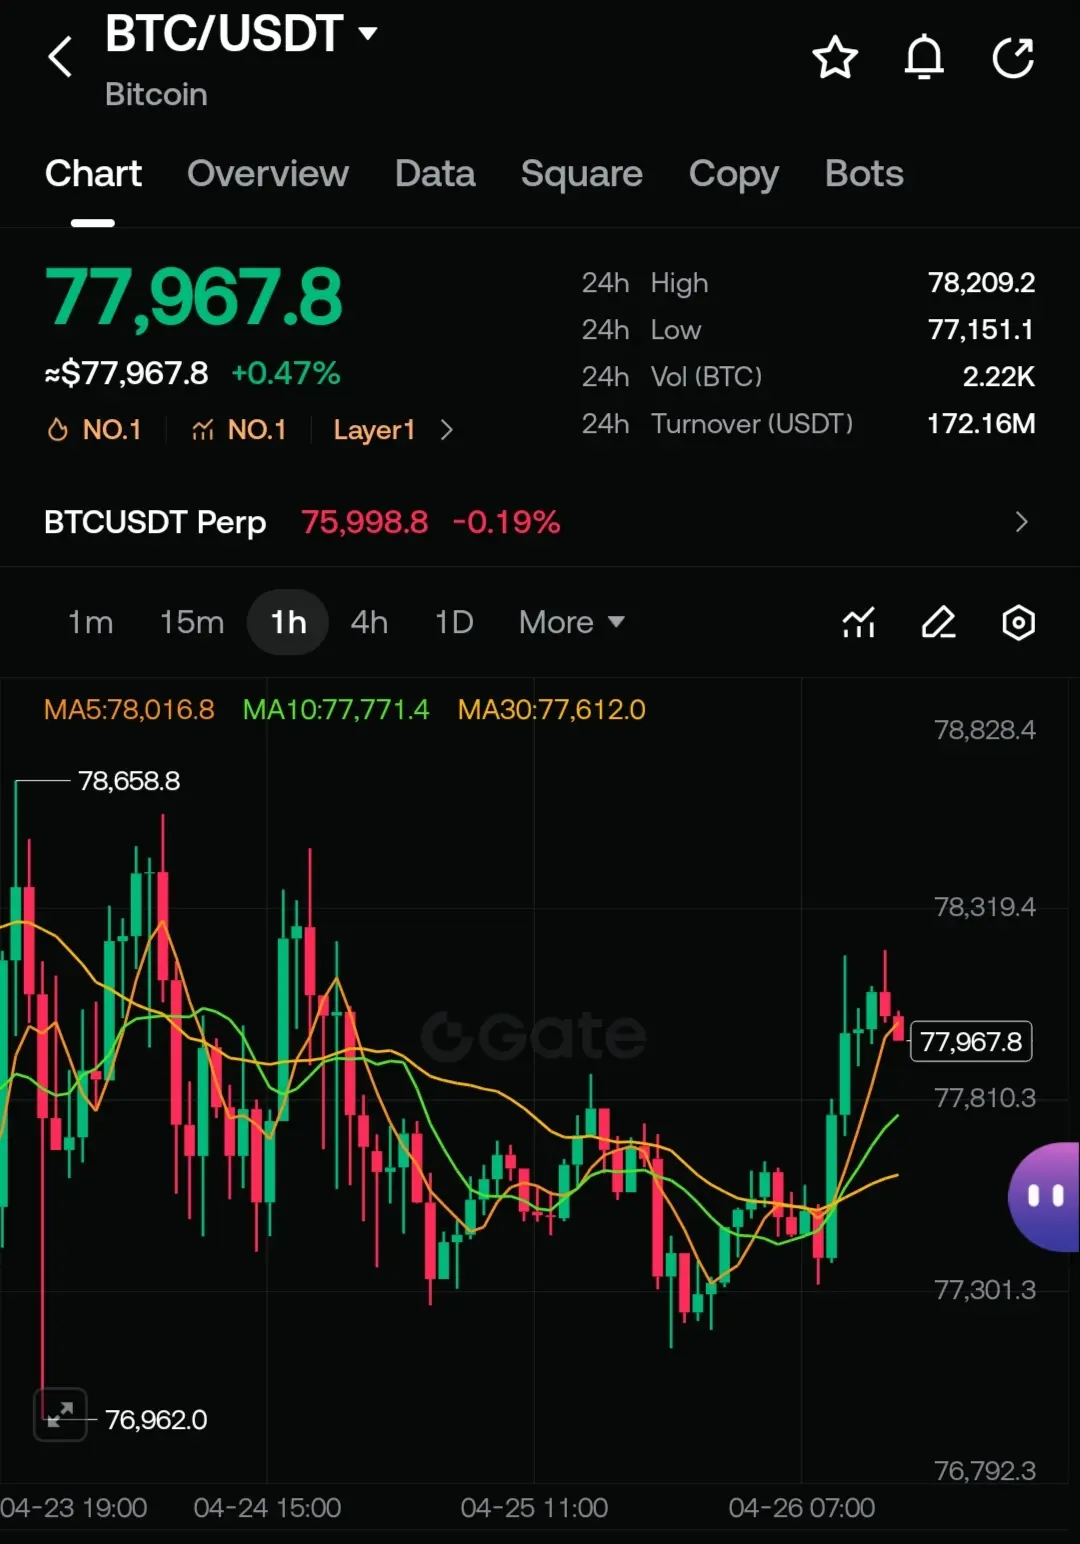
BTC Price: $77,984 | 24h Change: +0.28% | 7D Change: +2.83% | 30D Change: +17.48%
Weekly Technical Overview
TREND ANALYSIS: MIXED WITH CAUTION
Timeframe Analysis:
15-Minute Chart: BULLISH MOMENTUM
- MA7 > MA30 > MA120 (Golden Cross Formation)
- PDI (29.78) > MDI (17.31) with ADX at 33.22 - Strong uptrend
- SAR at 77935, below price action - Confirms bullish bias
- Short-term momentum favors upside
Daily Chart: BEARISH DIVERGENCE WARNING
- CCI at 101.40 - Overbought territory
- WR at -16.62 - Overbought signal
- MACD Top Divergence detected: Price made new high at $78,209 but MACD histogram declined from 282 to 230
- SAR at 77151, above recent price - Bearish reversal pattern forming
- Price closed below MA20 (78017) - Short-term weakness
Key Support & Resistance Levels
RESISTANCE LEVELS:
R1: $78,200 (24h High)
R2: $80,000 (Psychological Resistance)
R3: $82,500 (Previous Supply Zone)
SUPPORT LEVELS:
S1: $77,400 (CME Gap Fill Zone)
S2: $77,150 (24h Low)
S3: $75,000 (Major Support)
Technical Indicators Summary
BULLISH SIGNALS:
- Volume surge: 24h volume at 173M vs 7-day average of 6,161
- 15-minute trend strength with ADX above 30
- Price holding above $77,000 support
- Institutional accumulation continues (Strategy now holds 815,061 BTC, surpassing BlackRock)
BEARISH SIGNALS:
- MACD divergence on daily timeframe
- Daily CCI and WR in overbought zone
- Price rejected at $78,200 resistance
- Closed below 20-day MA
- Fear & Greed Index at 33 (Fear territory)
Market Sentiment
Social Media Metrics:
- Bullish tweets: 192 vs Bearish: 32 (6:1 ratio)
- 66% positive sentiment vs 16% negative
- Major narrative: CME gap at $77,400 likely to fill
- Institutional buying remains strong
Weekly Trading Strategy
SCENARIO A: BULLISH BREAKOUT (Probability: 40%)
Entry: Break above $78,500 with volume
Target 1: $80,000
Target 2: $82,500
Stop Loss: $76,800
SCENARIO B: RANGE BOUND (Probability: 45%)
Range: $77,400 - $78,200
Strategy: Scalp longs at support, shorts at resistance
Invalidation: Break of either level with volume
SCENARIO C: BEARISH REVERSAL (Probability: 15%)
Entry: Break below $77,150
Target 1: $75,000
Target 2: $73,500
Stop Loss: $78,000
Risk Management
Position Size: Max 3% risk per trade
Leverage: Recommended 3-5x for swing trades
Key Watch: CME gap fill at $77,400 - Historical data shows 90% of CME gaps fill within one week
Weekly Outlook
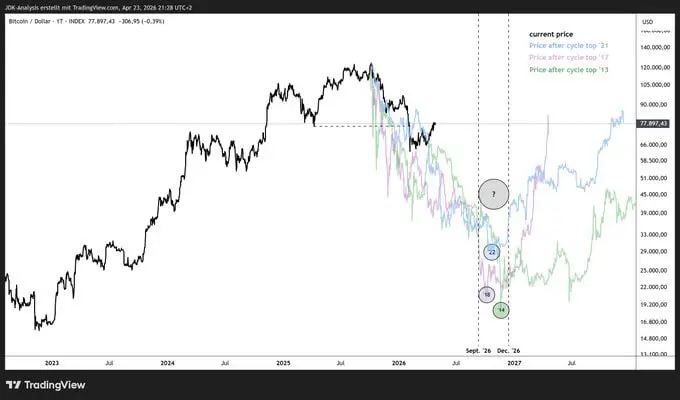
Bitcoin faces a critical test at the $78,000-$80,000 resistance zone. While short-term momentum remains bullish on lower timeframes, the daily MACD divergence and overbought conditions suggest caution. The CME gap at $77,400 acts as a magnet for price action.
Institutional flows remain supportive with Strategy (MicroStrategy) now the largest single BTC holder at 815,061 BTC. However, retail sentiment shows fear at 33 on the Fear & Greed Index, suggesting room for further upside if confidence returns.
Key Events to Watch:
- CME gap fill completion
- $80,000 psychological level test
- Institutional ETF flows
- Macro economic data releases
Trade Safe. Manage Risk.
#BTC
#CryptoMarketSeesVolatility
Bitcoin Weekly Trading Plan - Technical Analysis & Price Action
Current Market Snapshot
BTC Price: $77,984 | 24h Change: +0.28% | 7D Change: +2.83% | 30D Change: +17.48%
Weekly Technical Overview
TREND ANALYSIS: MIXED WITH CAUTION
Timeframe Analysis:
15-Minute Chart: BULLISH MOMENTUM
- MA7 > MA30 > MA120 (Golden Cross Formation)
- PDI (29.78) > MDI (17.31) with ADX at 33.22 - Strong uptrend
- SAR at 77935, below price action - Confirms bullish bias
- Short-term momentum favors upside
Daily Chart: BEARISH DIVERGENCE WARNING
- CCI at 101.40 - Overbought territory
- WR at -16.62 - Overbought signal
- MACD Top Divergence detected: Price made new high at $78,209 but MACD histogram declined from 282 to 230
- SAR at 77151, above recent price - Bearish reversal pattern forming
- Price closed below MA20 (78017) - Short-term weakness
Key Support & Resistance Levels
RESISTANCE LEVELS:
R1: $78,200 (24h High)
R2: $80,000 (Psychological Resistance)
R3: $82,500 (Previous Supply Zone)
SUPPORT LEVELS:
S1: $77,400 (CME Gap Fill Zone)
S2: $77,150 (24h Low)
S3: $75,000 (Major Support)
Technical Indicators Summary
BULLISH SIGNALS:
- Volume surge: 24h volume at 173M vs 7-day average of 6,161
- 15-minute trend strength with ADX above 30
- Price holding above $77,000 support
- Institutional accumulation continues (Strategy now holds 815,061 BTC, surpassing BlackRock)
BEARISH SIGNALS:
- MACD divergence on daily timeframe
- Daily CCI and WR in overbought zone
- Price rejected at $78,200 resistance
- Closed below 20-day MA
- Fear & Greed Index at 33 (Fear territory)
Market Sentiment
Social Media Metrics:
- Bullish tweets: 192 vs Bearish: 32 (6:1 ratio)
- 66% positive sentiment vs 16% negative
- Major narrative: CME gap at $77,400 likely to fill
- Institutional buying remains strong
Weekly Trading Strategy
SCENARIO A: BULLISH BREAKOUT (Probability: 40%)
Entry: Break above $78,500 with volume
Target 1: $80,000
Target 2: $82,500
Stop Loss: $76,800
SCENARIO B: RANGE BOUND (Probability: 45%)
Range: $77,400 - $78,200
Strategy: Scalp longs at support, shorts at resistance
Invalidation: Break of either level with volume
SCENARIO C: BEARISH REVERSAL (Probability: 15%)
Entry: Break below $77,150
Target 1: $75,000
Target 2: $73,500
Stop Loss: $78,000
Risk Management
Position Size: Max 3% risk per trade
Leverage: Recommended 3-5x for swing trades
Key Watch: CME gap fill at $77,400 - Historical data shows 90% of CME gaps fill within one week
Weekly Outlook
Bitcoin faces a critical test at the $78,000-$80,000 resistance zone. While short-term momentum remains bullish on lower timeframes, the daily MACD divergence and overbought conditions suggest caution. The CME gap at $77,400 acts as a magnet for price action.
Institutional flows remain supportive with Strategy (MicroStrategy) now the largest single BTC holder at 815,061 BTC. However, retail sentiment shows fear at 33 on the Fear & Greed Index, suggesting room for further upside if confidence returns.
Key Events to Watch:
- CME gap fill completion
- $80,000 psychological level test
- Institutional ETF flows
- Macro economic data releases
Trade Safe. Manage Risk.
#BTC
#CryptoMarketSeesVolatility