Trade
Basic
Futures
Futures
Hundreds of contracts settled in USDT or BTC
TradFi
Gold
Trade global traditional assets with USDT in one place
Options
Hot
Trade European-style vanilla options
Unified Account
Maximize your capital efficiency
Demo Trading
Futures Kickoff
Get prepared for your futures trading
Futures Events
Participate in events to win generous rewards
Demo Trading
Use virtual funds to experience risk-free trading
Earn
Launch
CandyDrop
Collect candies to earn airdrops
Launchpool
Quick staking, earn potential new tokens
HODLer Airdrop
Hold GT and get massive airdrops for free
Launchpad
Be early to the next big token project
Alpha Points
Trade on-chain assets and enjoy airdrop rewards!
Futures Points
Earn futures points and claim airdrop rewards
Investment
Simple Earn
Earn interests with idle tokens
Auto-Invest
Auto-invest on a regular basis
Dual Investment
Buy low and sell high to take profits from price fluctuations
Soft Staking
Earn rewards with flexible staking
Crypto Loan
0 Fees
Pledge one crypto to borrow another
Lending Center
One-stop lending hub
VIP Wealth Hub
Customized wealth management empowers your assets growth
Private Wealth Management
Customized asset management to grow your digital assets
Quant Fund
Top asset management team helps you profit without hassle
Staking
Stake cryptos to earn in PoS products
Smart Leverage
New
No forced liquidation before maturity, worry-free leveraged gains
GUSD Minting
Use USDT/USDC to mint GUSD for treasury-level yields
More
WayOfFlow
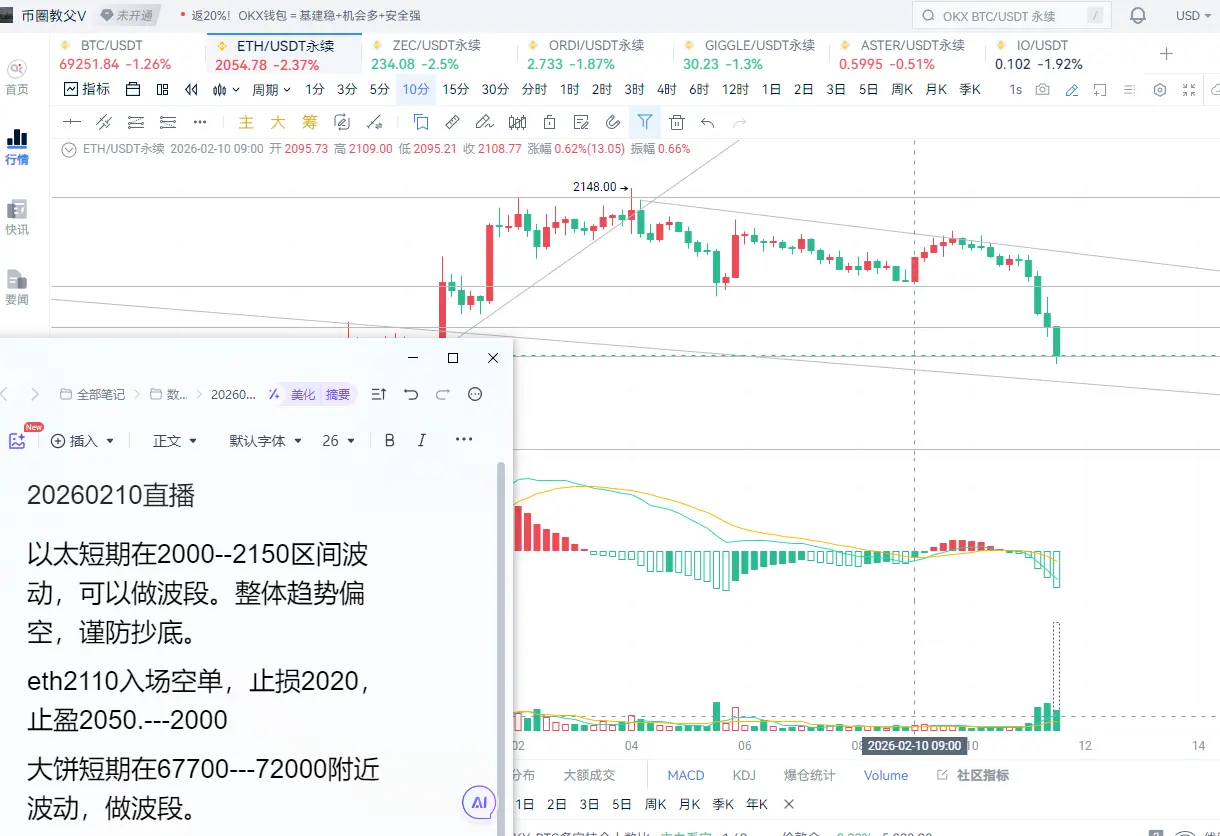
February 10, 2026 -- Personal Monitoring Record
#不构成投资建议,仅做个人记录
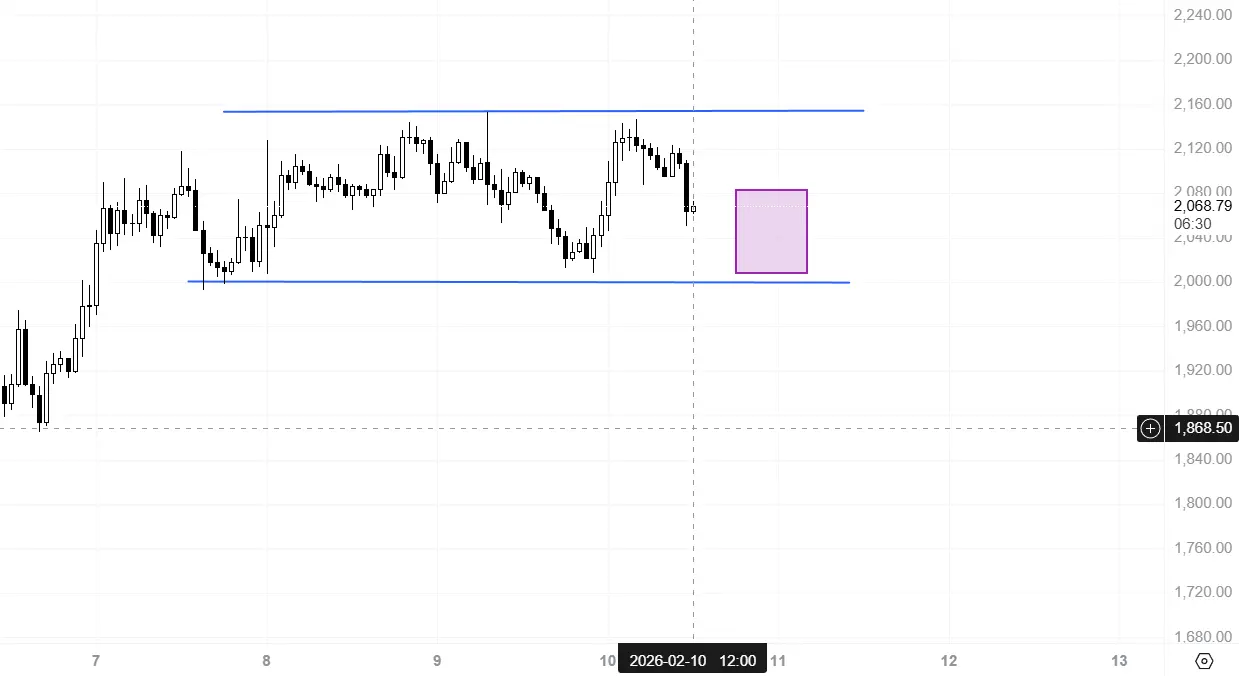
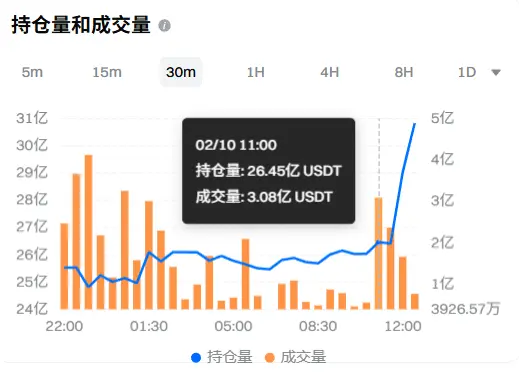
Figure 1: ETH-1h; Figure 2: ETH-30m Open Interest
Currently still in a consolidation range. Open interest increased at 12:00.
Be cautious after 5:00 PM.
#不构成投资建议,仅做个人记录
Figure 1: ETH-1h; Figure 2: ETH-30m Open Interest
Currently still in a consolidation range. Open interest increased at 12:00.
Be cautious after 5:00 PM.
ETH-0,83%
- Reward
- 1
- 1
- Repost
- Share
Mr.LV :
:
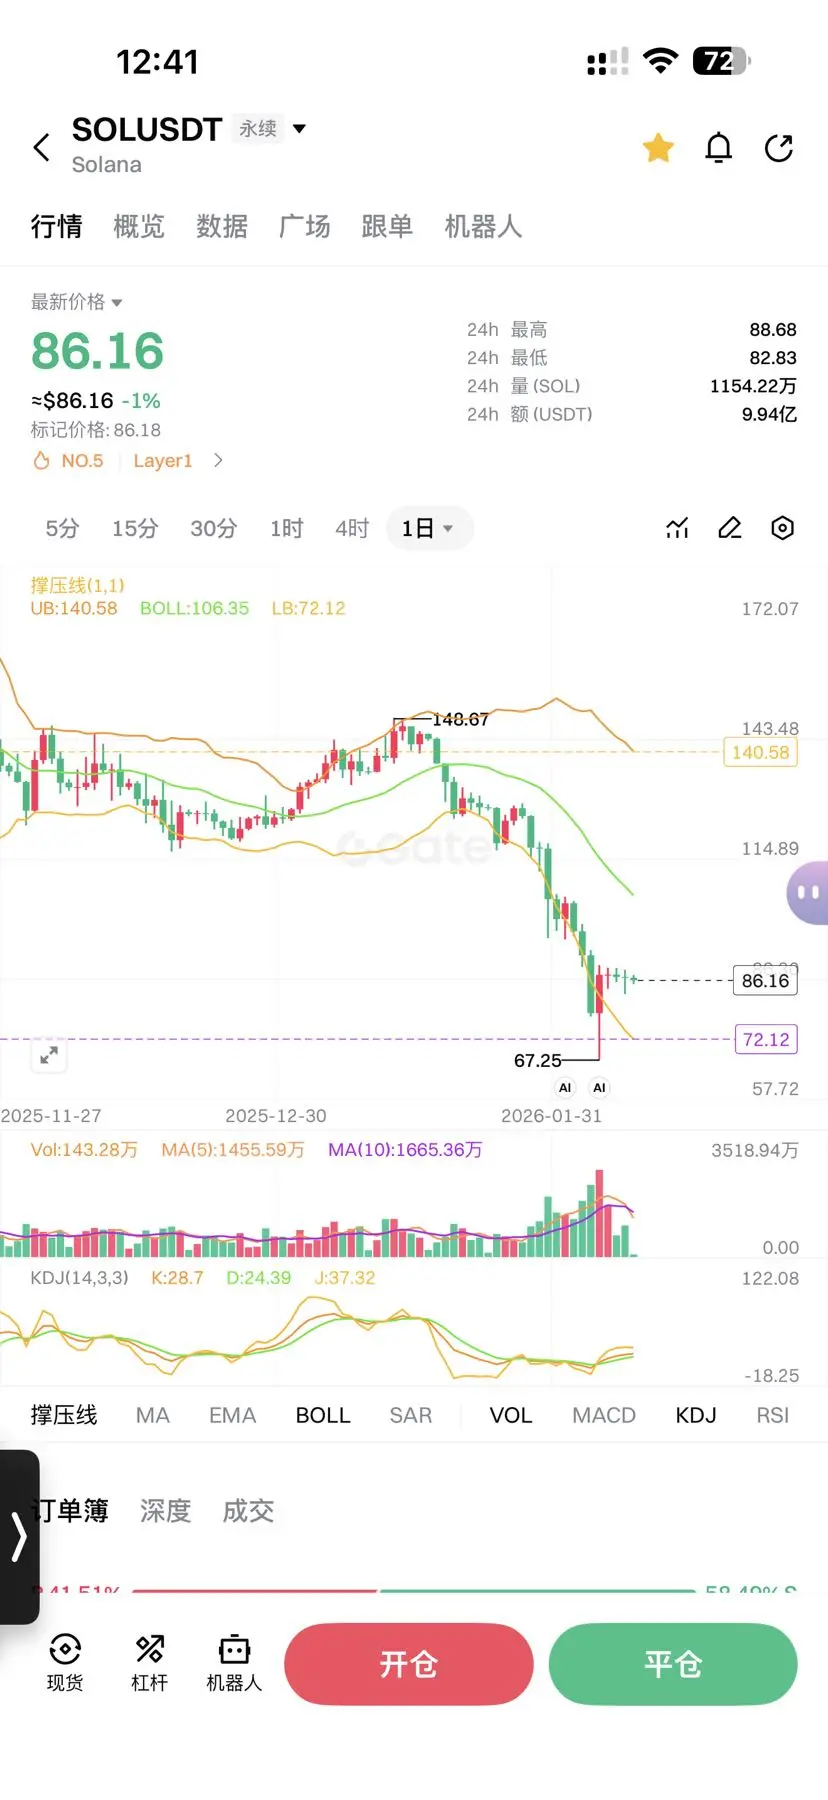
😏😀😏😀😏😀😏😀😏😀😀😏😀😏😏😀😀😏😏😀😏😀😏😀😏😀$SOL Is this bear market worth bottom-fishing and deploying?
First, let me explain why I am optimistic about SOL's fundamentals.
The main reason SOL can achieve dozens of times gains in this bull market is that it has accurately tapped into the attention economy and the emotional consumption needs of this generation.
In the future, it’s unlikely that everyone will get involved in DeFi to create complex financial products. Instead, memes, social media, and lightweight applications will emerge one after another. When humans are no longer anxious about survival itself but are more willing
SOL-0,64%

- Reward
- 1
- 3
- Repost
- Share
SadBeerBelly :
:
多吗?View More
Participate in horse racing betting, complete tasks to earn horse racing tickets, and enjoy a million red envelope rain daily, sharing a prize pool of 100,000 USDT at Gate 2026 Spring Festival Celebration. https://www.gate.com/competition/year-of-horse-2026?ref_type=165&utm_cmp=7EQB9Jba&ref=VVHDXVTXBW
View Original
- Reward
- like
- Comment
- Repost
- Share
Ai
Ai
Created By@Carplay
Listing Progress
0.14%
MC:
$2.42K
Create My Token
Participate in horse racing betting, complete tasks to earn horse racing tickets, and enjoy a million red envelope rain daily, sharing a prize pool of 100,000 USDT at the Gate 2026 Spring Festival Celebration. https://www.gate.com/competition/year-of-horse-2026?ref_type=165&utm_cmp=7EQB9Jba&ref=UwcRUgpZ
View Original
- Reward
- like
- Comment
- Repost
- Share
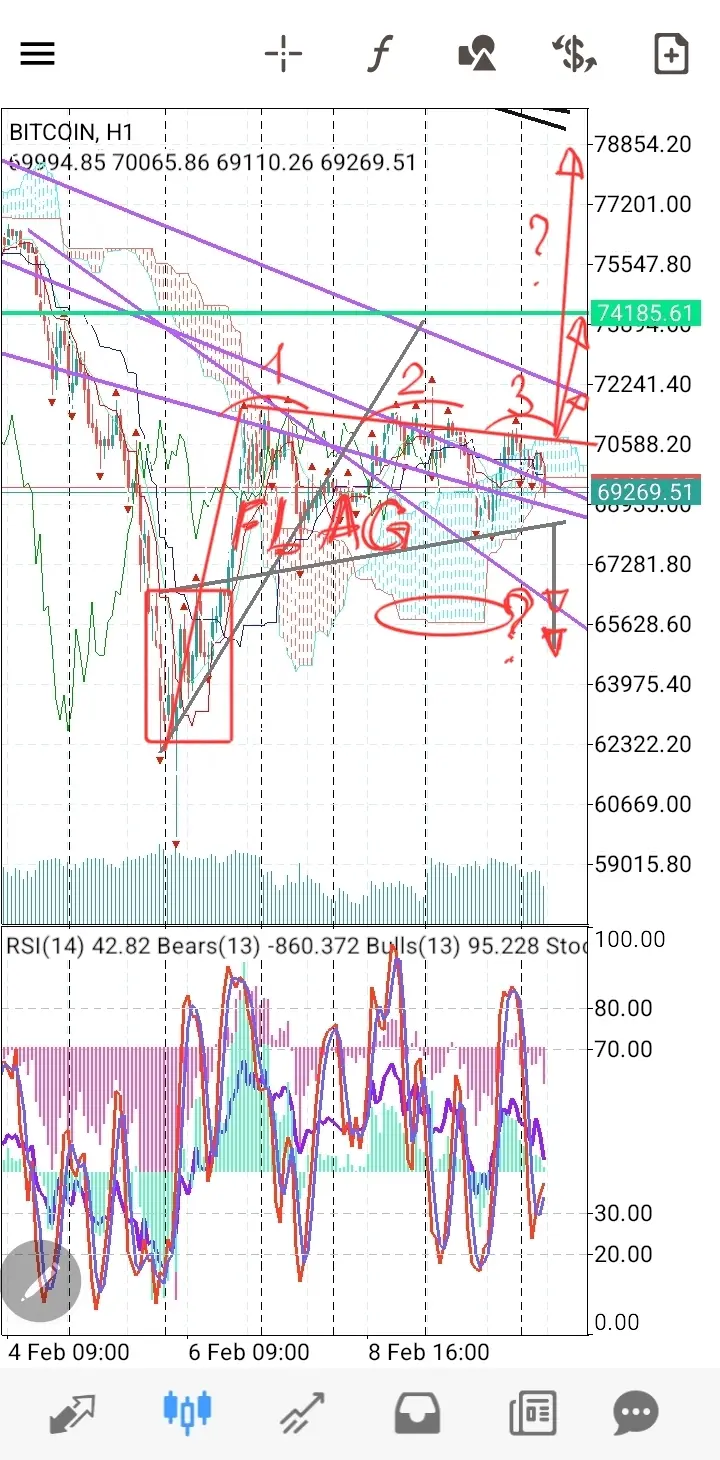
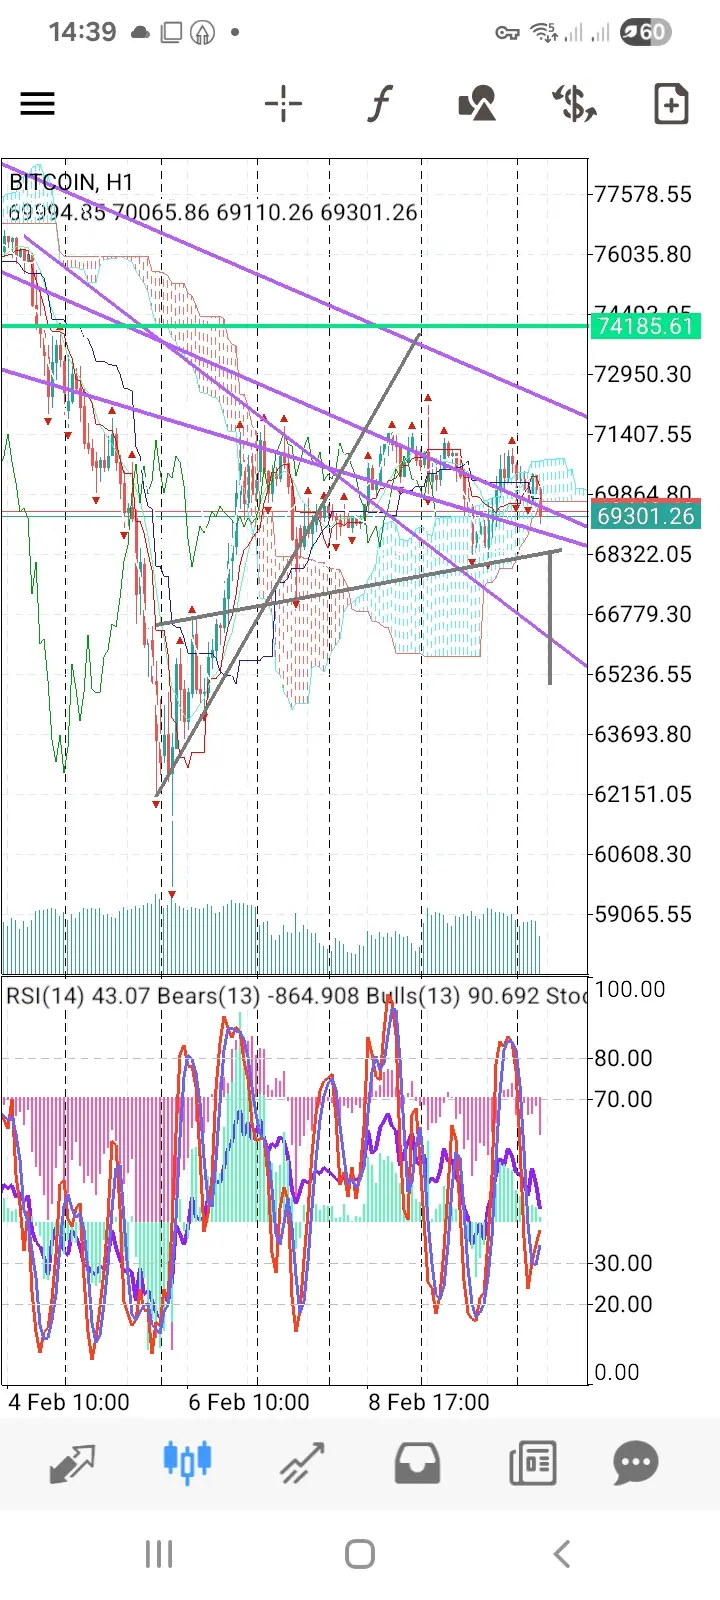
$ETH made a very nice bounce this nigt at the american session but this is only for a short-turm bull's attention.
Saying this, I should mention a paradime when Europe sells, NY - buys. But this means nothing as it all about "flat" situation these days after shock!
3 things we need to watch now:
1. Bull's flag with ascending lows
2. 3 tops
3. Volumes
Take care!
Cheers!
Saying this, I should mention a paradime when Europe sells, NY - buys. But this means nothing as it all about "flat" situation these days after shock!
3 things we need to watch now:
1. Bull's flag with ascending lows
2. 3 tops
3. Volumes
Take care!
Cheers!
ETH-0,83%
- Reward
- 1
- Comment
- Repost
- Share
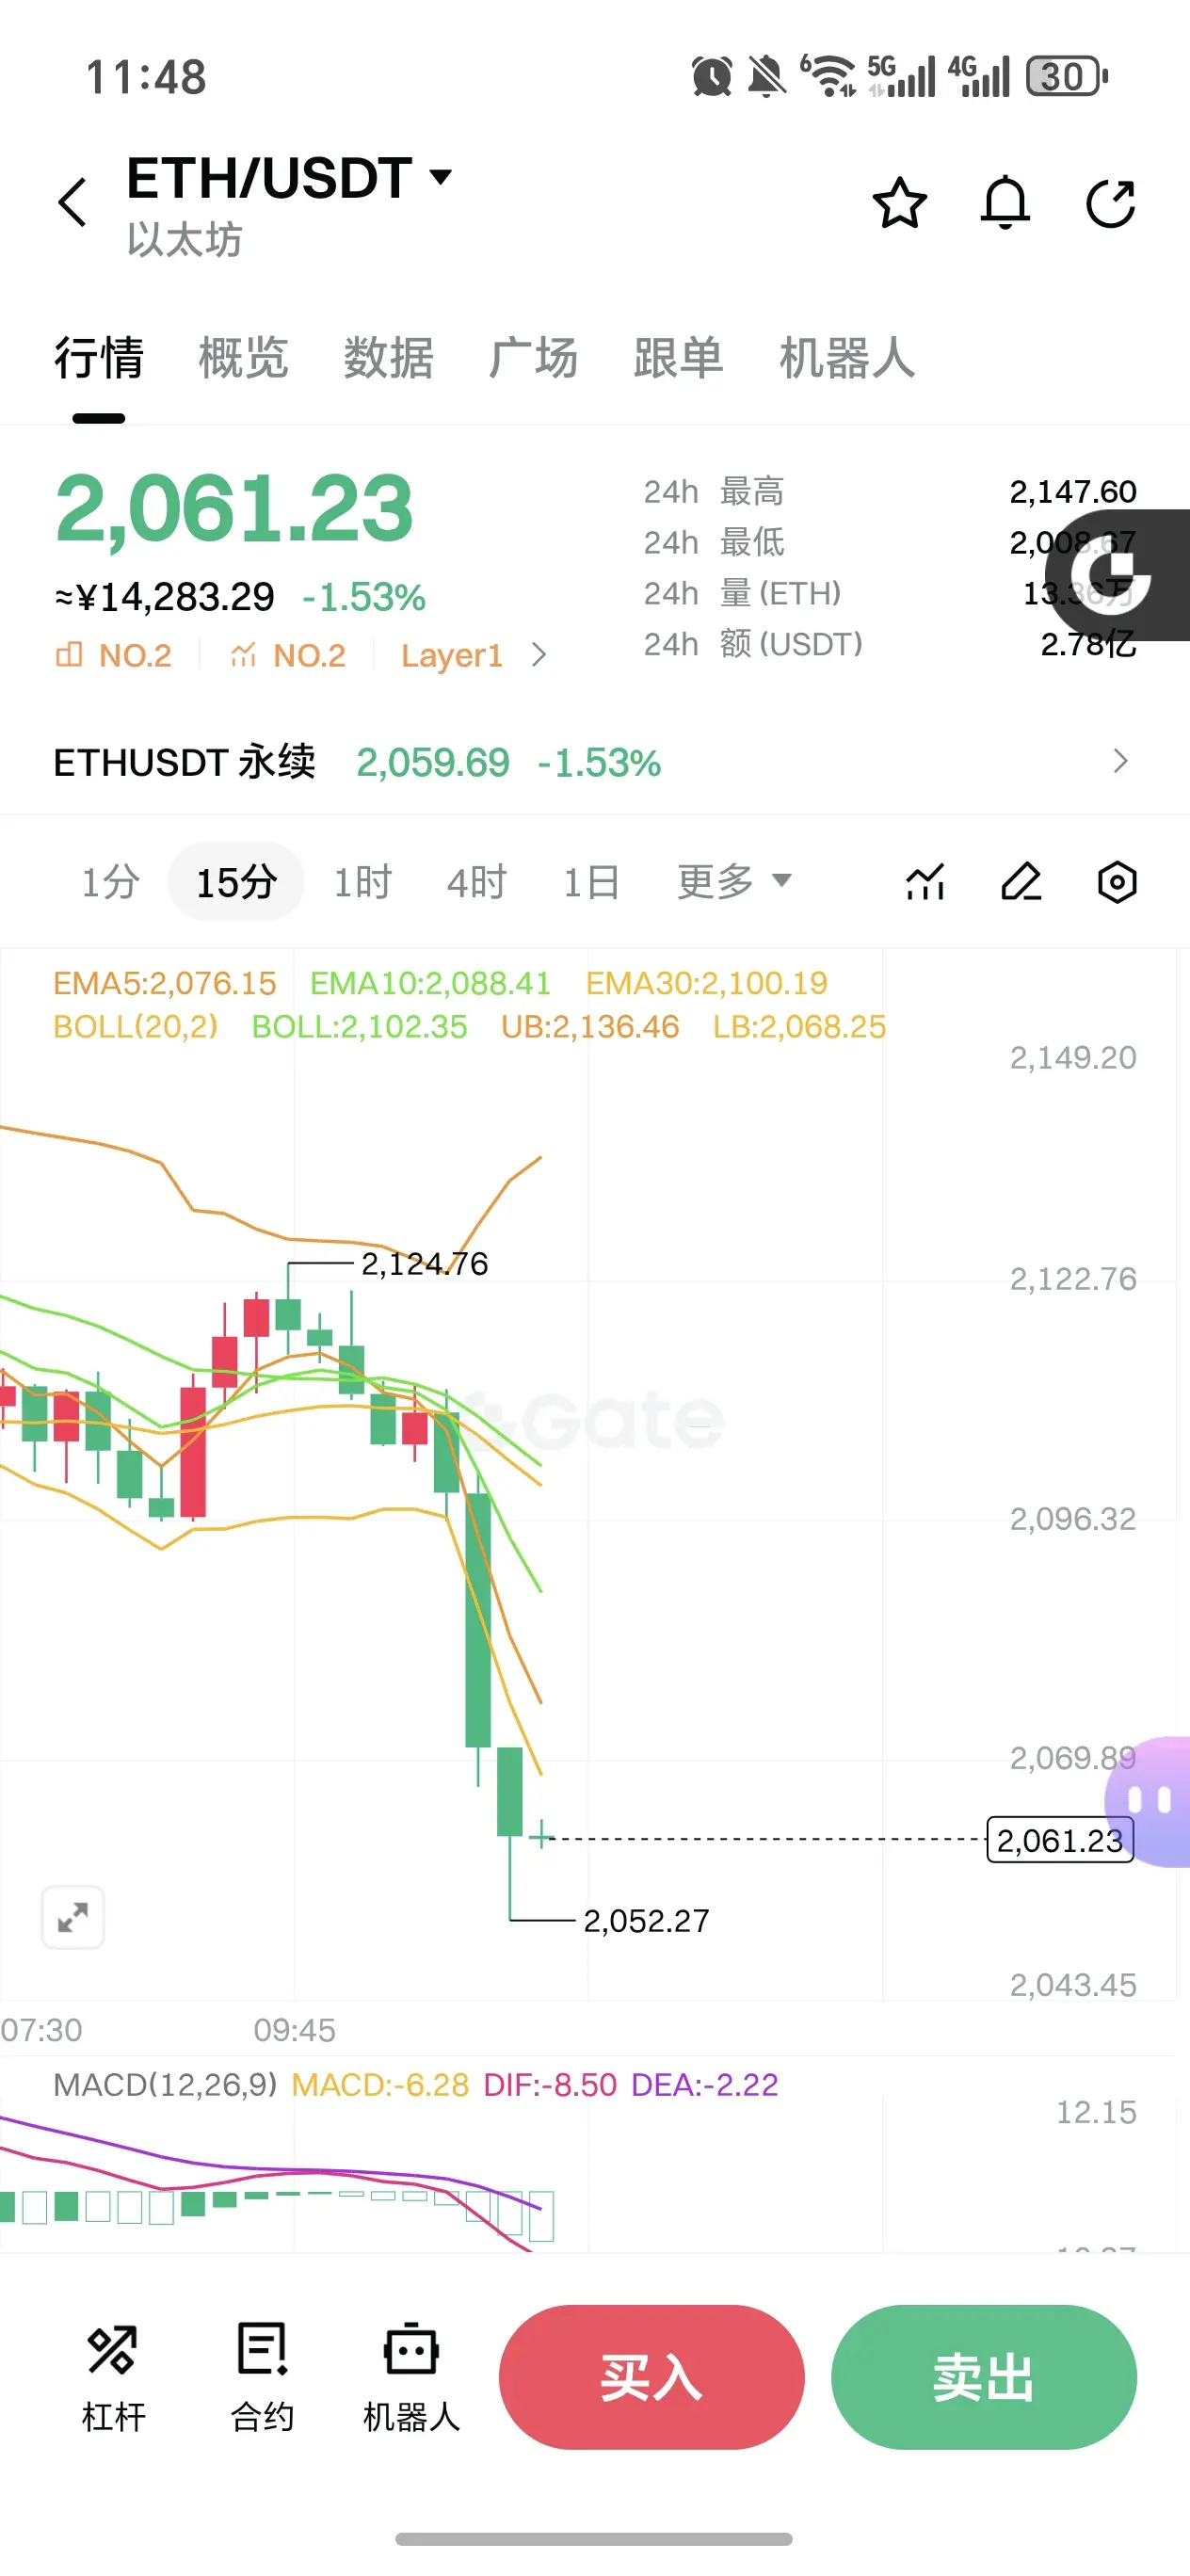
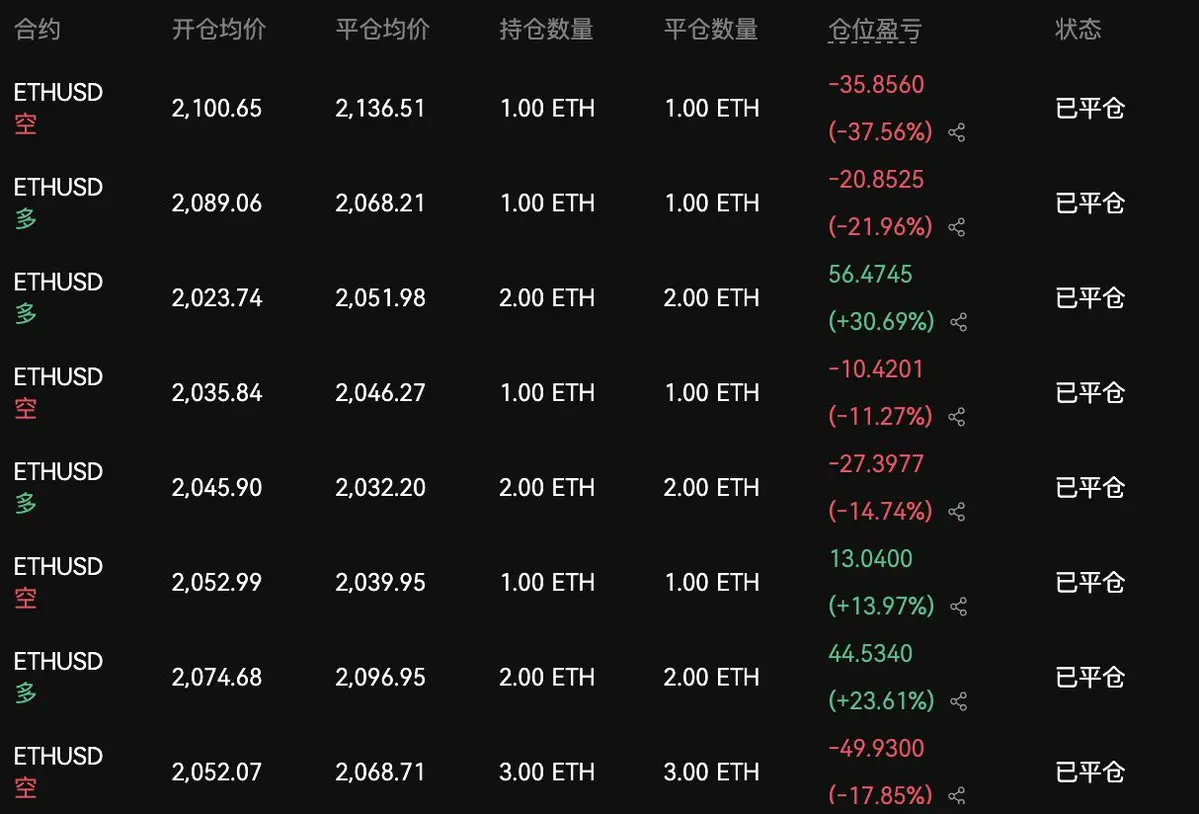
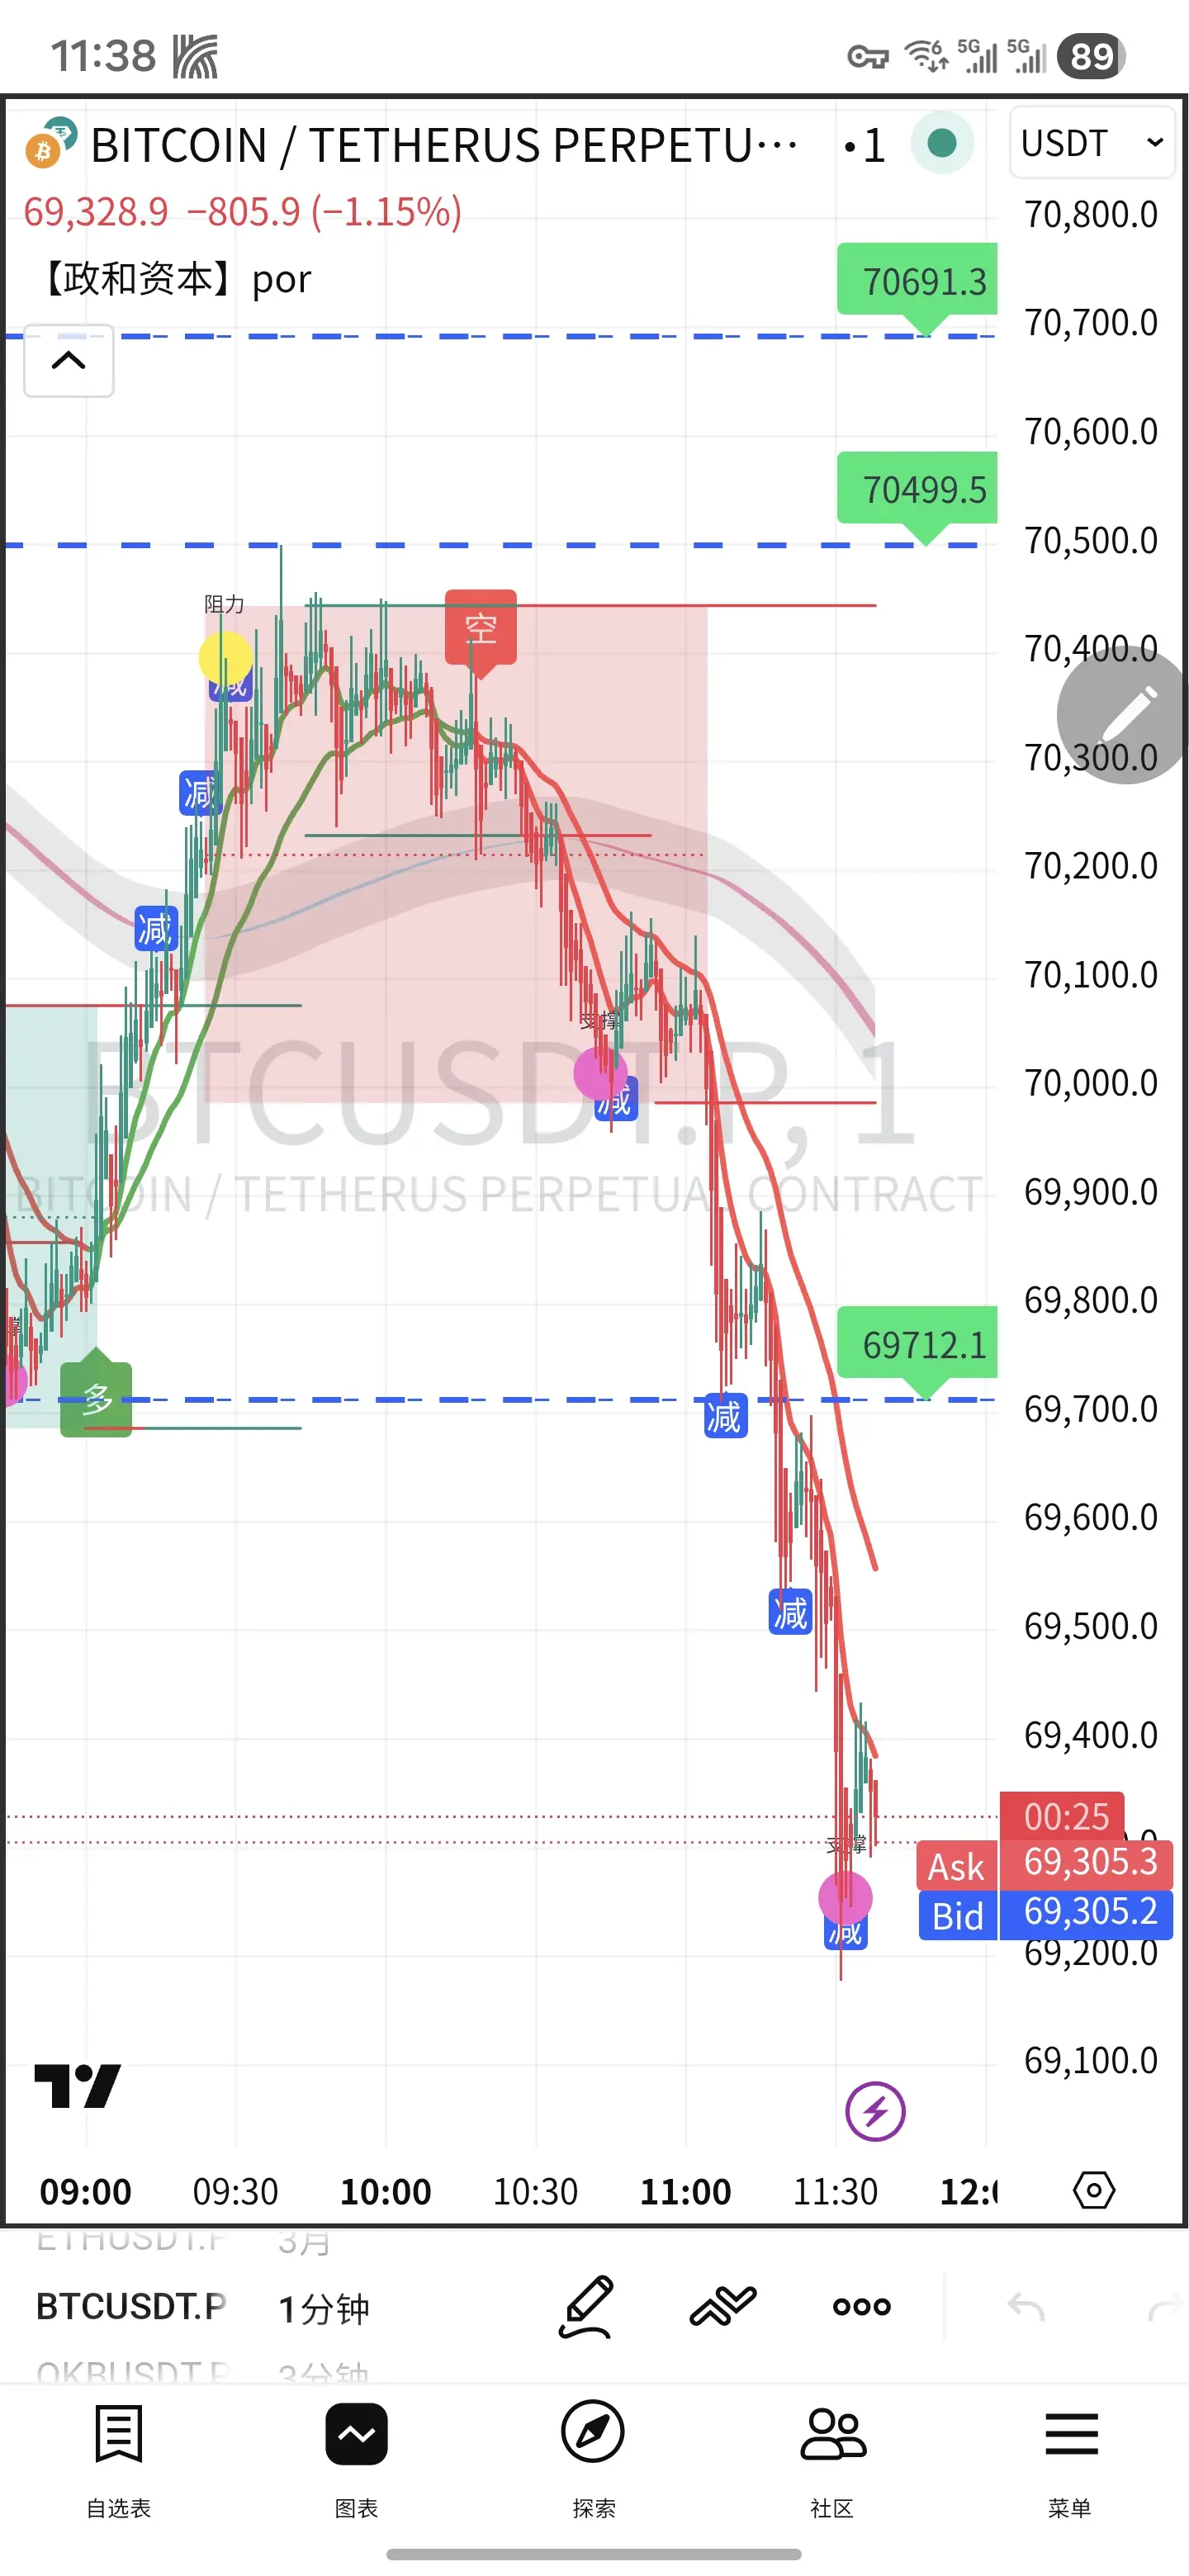
The live room caught a wave of short positions in a one-sided market, from 2110 to 2050, perfectly timed, perfectly taking profit. $ETH #当前行情抄底还是观望?
ETH-0,83%
- Reward
- 2
- 2
- Repost
- Share
DrAmaniSooJP:
amazing sharing, thx ya...View More
Participate in horse racing betting, complete tasks to earn horse racing tickets, and enjoy a million red envelope rain daily, sharing a prize pool of 100,000 USDT at the Gate 2026 Spring Festival Celebration. https://www.gate.com/competition/year-of-horse-2026?ref_type=165&utm_cmp=7EQB9Jba&ref=AVAQBF1F
View Original
- Reward
- like
- Comment
- Repost
- Share
Recently practicing short-term trades, all of them are f😭king losing money.
The biggest misconception is trading trend-following positions. Actually, in this market, there is no trend now; neither upward nor downward has strength. Trend-following positions are inherently difficult, with narrow fluctuations, making it easy to hit stop-loss.
Today, I switched to buying low and selling high. When the position is right, I buy and sell decisively, without waiting for clear signals. The win rate immediately improves.
View OriginalThe biggest misconception is trading trend-following positions. Actually, in this market, there is no trend now; neither upward nor downward has strength. Trend-following positions are inherently difficult, with narrow fluctuations, making it easy to hit stop-loss.
Today, I switched to buying low and selling high. When the position is right, I buy and sell decisively, without waiting for clear signals. The win rate immediately improves.
- Reward
- like
- Comment
- Repost
- Share
February 10, 2026 12:00 (Beijing Time), BTC approximately $67,100 USD, 24h +1.9%, weekly -8.1%, oscillating at low levels with insufficient volume, the bearish pattern remains unchanged. The strategy focuses on light positions + stop-loss + range trading.
1. Core Technical Analysis (Preliminary Conclusion)
- Pattern: Long upper shadow on daily chart, rebound then retreat; 1h/4h charts show narrow oscillation between 67,000-69,000, Bollinger middle band acting as resistance, rebound lacks strength.
- Indicators: RSI≈48 (neutral leaning weak); MACD shows a low-level golden cross but short red ba
BTC-1,61%
- Reward
- 1
- Comment
- Repost
- Share
Participate in horse racing betting, complete tasks to earn horse racing tickets, and enjoy a million red envelope rain daily, sharing a prize pool of 100,000 USDT at the Gate 2026 Spring Festival Celebration. https://www.gate.com/competition/year-of-horse-2026?ref_type=165&utm_cmp=7EQB9Jba&ref=VgIWAQpa
View Original
- Reward
- like
- Comment
- Repost
- Share
Participate in horse racing betting, complete tasks to earn horse racing tickets, and enjoy a million red envelope rain daily, sharing a prize pool of 100,000 USDT at the Gate 2026 Spring Festival Celebration. https://www.gate.com/competition/year-of-horse-2026?ref_type=165&utm_cmp=7EQB9Jba&ref=BFlAVVoN
View Original
- Reward
- like
- Comment
- Repost
- Share
Live Trading and Learning with Chillzzz
0
- Reward
- like
- Comment
- Repost
- Share
mibaise
米白色
Created By@ThreeMinutesAndSeven
Listing Progress
0.00%
MC:
$0.1
Create My Token
Participate in horse racing betting, complete tasks to earn horse racing tickets, and enjoy a million red envelope rain daily, sharing a prize pool of 100,000 USDT at the Gate 2026 Spring Festival Celebration. https://www.gate.com/competition/year-of-horse-2026?ref_type=165&utm_cmp=7EQB9Jba&ref=BFlMBwpZ
View Original
- Reward
- like
- Comment
- Repost
- Share
#CelebratingNewYearOnGateSquare
#CelebratingNewYearOnGateSquare
I celebrate the new year on Gate Square because this platform is not just a community space for me, it is an earnings point and a stage where real abilities matter. Gate Square gives everyone a fair chance to show skills knowledge and consistency. If you understand the market and can deliver value, Gate Square rewards you with visibility growth and income opportunities.
For me Gate Square is where analysis turns into earnings. It is a place where my market understanding price action skills and discipline come together. By sharing
- Reward
- 4
- 6
- Repost
- Share
repanzal:
Buy To Earn 💎View More
February 10, 2026 11:30 (Beijing Time), BTC price is approximately $67,200 USD, +1.8% in 24h, -8.2% weekly, at a low rebound after a sharp decline, with insufficient volume and still heavy selling pressure.
I. Core Technical Analysis
- Price and Pattern: Daily chart shows a sharp rise followed by a pullback, long upper shadow; 1h/4h charts are oscillating in the 67,000-69,000 range; Bollinger middle band is under pressure, rebound is blocked, bearish dominance.
- Indicators: RSI around 48, neutral leaning weak, no overbought or oversold signals; MACD shows a low-level golden cross but short re
BTC-1,61%
- Reward
- 3
- Comment
- Repost
- Share
Participate in horse racing betting, complete tasks to earn horse racing tickets, and enjoy a million red envelope rain daily, sharing a prize pool of 100,000 USDT at the Gate 2026 Spring Festival Celebration. https://www.gate.com/competition/year-of-horse-2026?ref_type=165&utm_cmp=7EQB9Jba&ref=VQRCXFOLVG
View Original
- Reward
- like
- Comment
- Repost
- Share
Gate Meteorological Emergency Notice!
🧧 Gate 2026 Spring Festival Red Envelope Rain First Day Officially Begins!
⏰ Today’s Red Envelope Rain Time Slots:
12:00–15:00 | 16:00–19:00 (UTC+8)
How to Claim:
🔑 Visit the event page before the Red Envelope Rain time slots to participate in the 2026 Spring Festival Celebration
🎁 Click the red envelope pop-up to jump to the red envelope page
💰 Claim GT Red Envelopes
Event link: https://www.gate.com/competition/year-of-horse-2026
Limited quantity, first come, first served. This Spring Festival, everyone shares good luck!
View Original🧧 Gate 2026 Spring Festival Red Envelope Rain First Day Officially Begins!
⏰ Today’s Red Envelope Rain Time Slots:
12:00–15:00 | 16:00–19:00 (UTC+8)
How to Claim:
🔑 Visit the event page before the Red Envelope Rain time slots to participate in the 2026 Spring Festival Celebration
🎁 Click the red envelope pop-up to jump to the red envelope page
💰 Claim GT Red Envelopes
Event link: https://www.gate.com/competition/year-of-horse-2026
Limited quantity, first come, first served. This Spring Festival, everyone shares good luck!

- Reward
- 4
- 7
- Repost
- Share
GateUser-7ff701d8:
Just go for it!View More
#USIranNuclearTalks has once again captured global attention, highlighting how fragile diplomacy remains in one of the world’s most sensitive geopolitical relationships.
While talks aimed at reviving or reshaping a nuclear agreement were expected to reduce tensions, recent developments have instead added uncertainty to international markets, regional stability, and global risk sentiment.
At the core of the issue is a deep lack of trust.
The United States continues to push for stricter oversight and verifiable limits on Iran’s nuclear program, citing concerns over enrichment levels and transp
- Reward
- like
- Comment
- Repost
- Share
Bitcoin rebound: technical repair or demand revival? The key lies in spot market capital flows.
160
- Reward
- like
- Comment
- Repost
- Share
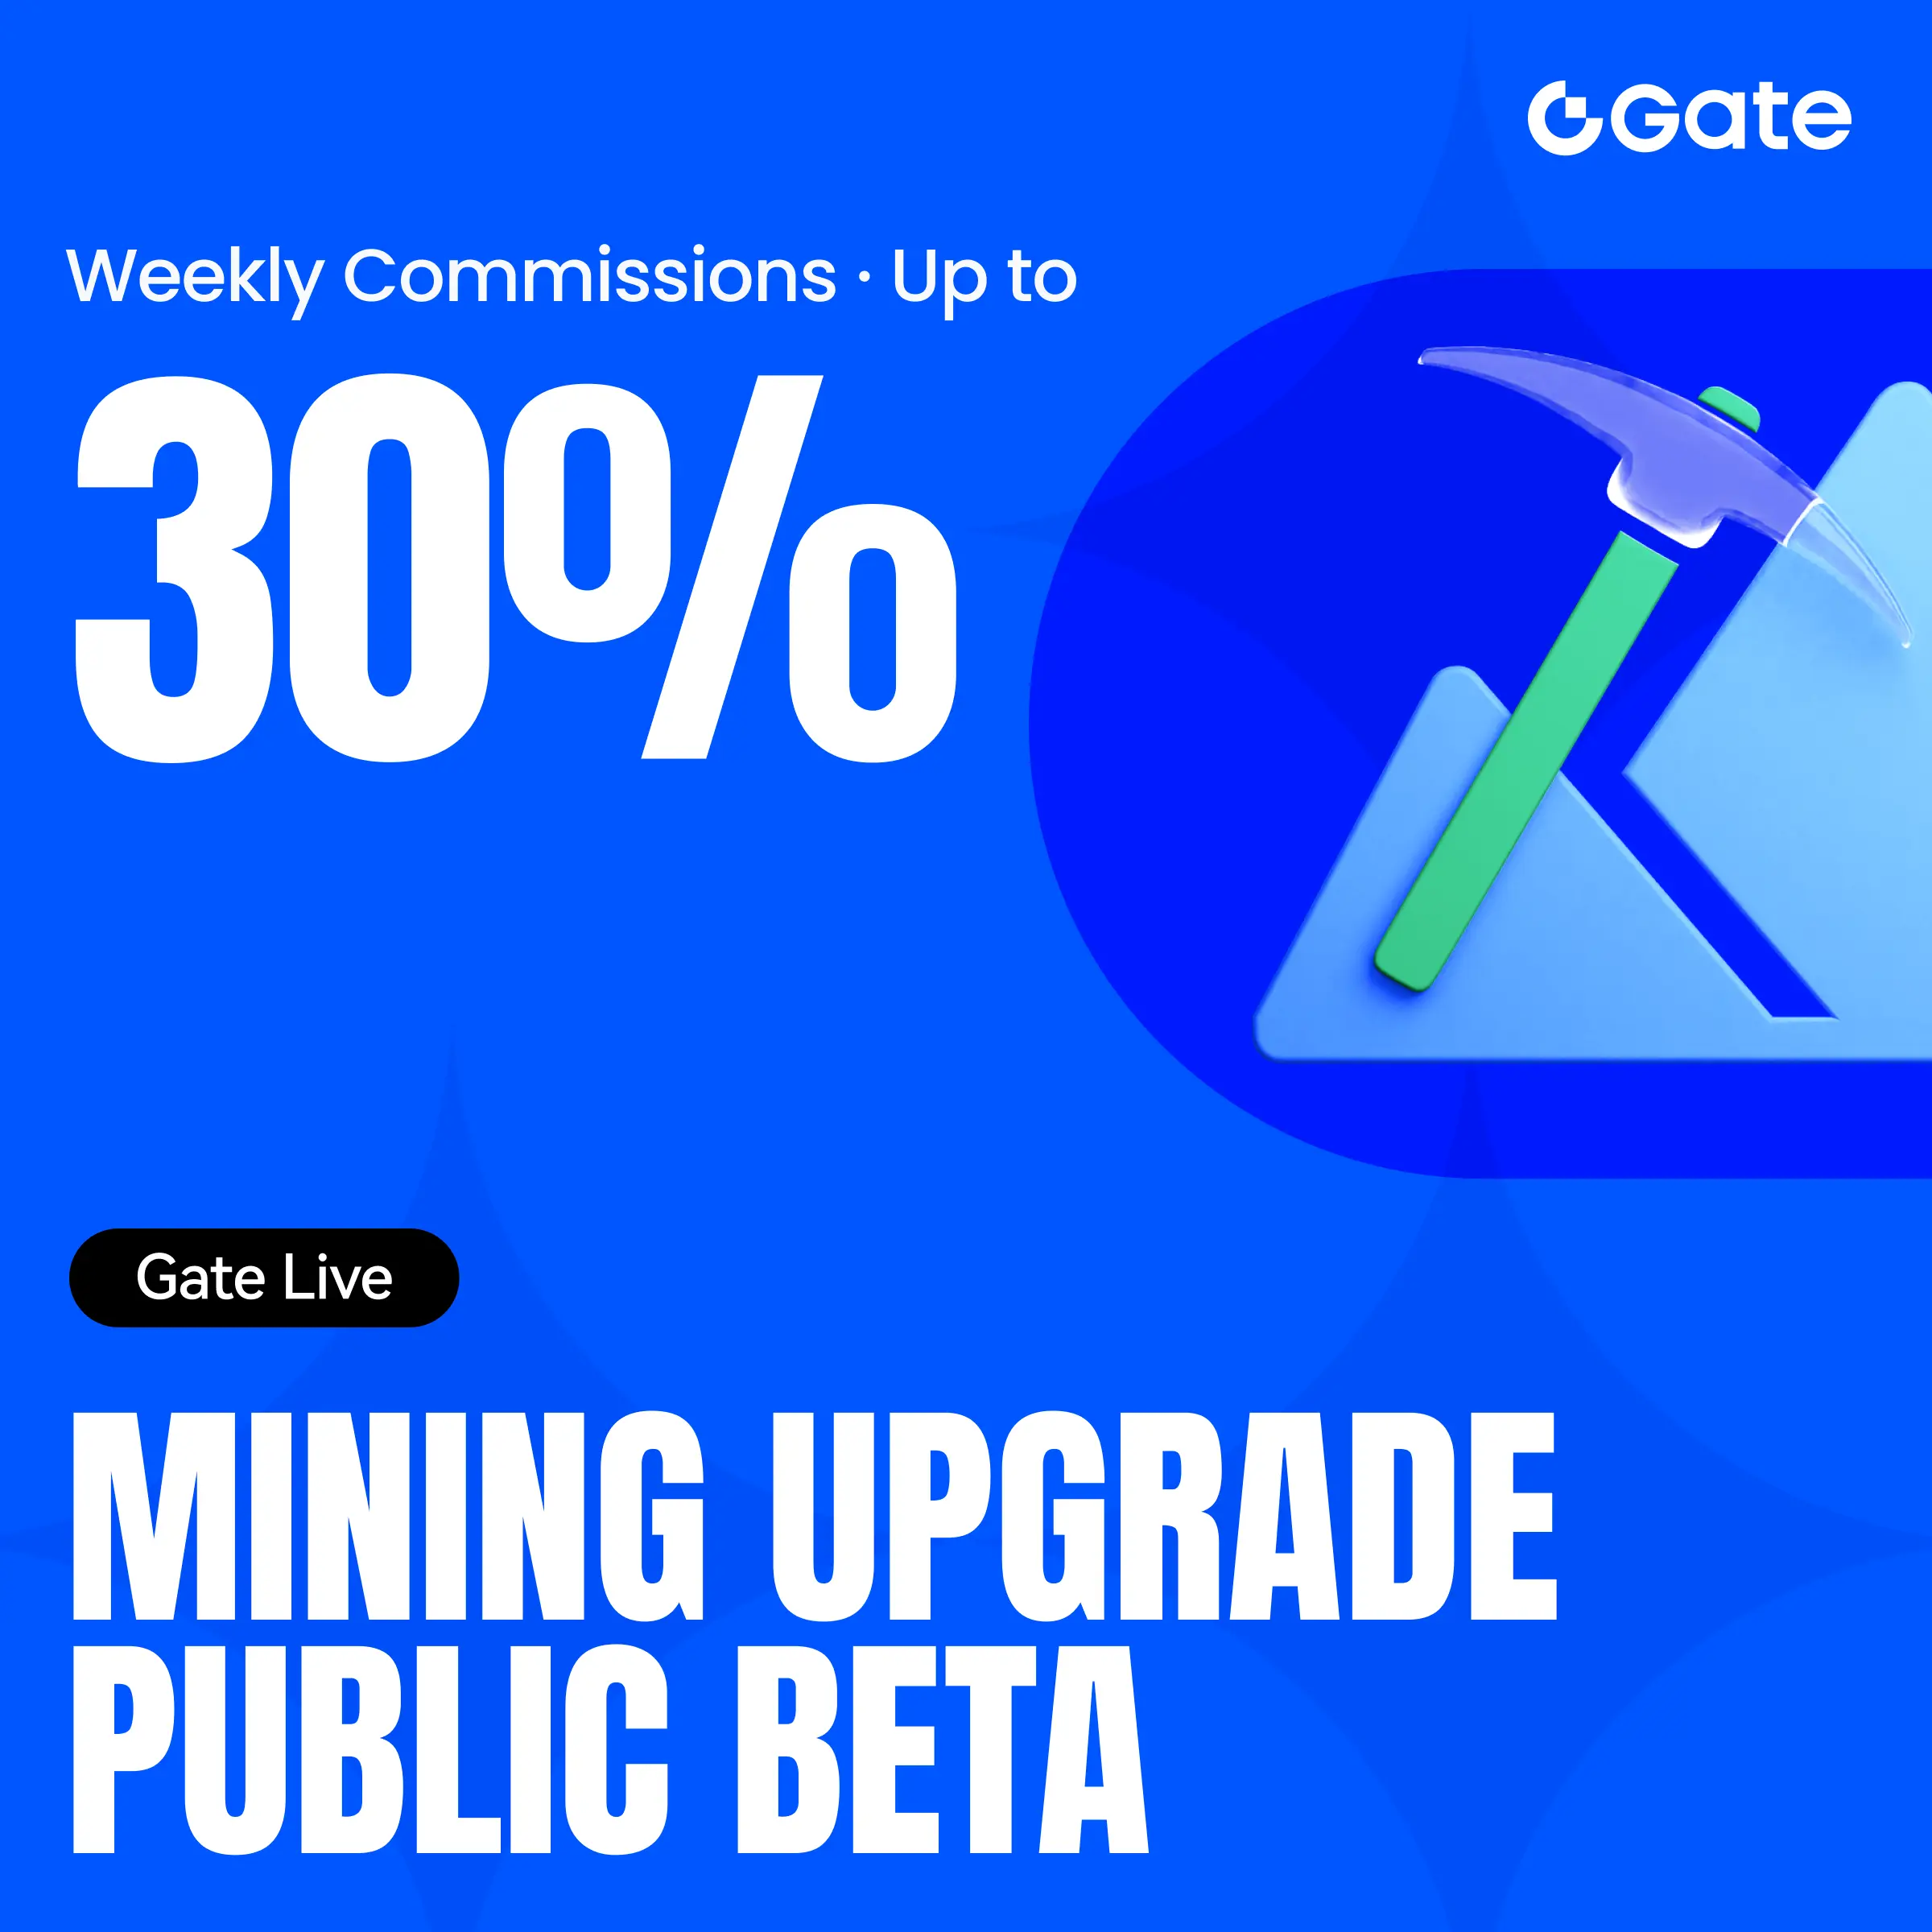
🔥 Gate Live Trading Mining Upgrade | Earn up to 30%
Live streaming isn’t just tips — trade-led streams earn commissions
✅ Up to 30% trading commission
✅ New streamers +10% bonus
✅ Up to 2,000 USDT / week
📈 Viewers trade via the token widget — you earn instantly
📲 Update to App V8.6.0
👉 Go Live / Apply: https://www.gate.com/live?type=apply
👉 Rules: https://www.gate.com/announcements/article/49565
- Reward
- 1
- 2
- Repost
- Share
CryptoEye:
Watching Closely 🔍️View More
Load More
Join 40M users in our growing community
⚡️ Join 40M users in the crypto craze discussion
💬 Engage with your favorite top creators
👍 See what interests you
Trending Topics
View More197.61K Popularity
254 Popularity
496 Popularity
5.29K Popularity
136 Popularity
Hot Gate Fun
View More- MC:$2.41KHolders:10.00%
- MC:$2.4KHolders:10.00%
- MC:$2.56KHolders:21.71%
- MC:$2.41KHolders:10.00%
- MC:$2.52KHolders:20.48%
News
View MoreAlpha Token New Listing: Molten is now live
1 m
Alpha Token New Listing: OPAL is now live
1 m
Alpha Token New Listing: Pigeon is now live
1 m
Intercontinental Exchange launches CoinDesk BNB futures contracts
4 m
"Wood Sister": Bitcoin is an important asset reflecting three major transformations, and its low correlation with gold will promote diversification of its attributes.
8 m
Pin