Trade
Trading Type
Spot
Trade crypto freely
Alpha
Points
Get promising tokens in streamlined on-chain trading
Pre-Market
Trade new tokens before they are officially listed
Margin
Magnify your profit with leverage
Convert & Block Trading
0 Fees
Trade any size with no fees and no slippage
Leveraged Tokens
Get exposure to leveraged positions simply
Futures
Futures
Hundreds of contracts settled in USDT or BTC
Options
HOT
Trade European-style vanilla options
Unified Account
Maximize your capital efficiency
Demo Trading
Futures Kickoff
Get prepared for your futures trading
Futures Events
Participate in events to win generous rewards
Demo Trading
Use virtual funds to experience risk-free trading
Earn
Launch
Investment
Simple Earn
VIP
Earn interests with idle tokens
Auto-Invest
Auto-invest on a regular basis
Dual Investment
Buy low and sell high to take profits from price fluctuations
Quant Fund
VIP
Top asset management team helps you profit without hassle
Crypto Loan
0 Fees
Pledge one crypto to borrow another
Lending Center
One-Stop Lending Hub
VIP Wealth Hub
New
Customized wealth management empowers your assets growth
Private Wealth Management
Customized asset management to grow your digital assets
Staking
Stake cryptos to earn in PoS products
BTC Staking
HOT
Stake BTC and earn 10% APR
GUSD Minting
New
Use USDT/USDC to mint GUSD for treasury-level yields
Soft Staking
Earn rewards with flexible staking
More


BrotherJing.btc
Push
Pin
BrotherJing.btc
Explanation of Trading System Strategies 2025-07-08
The video explanation has been updated, and a second section has been added afterwards.
- Reward
- 19
- 22
- Repost
- Share
Happy888 :
:
Hurry up and enter a position!🚗View More
Rare Trigger - Bottom Divergence
View Original
- Reward
- like
- 1
- Repost
- Share
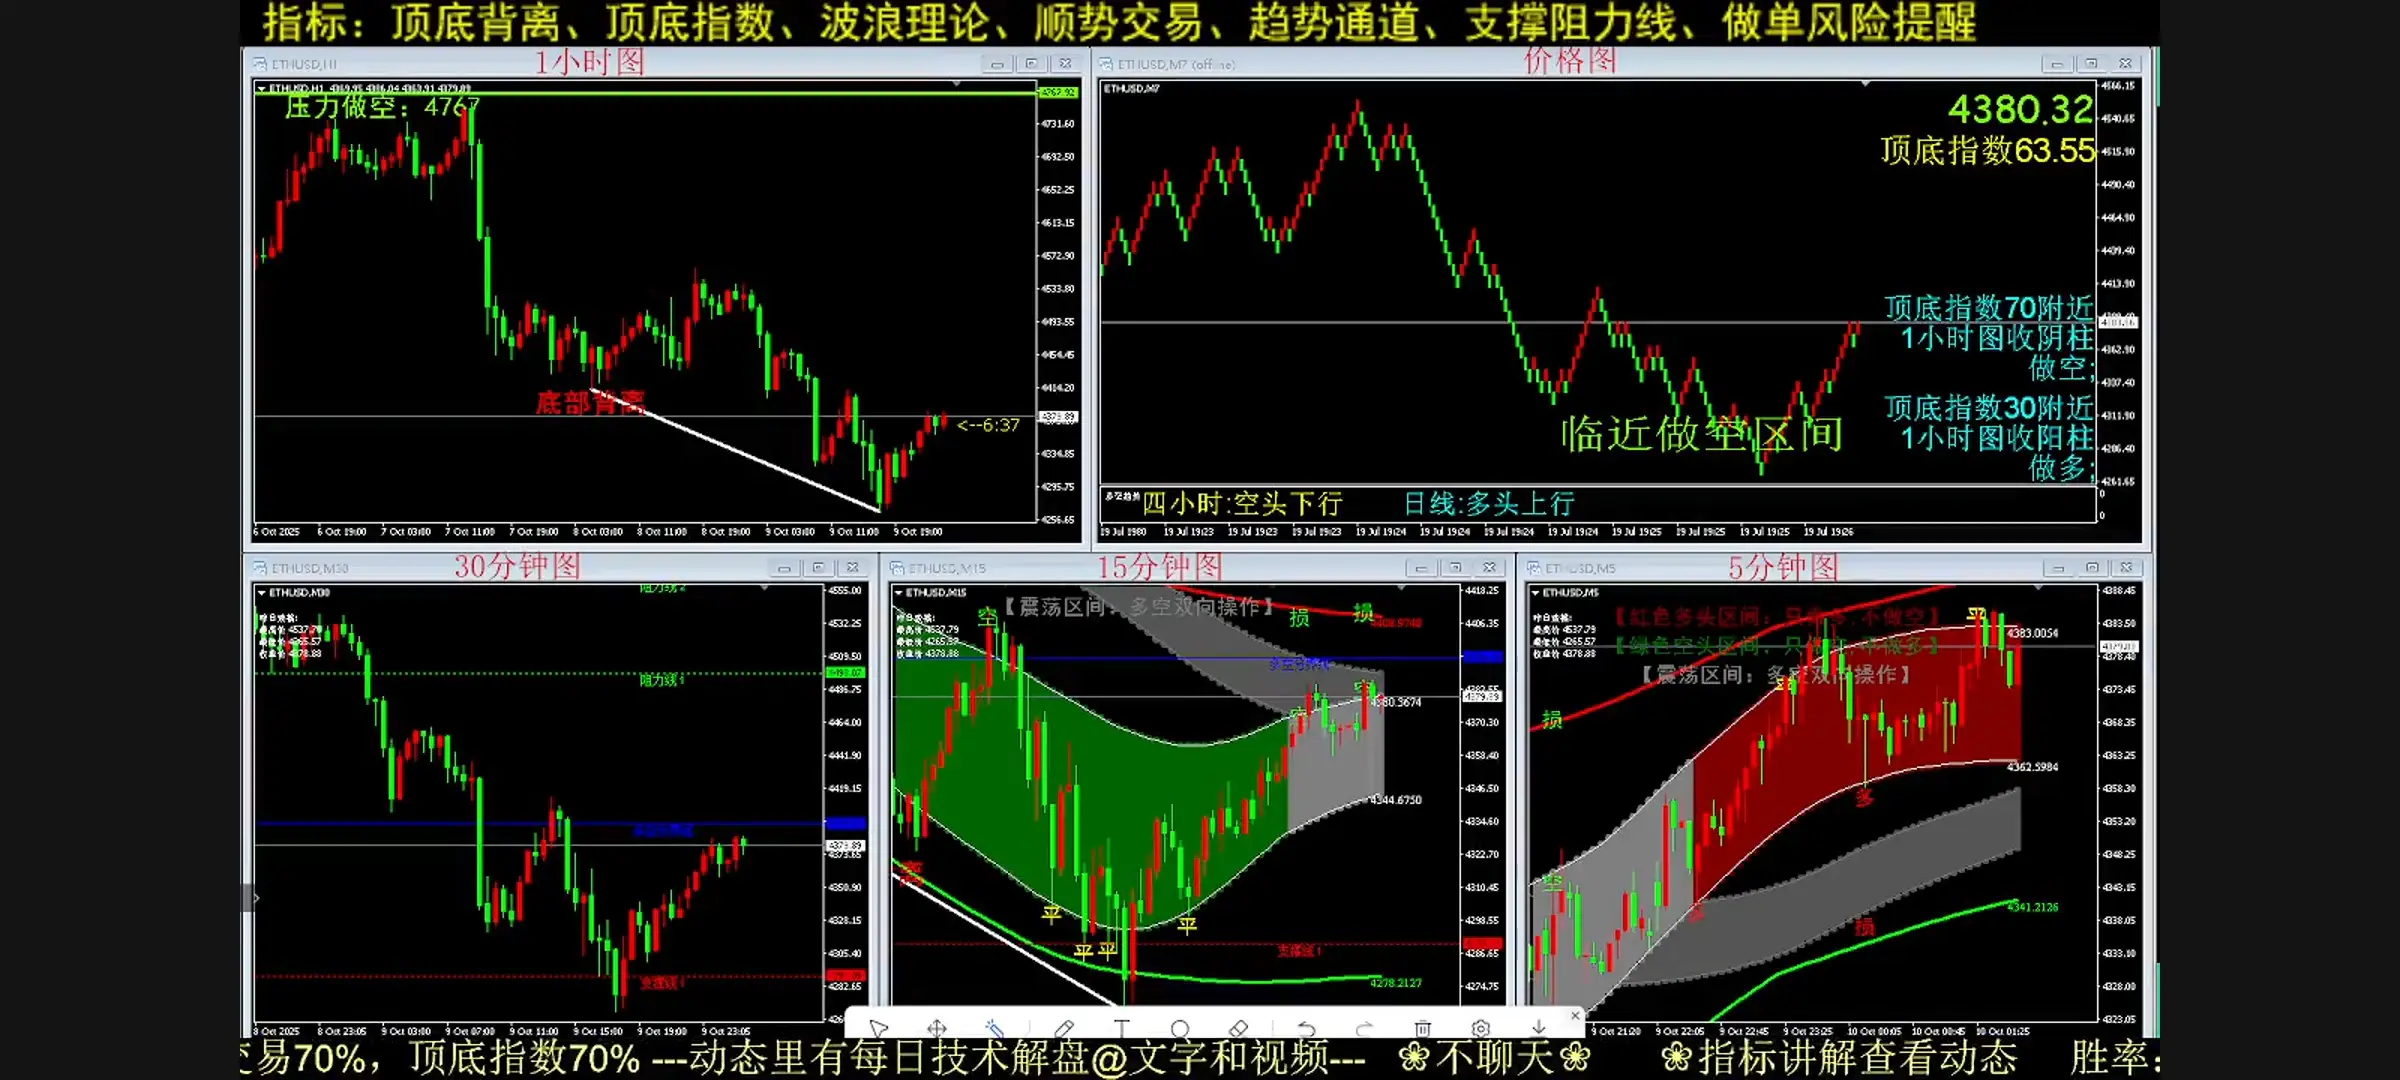
Technical Analysis 2025-10-03
**Daily chart level: [Mainly short positions]**
No obvious trend, still in the bearish volume range. Aggressive traders can gradually build short positions, while conservative traders should wait for the daily chart to close with a bearish candle.
//Resistance at 4830, support at 4280
**Intraday Level: [Bullish on the Dips]**
Upward trend, overbought range, mainly low long positions, divergence in the small cycle, with a need for a pullback;
//Resistance at 4568, 4620 above; support at 4430, 4280 below.
- Reward
- 1
- Comment
- Repost
- Share
Technical Analysis 2025-10-01
Daily chart level: [Mainly Short]
Near the rebound resistance level, you can build short positions in batches.
//Resistance near 4280
Intraday level: [Low Long High Short]
The upward trend has turned into a consolidation, facing resistance at the pressure level, and has pulled back;
//Resistance above at 4280, 4430, support below at 4100, 3900
- Reward
- 1
- Comment
- Repost
- Share
Technical Analysis 2025-09-30
**Daily chart level: [Mainly short positions]**
Near the rebound pressure level, you can gradually build short positions.
//Resistance near 4280
**Intraday Level: [Low Long High Short]**
Upward trend, resistance level blocked, pullback, low long high short, secondary upward surge for short selling;
//Resistance above at 4280, 4430, support below at 4100;
- Reward
- like
- Comment
- Repost
- Share
Technical Analysis 2025-09-29
Intraday level: 【Long at low, short at high】 ** Downward trend shifts to oscillation or oscillation upward, long at low, short at high; // Upper resistance 4160, 4280, lower support 3880, 3590;
- Reward
- like
- Comment
- Repost
- Share
Technical Analysis 2025-09-26
Daily chart level: 【Wait and see】 **Current position is to wait and see, waiting for a Rebound to short;** Intraday level: 【Mainly short】 **Downward trend, mainly short; // Upper resistance 4160, 4280, lower support 3880, 3590;
- Reward
- 3
- Comment
- Repost
- Share
Technical Analysis 2025-09-25
**Intraday Level: 【Shorting is the Main Focus】** Break below support level, waiting for a Rebound to test if the resistance level is valid; if valid, proceed with shorting; // Upper resistance levels 4160, 4280, lower support levels 3880, 3590;
Last edited on 2025-09-25 05:34:06
- Reward
- 1
- Comment
- Repost
- Share
Technical Analysis 2025-09-23
**Daily chart level: 【Wait and see】** Reached minor support, waiting to see if the support is effective, wait for a rebound before going short; // Upper pressure 117000, 120000, lower support 113000, 106000 **Intraday level: 【Mainly short positions】** Downward trend, maintain short positions; // Upper pressure 114700, lower support 113000, 110000;
- Reward
- like
- Comment
- Repost
- Share
Technical Analysis 2025-09-21
Intraday level: 【low long high short】 ** range oscillation, low long high short; // upper resistance 4675, 4824, lower support 4430, 4280;
- Reward
- like
- Comment
- Repost
- Share
Technical Analysis 2025-09-20
**Intraday Level: [Mainly Short Positions]** Range oscillation, higher trade volumes for long positions end, mainly short positions; // Upper pressure at 117000, lower support at 114700, 113000.
- Reward
- like
- Comment
- Repost
- Share
Technical Analysis 2025-09-19
Intraday level: 【Mainly shorting】 **4-hour cycle divergence state, can short near the resistance level; // Upper resistance 118500, lower support 114700, 113000;
- Reward
- like
- 1
- Repost
- Share
Earn200uDaily:
Just go for it💪Technical Analysis 2025-09-18
**Daily chart level: [Mainly Shorting]** Continuous testing of the upper resistance level for a week, aggressive traders can build a Light Position for shorting, while conservative traders reference the intraday position; // Upper resistance at 117000, 120000, lower support at 113000, 106000. **Intraday level: [Mainly Shorting]** 4-hour divergence state, high pressure at the top, shorting can be done near the resistance level; // Upper resistance at 118500, lower support at 114700, 113000;
- Reward
- like
- Comment
- Repost
- Share
Technical Analysis 2-25-09-17
Daily chart level: 【Wait and See】**Resistance level around 117000, long positions slightly strong, hovering for several days without breaking through, aggressive can light position Build a Position short order; //Upper resistance 117000, 120000, lower support 113000, 106000**Intraday level: 【Low Long High Short】**Range oscillation, long positions slightly strong, divergence status; //Upper resistance 11700, lower support 114700, 113000
- Reward
- 1
- Comment
- Repost
- Share
Technical Analysis 2025-09-16
**Daily chart level: [Mainly short]** Resistance level is blocked, can build a position for short order in batches before breaking the previous high; // Upper resistance level 4830 **Intraday level: [Low long high short]** Range fluctuation, low long high short; // Upper pressure 4675, 4824, lower support 4500;
- Reward
- like
- Comment
- Repost
- Share
Technical Analysis 2025-09-15
**Daily chart level: [Mainly short orders]** The resistance level is blocked, the decline yesterday was too weak, and there may still be high-level consolidation, you can build a position for short orders in batches; // Upper resistance level 4830 **Intraday level: [Low long and high short]** The upward trend has ended, and it has encountered resistance and pulled back, you can go long at low levels and short at high levels; // Upper resistance 4824, lower support 4500;
- Reward
- like
- Comment
- Repost
- Share
Technical Analysis 2025-09-14
**Daily chart level: [Mainly short]** Resistance level is blocked, can build a position for short order in batches; // Upper resistance level 4830 **Intra-day level: [Low long high short]** Pump trend ends, meets resistance and falls back, can low long high short; // Upper resistance 4824, lower support 4500;
- Reward
- like
- Comment
- Repost
- Share
Technical Analysis 2025-09-13
**Daily Chart Level: [Mainly Short]** Approaching the resistance level near 117000. If a bearish candle forms, build a position for short; // Upper resistance 117000, lower support 113000, 106000 **Intraday Level: [Long and Short]** Upward trend, encountering resistance level, or turning into consolidation; // Upper resistance 11700, lower support 114700, 113000
- Reward
- like
- Comment
- Repost
- Share
Technical Analysis 2025-09-11
**Daily chart level: 【Wait and see】** Several days of small range sideways movement, no trend, no direction, waiting for direction choice, watch and wait; **Intraday level: 【Low long, high short】** Range fluctuation, low long, high short; // Upper pressure 4498, 4670, lower support 4280, 4160;
- Reward
- like
- Comment
- Repost
- Share
Technical Analysis 2025-09-10
**Daily chart level: 【Wait and See】** Multiple days of small range Sideways, no trend and no direction, waiting for direction choice, wait and see; **Intraday level: 【Long on dips and short on rallies】** Range oscillation, Long on dips and short on rallies; // Upper pressure 4498, 4670, lower support 4280, 4160;
- Reward
- 3
- Comment
- Repost
- Share