

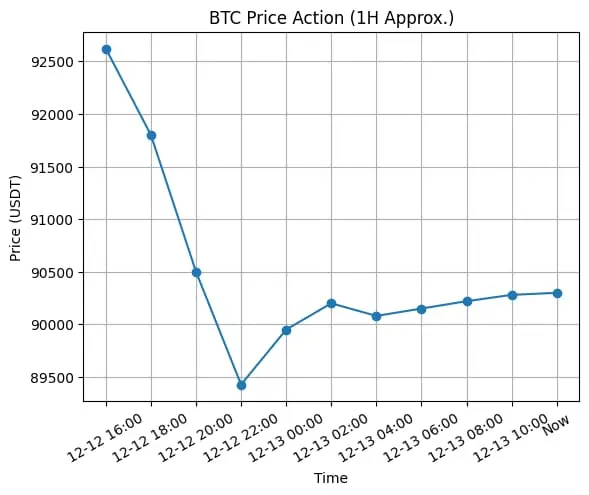
$BTC BTC Market Update (1H View)
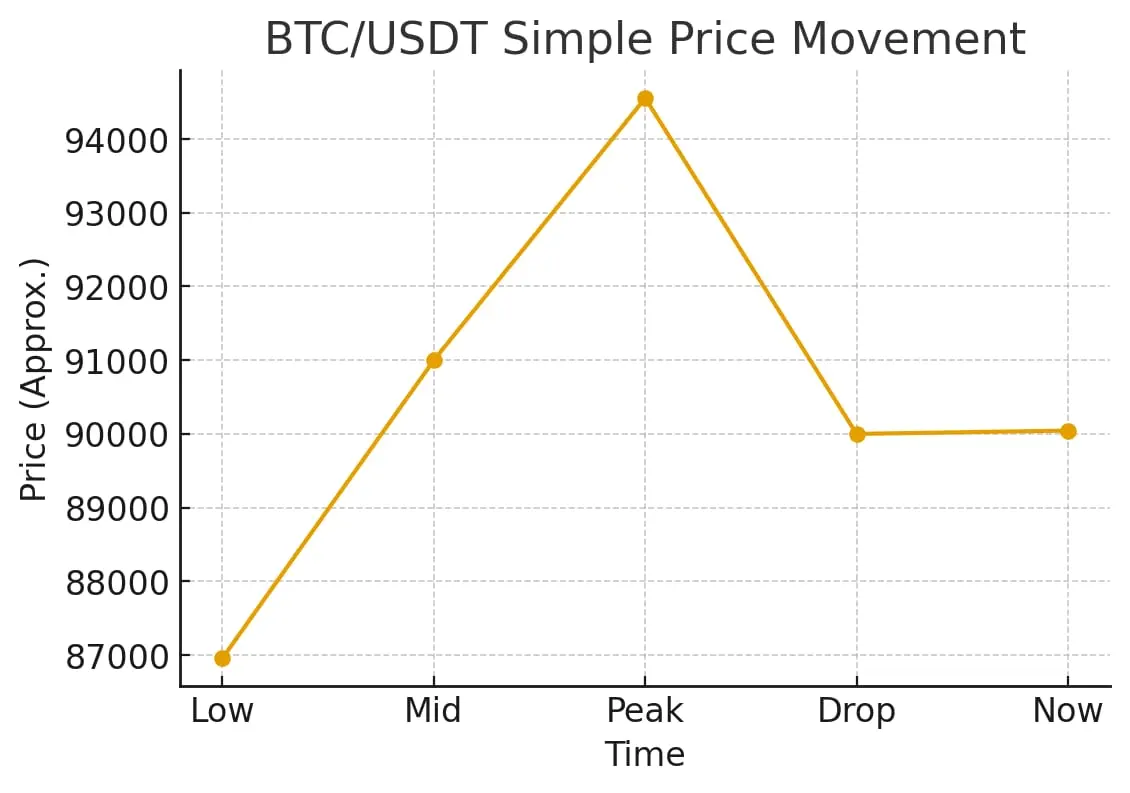
Today the chart is showing a mixed but active structure. Price has been bouncing between quick spikes and fast pullbacks, and the indicators are hinting at a market that’s still trying to find its direction.
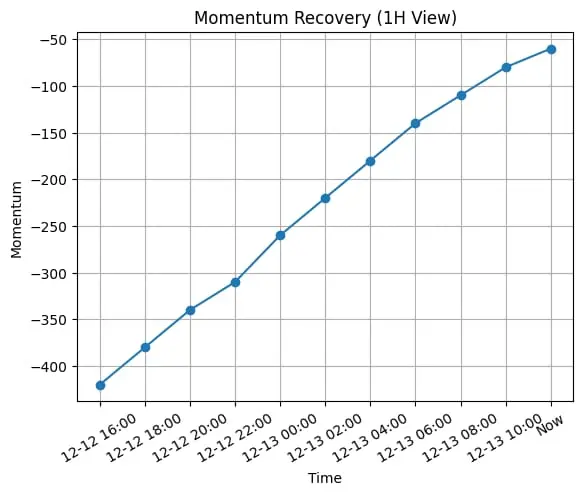
On the short timeframe, momentum feels slightly bullish after that sharp dip recovery. The moving averages are still tight, which usually means the market is preparing for another solid move. If volume picks up, BTC could try to retest the higher zone again.
For the near future, I’m watching two things:
1. Break above recent intraday resistance — this wou
Today the chart is showing a mixed but active structure. Price has been bouncing between quick spikes and fast pullbacks, and the indicators are hinting at a market that’s still trying to find its direction.
On the short timeframe, momentum feels slightly bullish after that sharp dip recovery. The moving averages are still tight, which usually means the market is preparing for another solid move. If volume picks up, BTC could try to retest the higher zone again.
For the near future, I’m watching two things:
1. Break above recent intraday resistance — this wou
BTC-2.25%