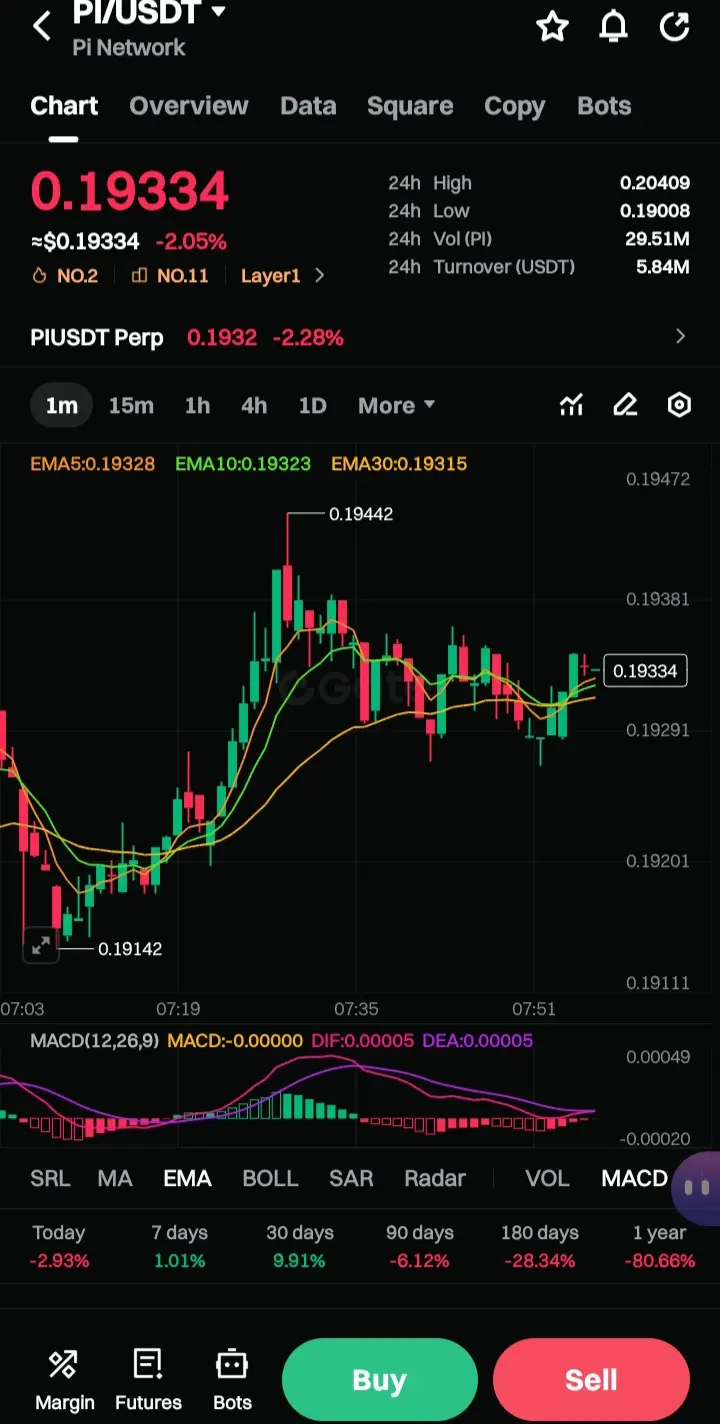

$TAO (长期/日线背景)
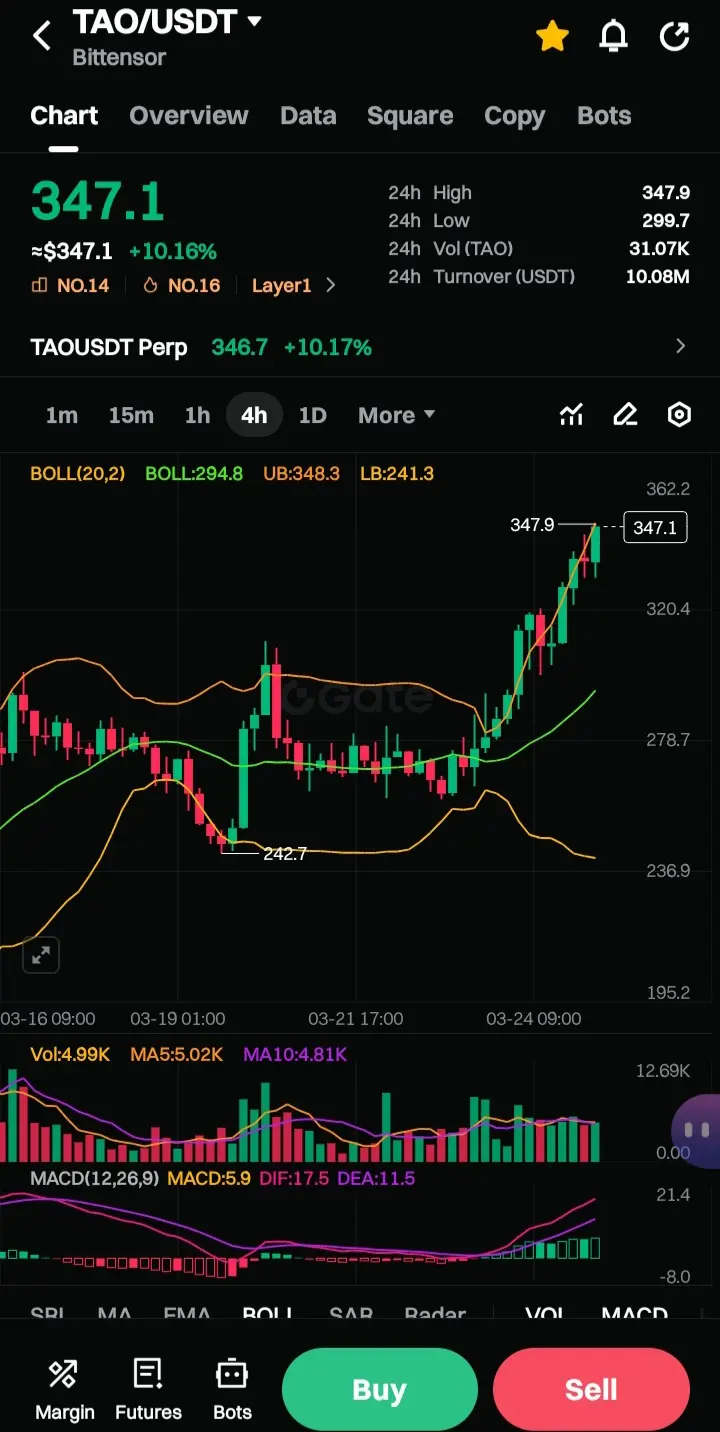
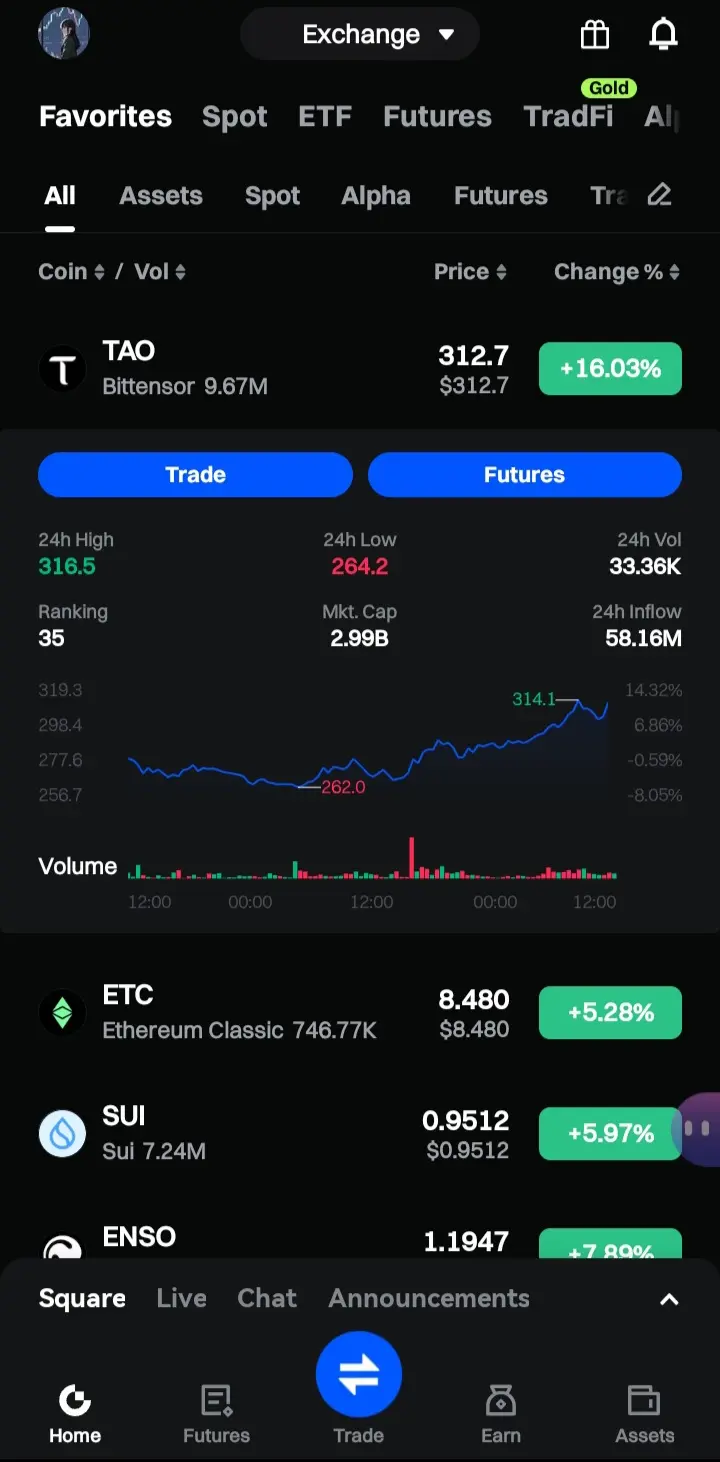
价格: $347.1 | 涨幅: +10.16%
指标: BOLL(20,2) – 中轨: 294.8 | 上轨: 348.3 | 下轨: 241.3
分析:
此图表显示三个图表中最激进的扩张。布林带显示上轨348.3和下轨241.3之间存在巨大偏离,表明波动率极高且呈强劲上升趋势。价格目前正在测试上轨。
· 趋势: 强劲看涨突破。价格已明显升至中轨(294.8)上方,该中轨充当均值回归水平。
· 阻力: 当前价格位于上轨(348.3)。持续突破这一水平可能导致抛物线式走势,但历史上,触及上轨通常先于冷却或盘整。
· 支撑: 294.8的中轨是主要动态支撑。241.3的下轨代表趋势反转时的极端看跌情景。
· 成交量: 成交量柱(4.99K)大致与移动平均线(MA5: 5.02K)一致,表明涨势得到一致(尽管不是爆炸性)成交量的支撑。
· MACD: MACD直方图为正(5.9),DIF(17.5)远高于DEA(11.5)。缺口较大,确认了强劲的看涨动能。但是,如此大的缺口通常表明该走势已成熟,短期内过度延伸。
结论: 这是一个高波动率、看涨延续的设置。价格处于上轨的关键拐点。交易员通常寻求突破$348.3以实现延续,或寻求拒绝/回撤至$320 (列出的最接近价格水平)进行重新测试。
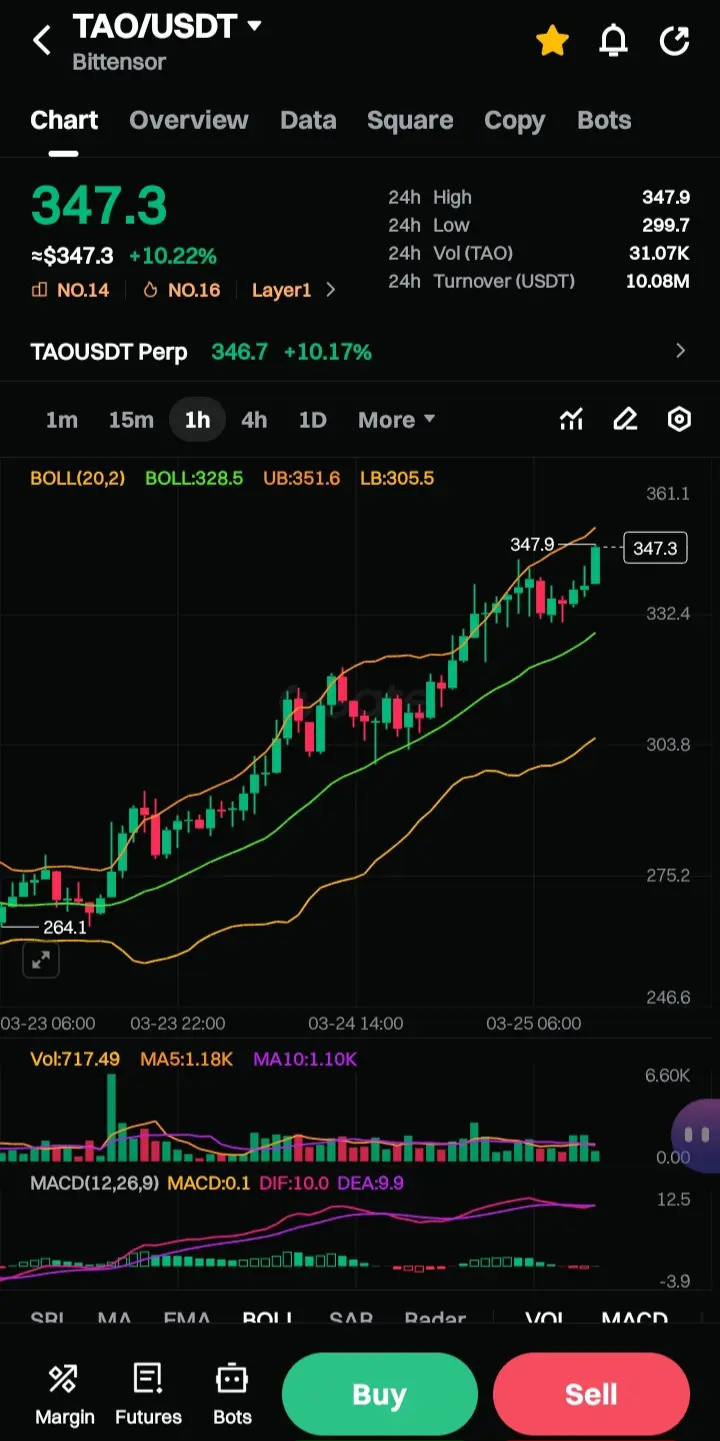
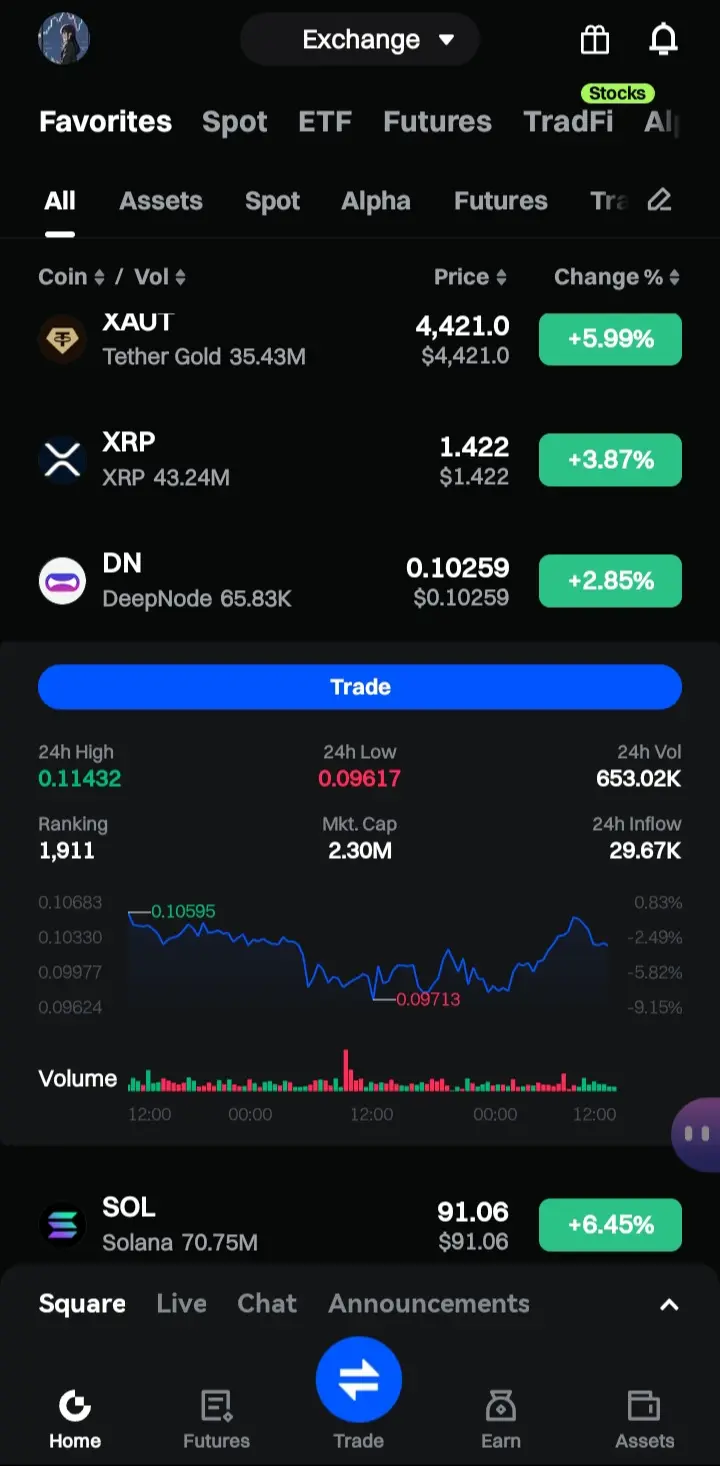
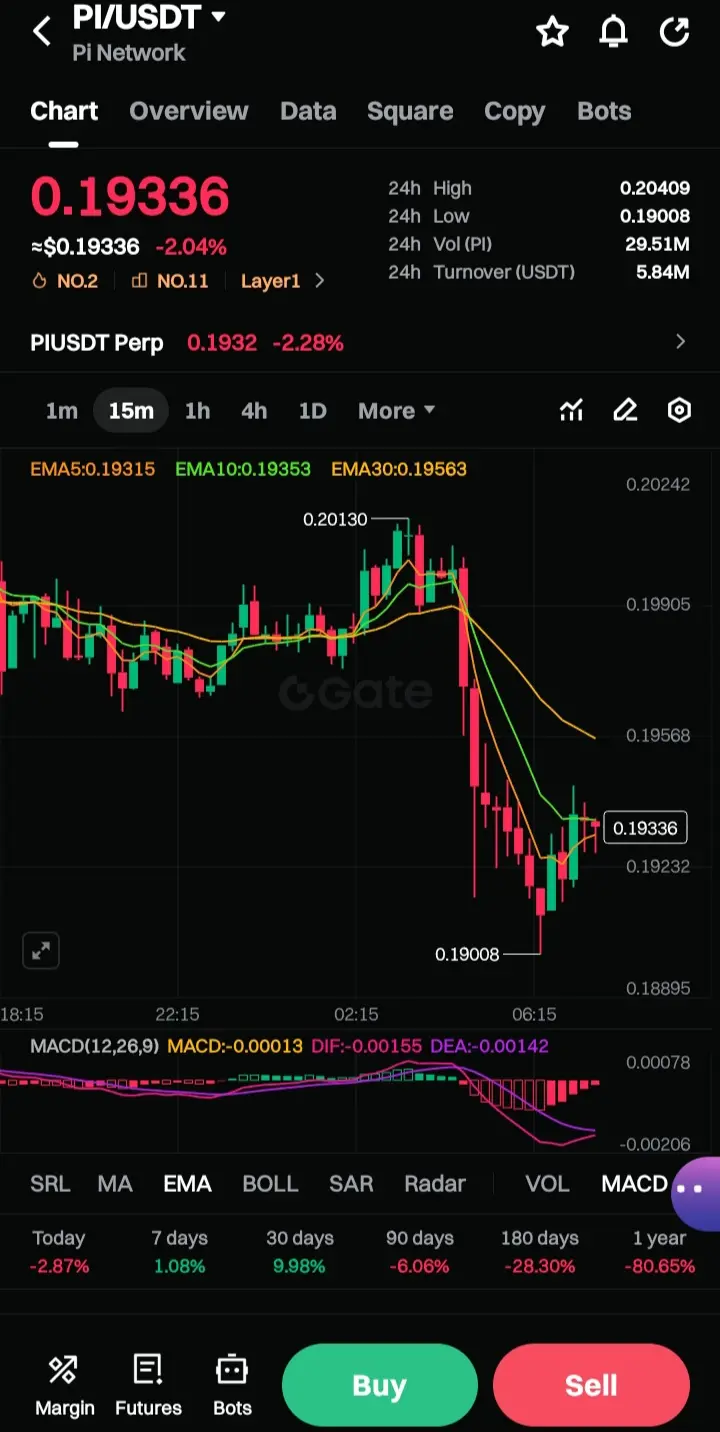
(1小时区间)
价格: $347.3 | 涨幅: +10.22%
指标: BOLL(20,2) – 中轨: 328.5 | 上轨: 351.6 | 下轨: 305.5
分析:
此图表聚焦于1小时时间框架,显示与第一个图表类似的看涨结构,但对即时阻力的视图更加紧凑。
· 趋势: 价格紧贴上布林带(351.6)。在328.5处的中轨呈激进向上倾斜,表明陡峭上升。
· 阻力: 立即阻力为上轨351.6。值得注意的是,列出的价格水平显示347.3和347.9聚集在一起,构成价格目前正在争取的次要日内阻力区。
· 支撑: 关键支撑位于332.4和中轨328.5处。在1小时图上突破中轨下方将是短期趋势反转或获利了结事件的信号。
· 成交量: 成交量(717.49)低于MA5(1.18K)。这是一个微妙的预警信号。对于强劲的突破,我们预期成交量高于移动平均线。价格峰值期间成交量下降表明买盘压力减弱。
· MACD: MACD近乎平坦(0.1),DIF(10.0)仅略高于DEA(9.9)。在1小时图上,这种收敛表明动能减弱。DIF在此处破位下穿DEA的看跌交叉(将是短期交易员的强劲卖出信号。
结论: 此图表显示动能停滞。尽管价格高企,但成交量下降和MACD平坦表明即时向上的推力正在失去动能。在下一次主要走势前,很可能出现盘整或小幅回撤至$332–)范围。
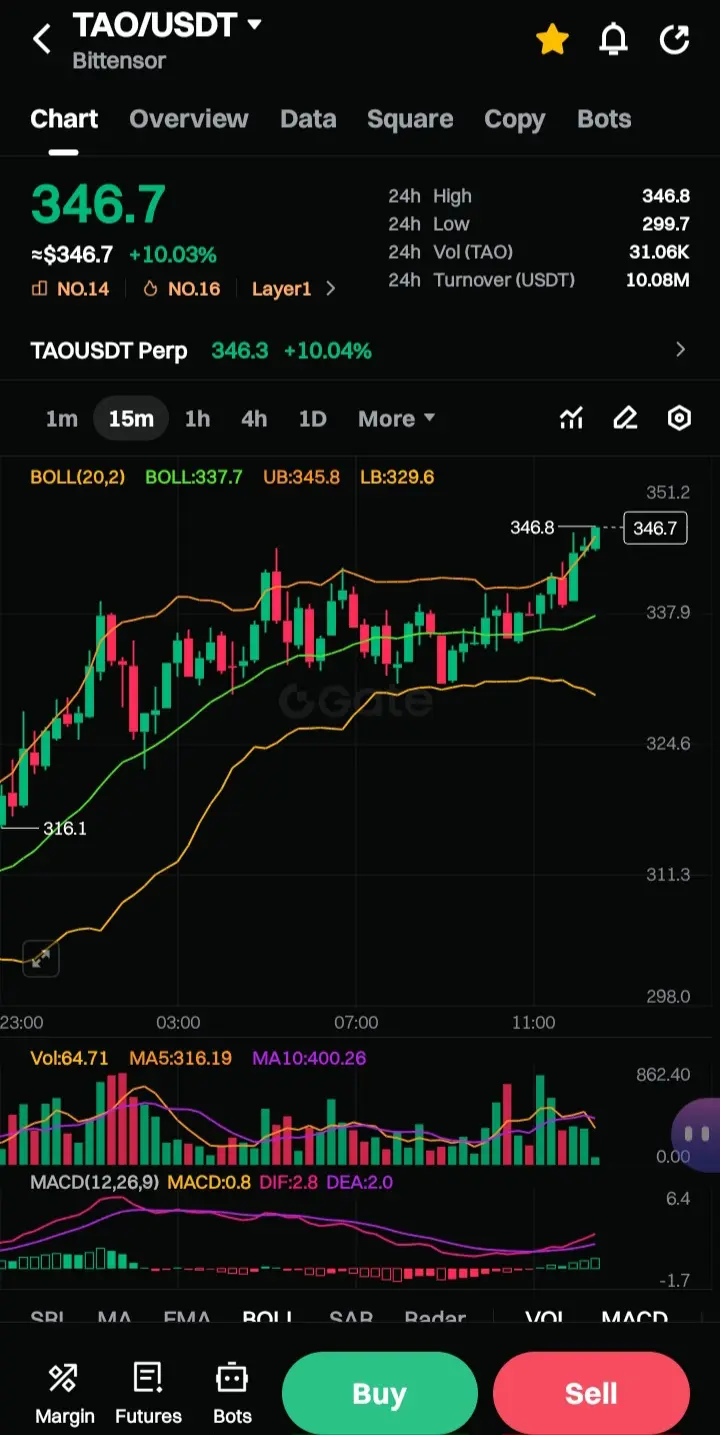
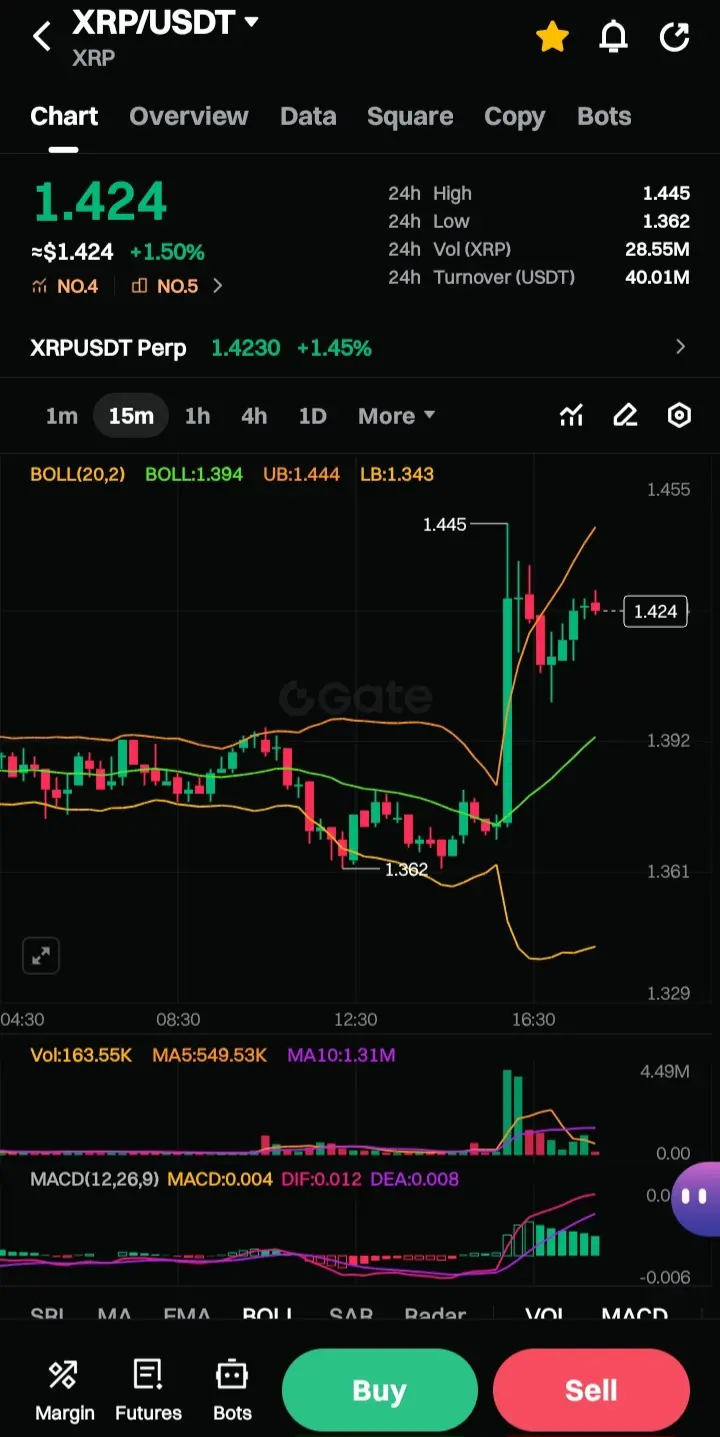
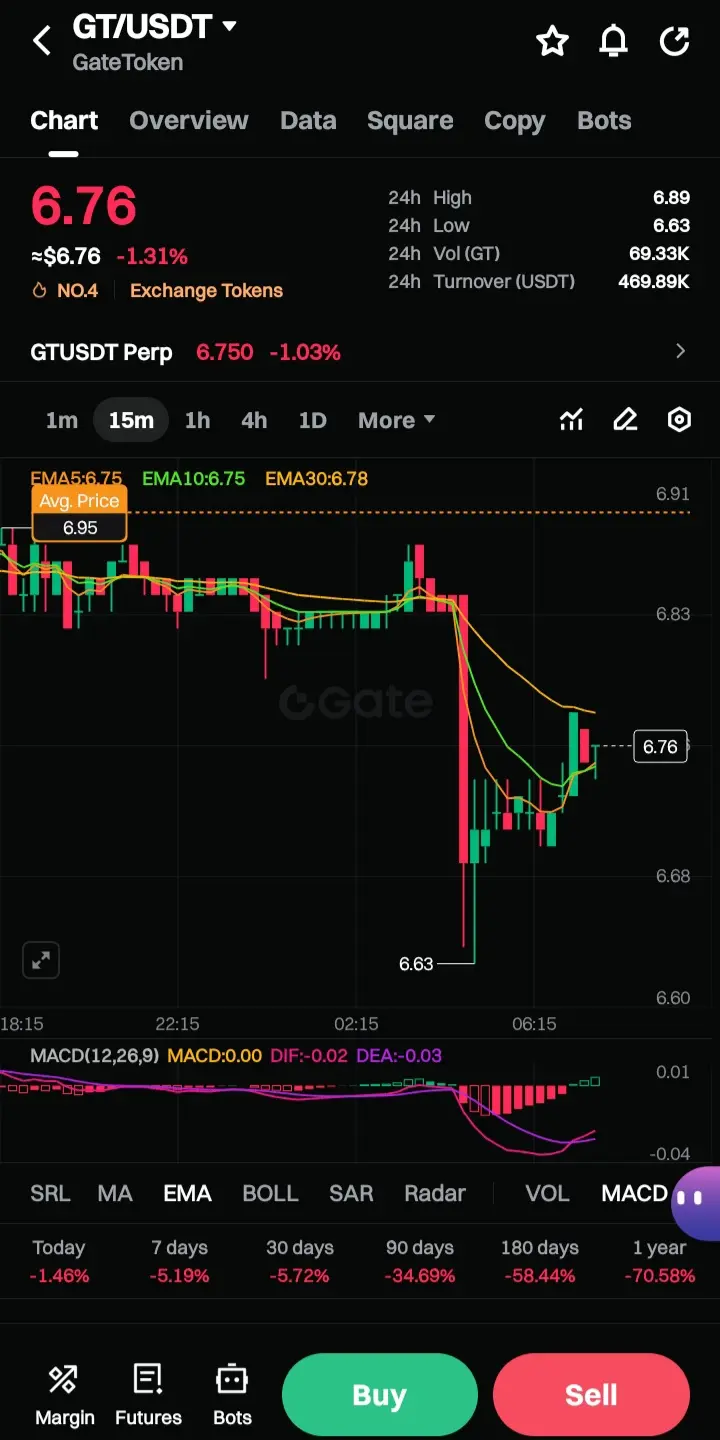
$328 4小时/日内详情(
价格: $346.7 | 涨幅: +10.03%
指标: BOLL)20,2( – 中轨: 337.7 | 上轨: 345.8 | 下轨: 329.6
分析:
此图表捕捉最近的价格行动,价格交易略低于上轨,表明可能存在暂停或分发阶段。
· 趋势: 价格处于带状的上象限,但未能决定性地突破上轨)345.8(,目前交易于346.7)技术上恰好在其上方,但带状收紧(。
· 布林带挤压背景: 这里的带状远比图表1中紧凑。上轨)345.8(和下轨)329.6(之间的距离仅为~$16,相比之下图表1中为~)。这表明虽然日线图波动,但当前4小时时间框架正在盘整。
· 阻力: 上轨345.8是立即障碍。列出的价格水平显示347.9和351.2处的聚集,如果突破恢复,这些是下一个目标。
· 支撑: 在337.7处的中轨是关键支撑。只要价格保持在此之上,4小时结构仍然看涨。
· 成交量: 成交量已崩溃至64.71,远低于MA10$107 400.26(。这是一个严重的信心不足。启动该走势的大型绿色蜡烛看到高成交量,但后续蜡烛)当前数据点(显示成交量极低,表明犹豫。
· RSI: RSI读数86.40处于"超买"区域)高于70(。虽然资产在强劲趋势中可能保持超买,但这样高的读数)接近90(通常先于短期修正或盘整。
· MACD: MACD为正但较小)0.8(,DIF)2.8(略高于DEA)2.0(。与1小时图类似,动能正在平坦化。
结论: 此图表显示短期内疲劳。极低成交量和超买RSI)86.40(的组合表明买家不愿在这些水平入场推高价格。这通常是回撤至中轨)337.7(或支撑位324.6的前兆。
总结与综合
在所有三个时间框架中,一致的叙述浮现:
1. 总体趋势: 强劲看涨。日线图)图表1(确认了具有较大波动率的重要上升趋势。
2. 短期前景: 疲劳和潜在回撤。1小时和4小时图)图表2和3(显示关键预警信号:
· 动能背离: 低时间框架上的MACD正在平坦化或显示看涨动能丧失。
· 成交量干涸: 随着价格达到高位,成交量大幅下降,表明后续买盘跟进不足。
· 超买条件: 4小时图上的RSI极高)86.40(,表明该资产在短期内被高估。
可能的情景:
· 情景A)盘整(: 价格可能在)和$345 $337 之间交易, 在4H上的上轨和中轨之间( 以允许MACD和RSI重置。
· 情景B)回撤(: 鉴于成交量崩溃,可能在下一次上升前回撤至$324.6)图表3中列出的支撑位(或日线中轨$294.8。
· 情景C)抛物线延续(: 为了使涨势立即延续,价格需要突破上方$351.6)图表2的上轨( 且成交量出现显著激增)1H图表上高于1.18K(。没有成交量,突破可能会失败。
价格: $347.1 | 涨幅: +10.16%
指标: BOLL(20,2) – 中轨: 294.8 | 上轨: 348.3 | 下轨: 241.3
分析:
此图表显示三个图表中最激进的扩张。布林带显示上轨348.3和下轨241.3之间存在巨大偏离,表明波动率极高且呈强劲上升趋势。价格目前正在测试上轨。
· 趋势: 强劲看涨突破。价格已明显升至中轨(294.8)上方,该中轨充当均值回归水平。
· 阻力: 当前价格位于上轨(348.3)。持续突破这一水平可能导致抛物线式走势,但历史上,触及上轨通常先于冷却或盘整。
· 支撑: 294.8的中轨是主要动态支撑。241.3的下轨代表趋势反转时的极端看跌情景。
· 成交量: 成交量柱(4.99K)大致与移动平均线(MA5: 5.02K)一致,表明涨势得到一致(尽管不是爆炸性)成交量的支撑。
· MACD: MACD直方图为正(5.9),DIF(17.5)远高于DEA(11.5)。缺口较大,确认了强劲的看涨动能。但是,如此大的缺口通常表明该走势已成熟,短期内过度延伸。
结论: 这是一个高波动率、看涨延续的设置。价格处于上轨的关键拐点。交易员通常寻求突破$348.3以实现延续,或寻求拒绝/回撤至$320 (列出的最接近价格水平)进行重新测试。
(1小时区间)
价格: $347.3 | 涨幅: +10.22%
指标: BOLL(20,2) – 中轨: 328.5 | 上轨: 351.6 | 下轨: 305.5
分析:
此图表聚焦于1小时时间框架,显示与第一个图表类似的看涨结构,但对即时阻力的视图更加紧凑。
· 趋势: 价格紧贴上布林带(351.6)。在328.5处的中轨呈激进向上倾斜,表明陡峭上升。
· 阻力: 立即阻力为上轨351.6。值得注意的是,列出的价格水平显示347.3和347.9聚集在一起,构成价格目前正在争取的次要日内阻力区。
· 支撑: 关键支撑位于332.4和中轨328.5处。在1小时图上突破中轨下方将是短期趋势反转或获利了结事件的信号。
· 成交量: 成交量(717.49)低于MA5(1.18K)。这是一个微妙的预警信号。对于强劲的突破,我们预期成交量高于移动平均线。价格峰值期间成交量下降表明买盘压力减弱。
· MACD: MACD近乎平坦(0.1),DIF(10.0)仅略高于DEA(9.9)。在1小时图上,这种收敛表明动能减弱。DIF在此处破位下穿DEA的看跌交叉(将是短期交易员的强劲卖出信号。
结论: 此图表显示动能停滞。尽管价格高企,但成交量下降和MACD平坦表明即时向上的推力正在失去动能。在下一次主要走势前,很可能出现盘整或小幅回撤至$332–)范围。
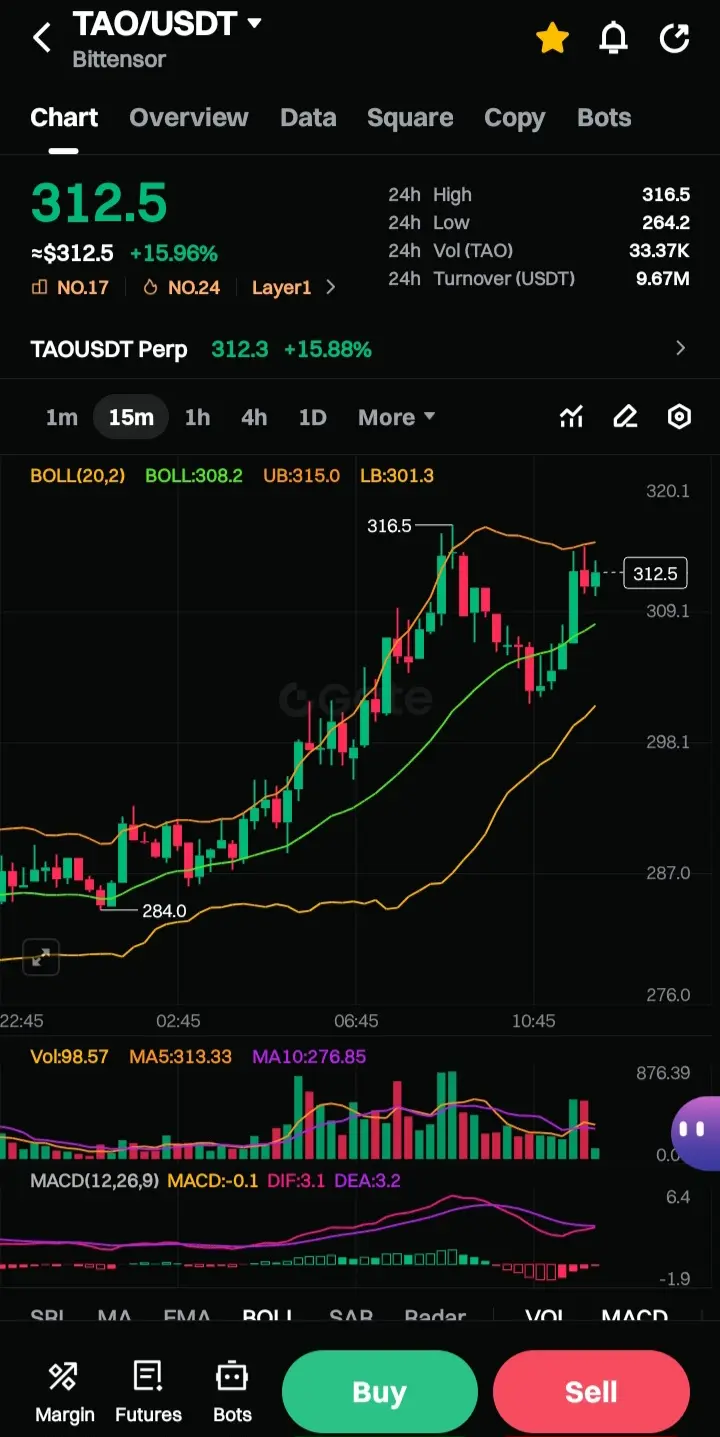
$328 4小时/日内详情(
价格: $346.7 | 涨幅: +10.03%
指标: BOLL)20,2( – 中轨: 337.7 | 上轨: 345.8 | 下轨: 329.6
分析:
此图表捕捉最近的价格行动,价格交易略低于上轨,表明可能存在暂停或分发阶段。
· 趋势: 价格处于带状的上象限,但未能决定性地突破上轨)345.8(,目前交易于346.7)技术上恰好在其上方,但带状收紧(。
· 布林带挤压背景: 这里的带状远比图表1中紧凑。上轨)345.8(和下轨)329.6(之间的距离仅为~$16,相比之下图表1中为~)。这表明虽然日线图波动,但当前4小时时间框架正在盘整。
· 阻力: 上轨345.8是立即障碍。列出的价格水平显示347.9和351.2处的聚集,如果突破恢复,这些是下一个目标。
· 支撑: 在337.7处的中轨是关键支撑。只要价格保持在此之上,4小时结构仍然看涨。
· 成交量: 成交量已崩溃至64.71,远低于MA10$107 400.26(。这是一个严重的信心不足。启动该走势的大型绿色蜡烛看到高成交量,但后续蜡烛)当前数据点(显示成交量极低,表明犹豫。
· RSI: RSI读数86.40处于"超买"区域)高于70(。虽然资产在强劲趋势中可能保持超买,但这样高的读数)接近90(通常先于短期修正或盘整。
· MACD: MACD为正但较小)0.8(,DIF)2.8(略高于DEA)2.0(。与1小时图类似,动能正在平坦化。
结论: 此图表显示短期内疲劳。极低成交量和超买RSI)86.40(的组合表明买家不愿在这些水平入场推高价格。这通常是回撤至中轨)337.7(或支撑位324.6的前兆。
总结与综合
在所有三个时间框架中,一致的叙述浮现:
1. 总体趋势: 强劲看涨。日线图)图表1(确认了具有较大波动率的重要上升趋势。
2. 短期前景: 疲劳和潜在回撤。1小时和4小时图)图表2和3(显示关键预警信号:
· 动能背离: 低时间框架上的MACD正在平坦化或显示看涨动能丧失。
· 成交量干涸: 随着价格达到高位,成交量大幅下降,表明后续买盘跟进不足。
· 超买条件: 4小时图上的RSI极高)86.40(,表明该资产在短期内被高估。
可能的情景:
· 情景A)盘整(: 价格可能在)和$345 $337 之间交易, 在4H上的上轨和中轨之间( 以允许MACD和RSI重置。
· 情景B)回撤(: 鉴于成交量崩溃,可能在下一次上升前回撤至$324.6)图表3中列出的支撑位(或日线中轨$294.8。
· 情景C)抛物线延续(: 为了使涨势立即延续,价格需要突破上方$351.6)图表2的上轨( 且成交量出现显著激增)1H图表上高于1.18K(。没有成交量,突破可能会失败。