

ALongStrategyTheory
GZH Tang Seng doesn't eat anything.
ALongStrategyTheory
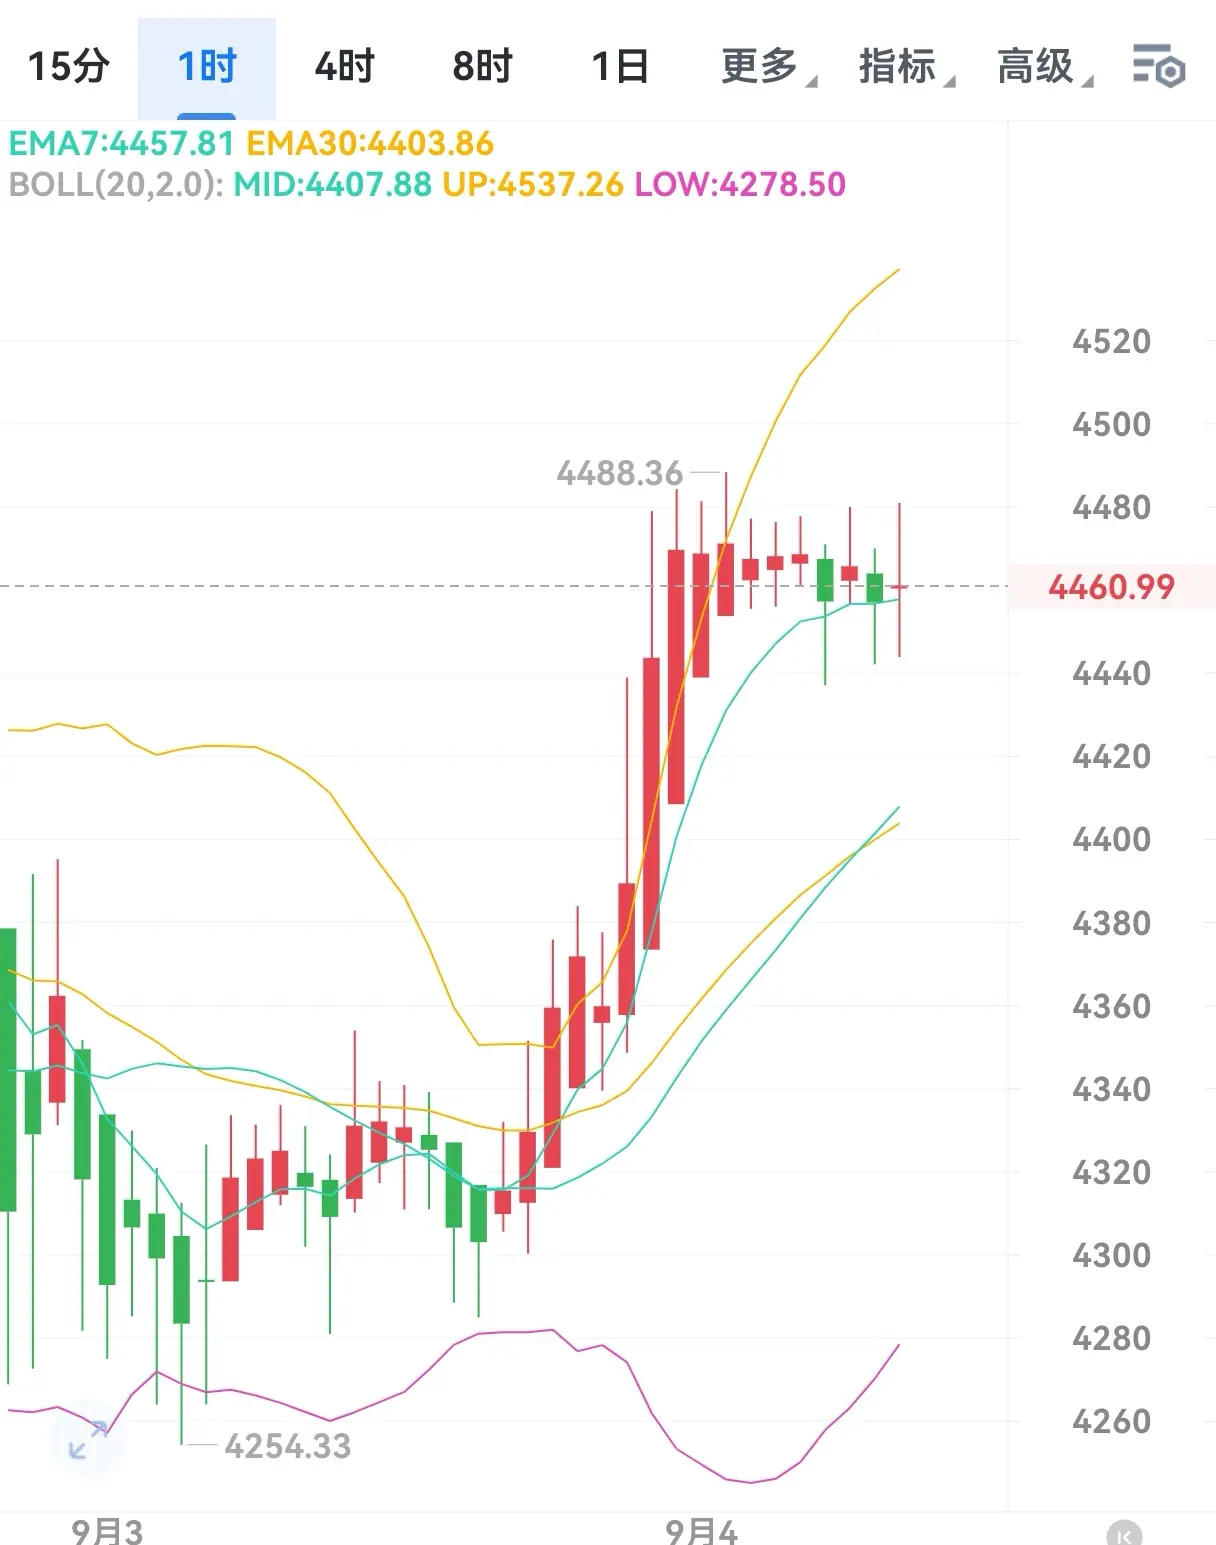
9.4 Morning Ethereum (ETH) Market Insights
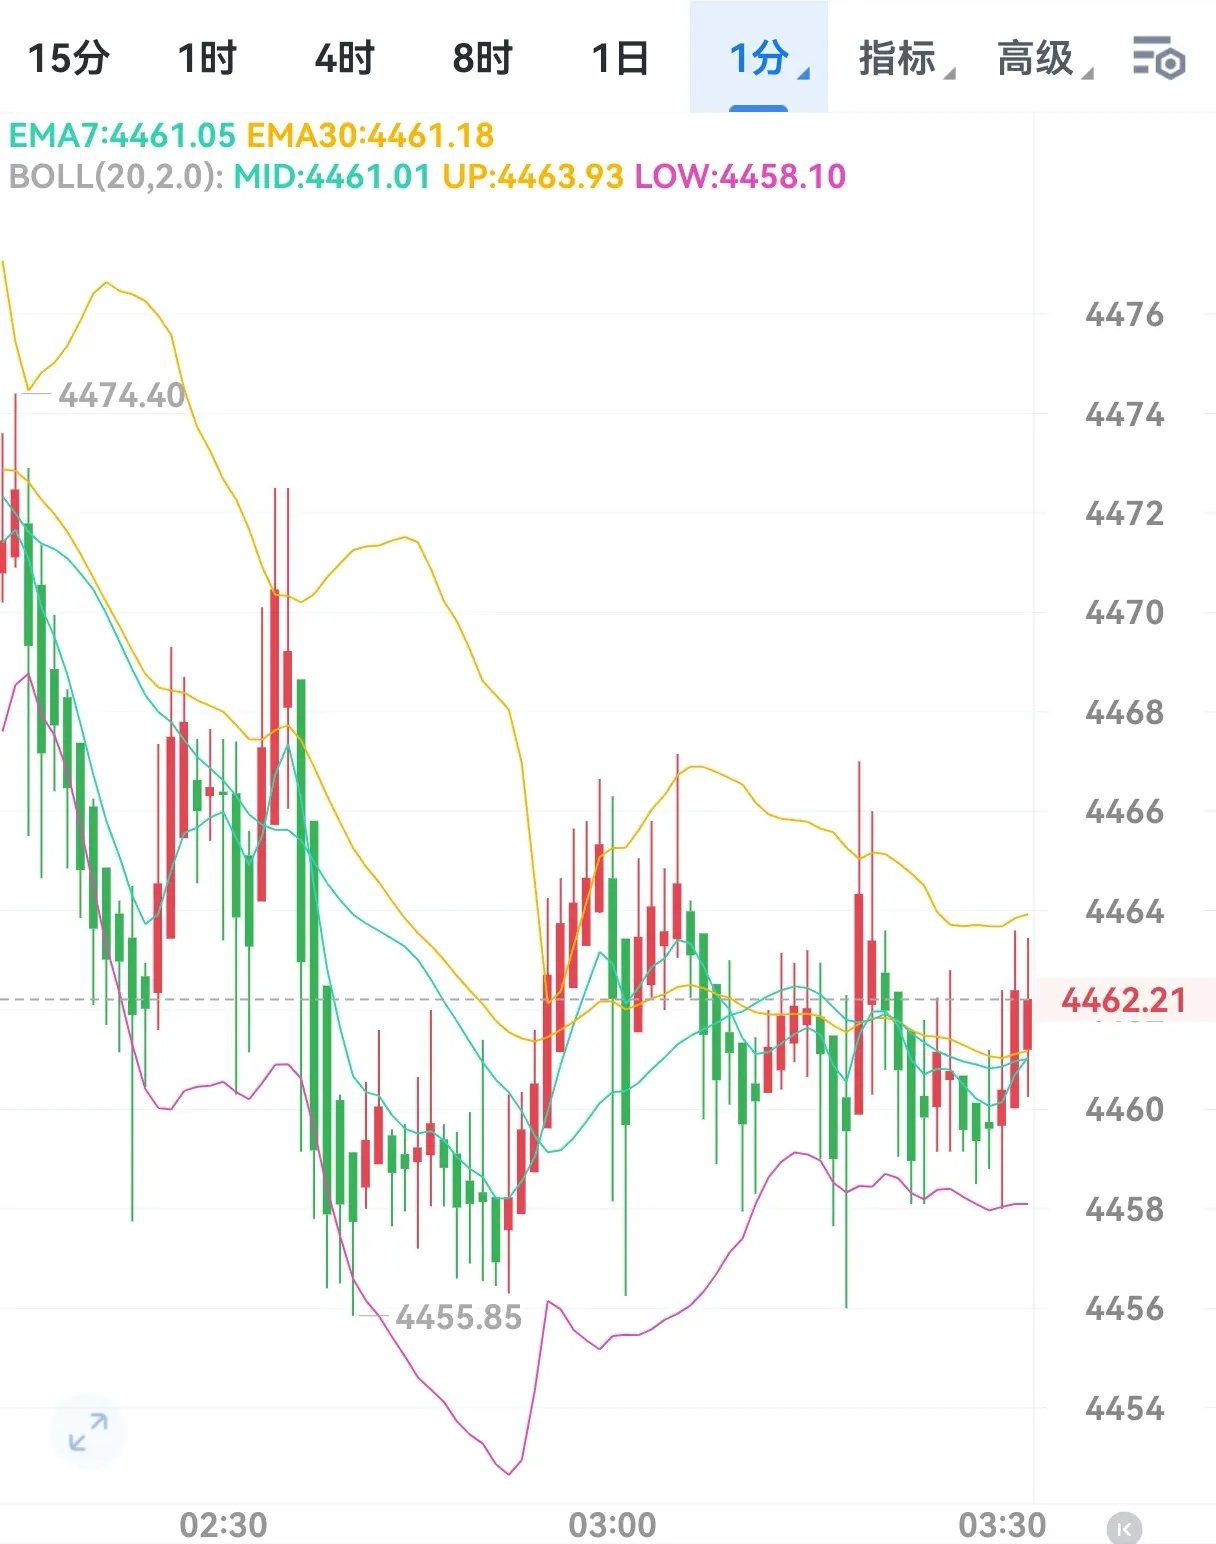
The 15-minute candlestick chart shows that ETH surged to around 4490 in the early hours of today, but then fell back under pressure, entering a phase of repeated consolidation. The current price is hovering around 4450, with the middle band of the Bollinger Bands forming a clear resistance, and the short-term moving averages starting to converge. These signs indicate a lack of short-term momentum, with both bulls and bears in a stalemate.
Although there are still uncertain risks in the short term, from a medium to long-term perspective, the trend
View OriginalThe 15-minute candlestick chart shows that ETH surged to around 4490 in the early hours of today, but then fell back under pressure, entering a phase of repeated consolidation. The current price is hovering around 4450, with the middle band of the Bollinger Bands forming a clear resistance, and the short-term moving averages starting to converge. These signs indicate a lack of short-term momentum, with both bulls and bears in a stalemate.
Although there are still uncertain risks in the short term, from a medium to long-term perspective, the trend
- Reward
- like
- Comment
- Repost
- Share
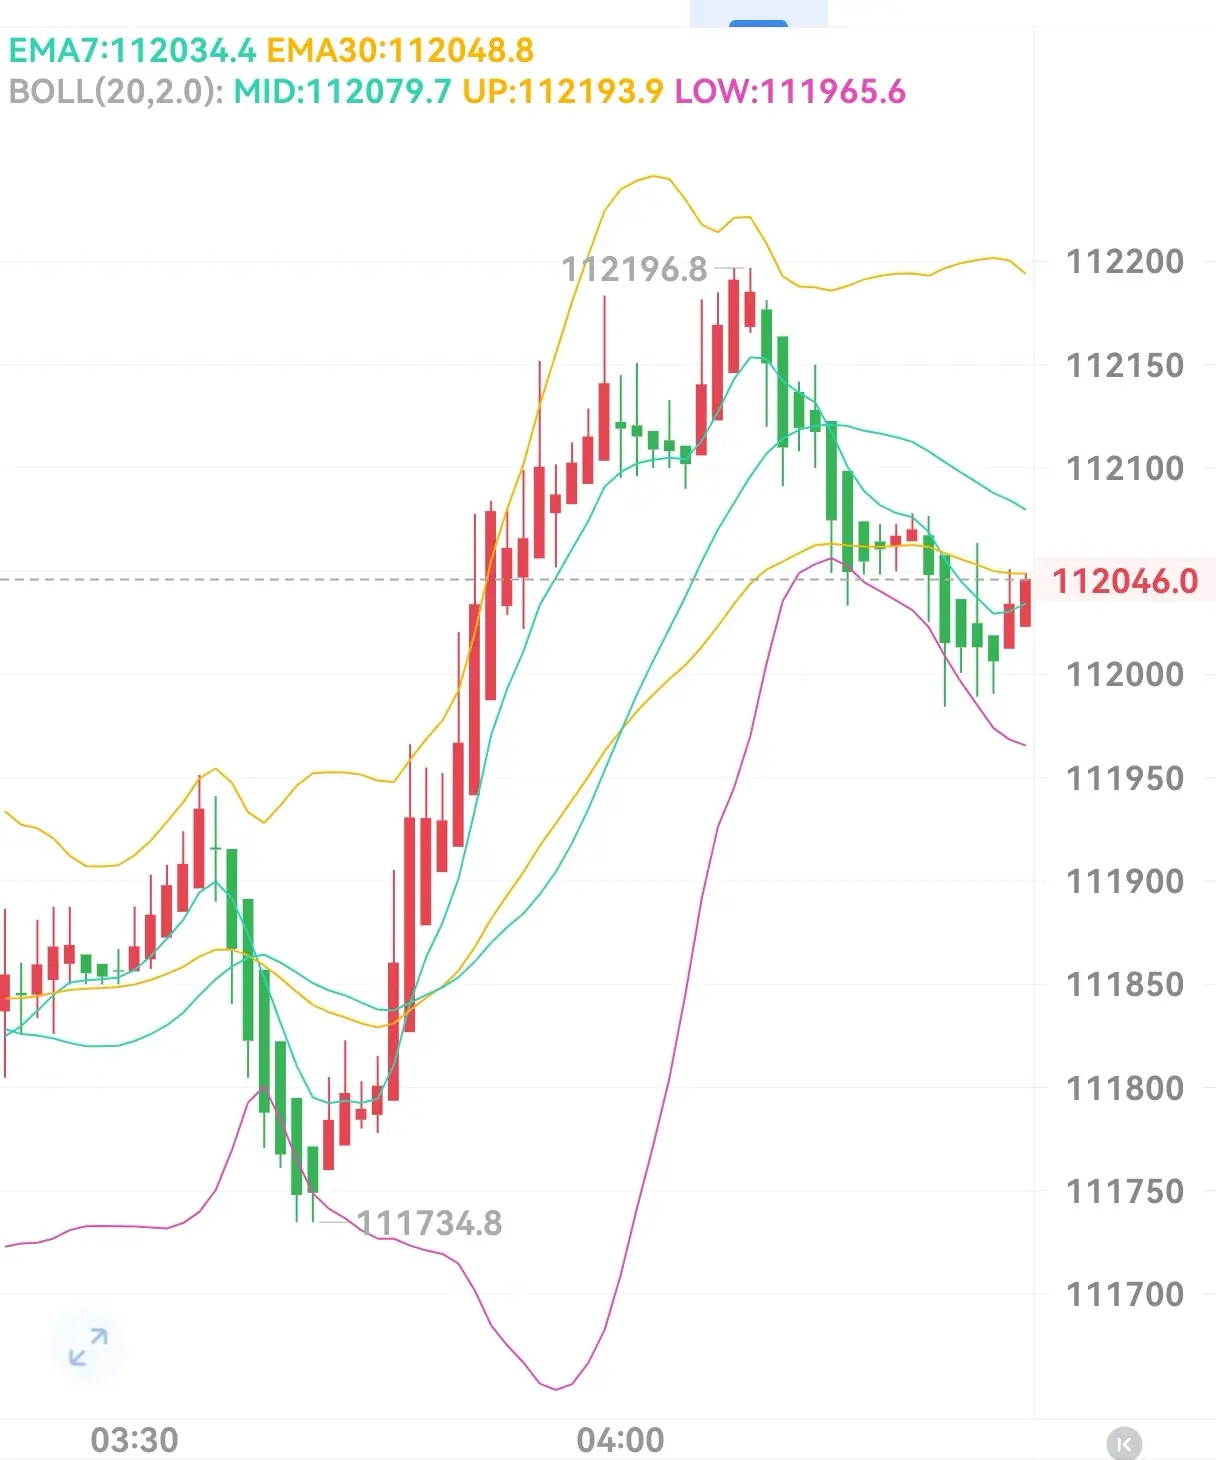
9.4 Morning BTC Insights
Currently, BTC is fluctuating near the high level of 11.2, with the hourly Bollinger Bands slowing down. The MA5 and MA10 moving averages are gradually converging. In the morning session, pay attention to the retracement space of BTC and the support near the middle band of the Bollinger Bands. Yita is consolidating near the high level of 4450. Due to the large amount of trapped positions in this area and the continuous decline in trading volume, Yita lacks favorable conditions for an upward attack. In the morning session, wait for the adjustment to complete before ente
Currently, BTC is fluctuating near the high level of 11.2, with the hourly Bollinger Bands slowing down. The MA5 and MA10 moving averages are gradually converging. In the morning session, pay attention to the retracement space of BTC and the support near the middle band of the Bollinger Bands. Yita is consolidating near the high level of 4450. Due to the large amount of trapped positions in this area and the continuous decline in trading volume, Yita lacks favorable conditions for an upward attack. In the morning session, wait for the adjustment to complete before ente
BTC-0.05%
- Reward
- like
- Comment
- Repost
- Share
Analysis of BTC market trends in the early morning
Today, the BTC trend is relatively strong, showing a slight upward movement during the day, continuing the trend of oscillating upwards. Recently, I have reminded everyone multiple times that a low long position is a feasible strategy, and the entry logic remains consistent: as long as there is a pullback, it is a good time to go long. For friends trading in spot, you can choose to lay out your initial position at low prices, but it is crucial to manage your position size carefully.
However, it is important to pay special attention to the
View OriginalToday, the BTC trend is relatively strong, showing a slight upward movement during the day, continuing the trend of oscillating upwards. Recently, I have reminded everyone multiple times that a low long position is a feasible strategy, and the entry logic remains consistent: as long as there is a pullback, it is a good time to go long. For friends trading in spot, you can choose to lay out your initial position at low prices, but it is crucial to manage your position size carefully.
However, it is important to pay special attention to the
- Reward
- like
- Comment
- Repost
- Share
The night is deep, are you tossing and turning, still worried about the trap order?
I also cannot sleep, in this quiet deep night, I wish to help you relieve your worries.
Feel free to send the list over so I can analyze it together with you. If I can help you resolve a deal, I will, so you don't have to bear this pressure alone.
To understand, grasping the principle of following the trend is key to escaping the trap; with the right direction, the road ahead will naturally open up.
View OriginalI also cannot sleep, in this quiet deep night, I wish to help you relieve your worries.
Feel free to send the list over so I can analyze it together with you. If I can help you resolve a deal, I will, so you don't have to bear this pressure alone.
To understand, grasping the principle of following the trend is key to escaping the trap; with the right direction, the road ahead will naturally open up.

- Reward
- like
- Comment
- Repost
- Share
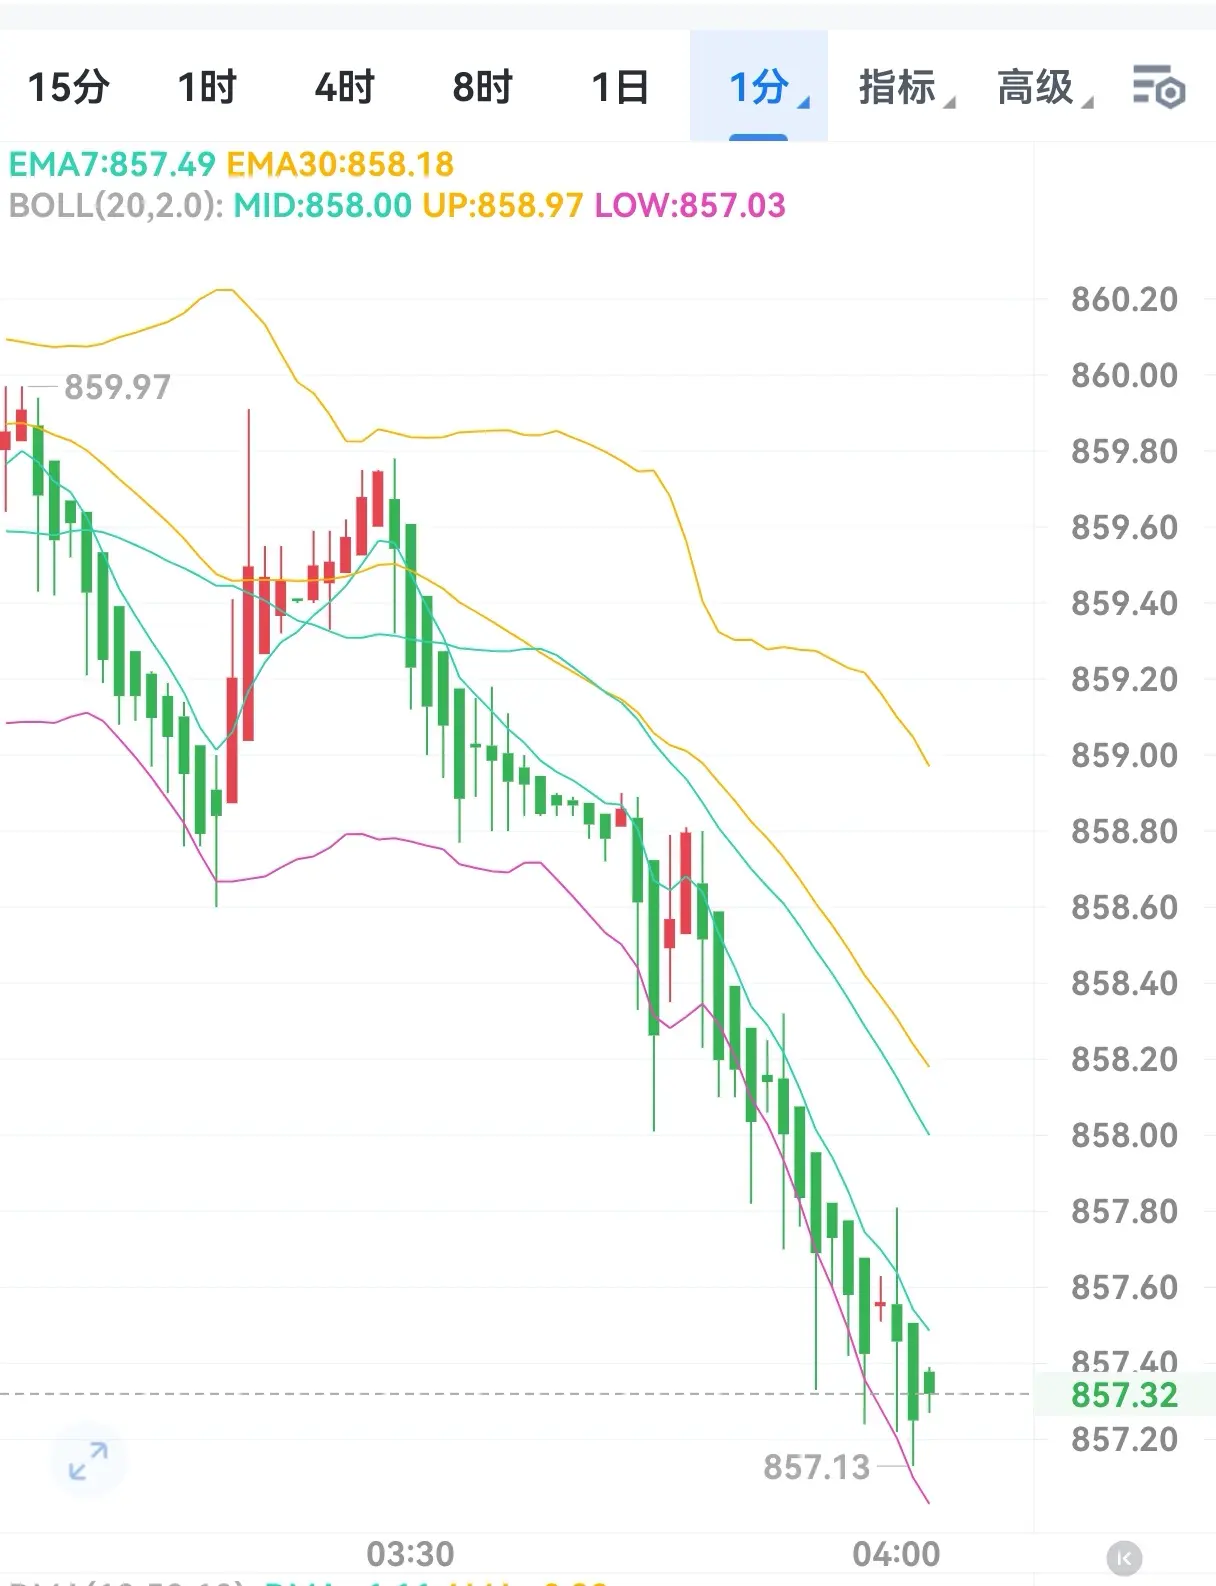
9.4 Early Morning BNB Market Insights
Analyzing the current market, although the MACD histogram of BNB continues to be negative, its length is gradually shortening. This means that while the bearish strength has not dissipated, it is slowly weakening; however, the overall trend still shows a significant downward movement.
Suggested Action: If you want to enter the market, you can layout a short position in the 870 - 875 range. For short-term trading, target price is set at 830; for medium to long-term investment, you can set targets sequentially at around 800 - 770 - 750. If the BNB price
BNB-0.37%
- Reward
- like
- Comment
- Repost
- Share
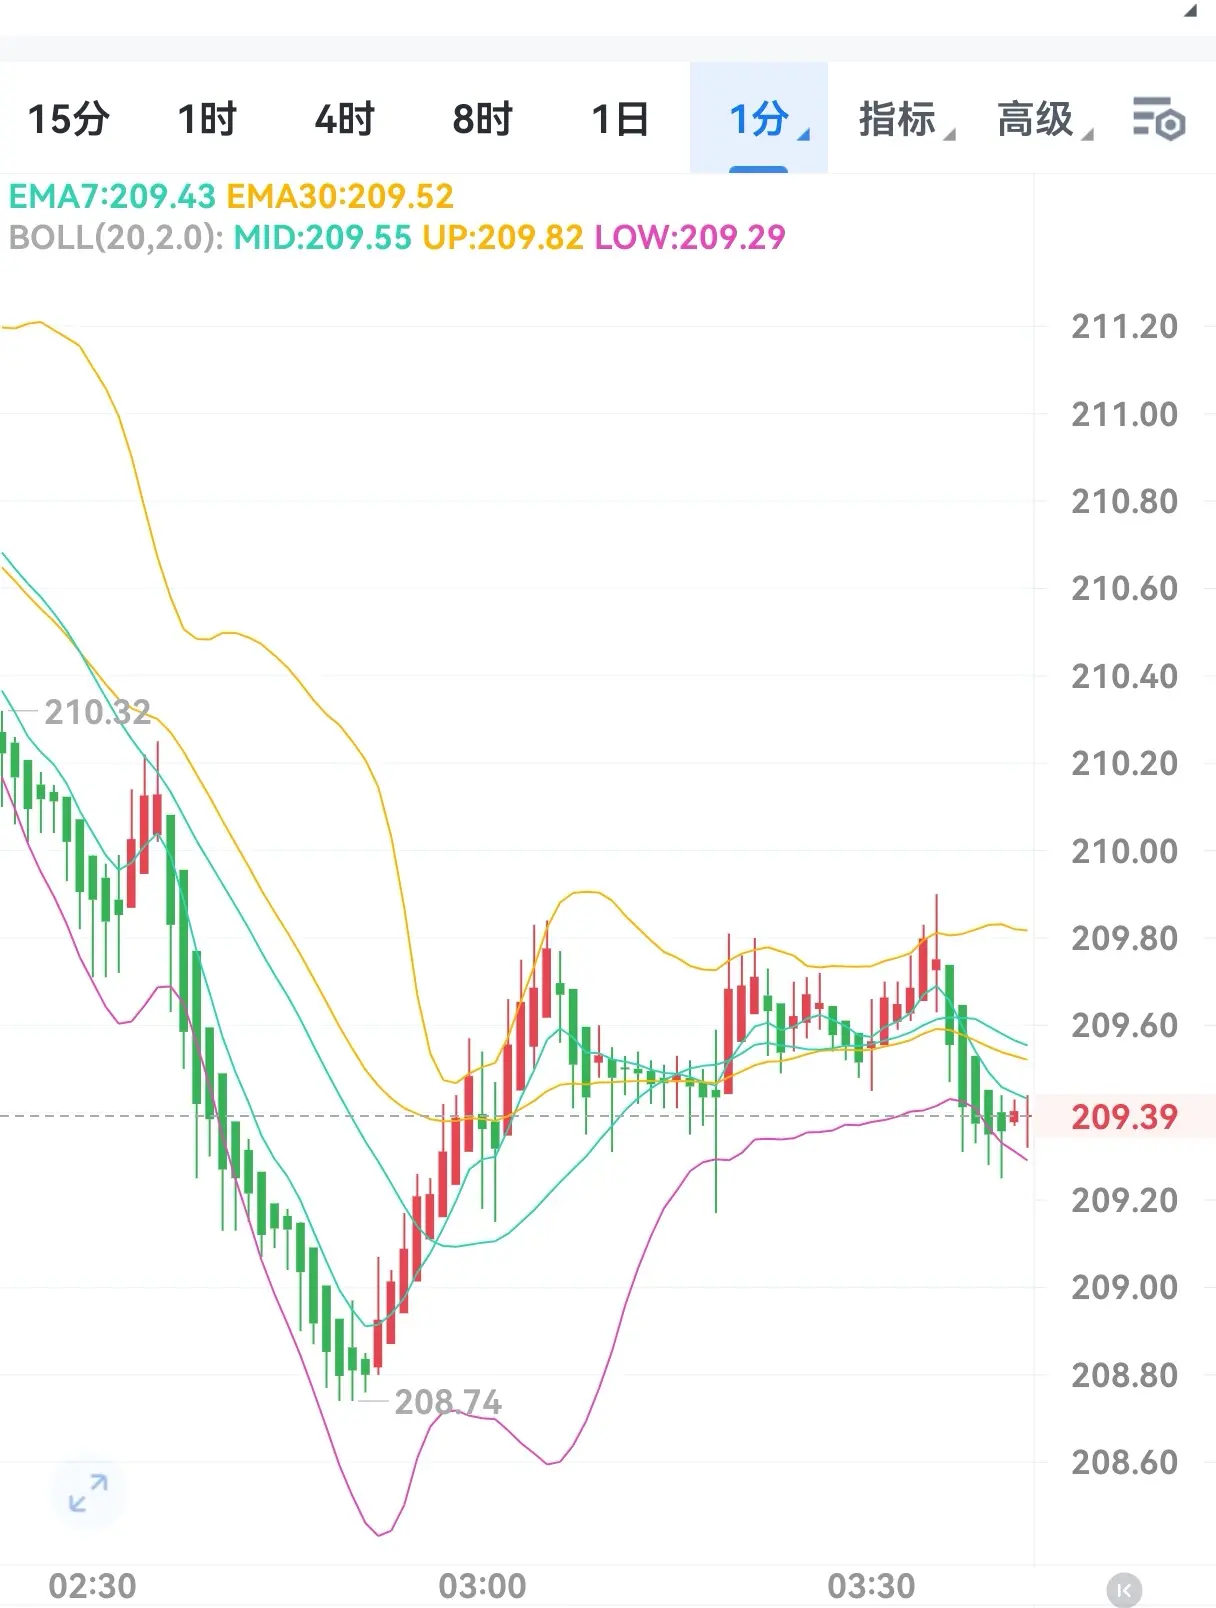
The current SOL price is at the median. The upper resistance range is between 215 - 218. If you plan to short, you can try a light position in this range and set the stop loss at 220.
In the night market, the lower support is at 207 - 205. As long as it doesn't break this range during the pullback, the bullish trend is still under control. Only if it breaks this range, the market may test the lows again, with further target support looking towards 197 - 193.
In the night market, the lower support is at 207 - 205. As long as it doesn't break this range during the pullback, the bullish trend is still under control. Only if it breaks this range, the market may test the lows again, with further target support looking towards 197 - 193.
SOL-0.46%
- Reward
- like
- Comment
- Repost
- Share
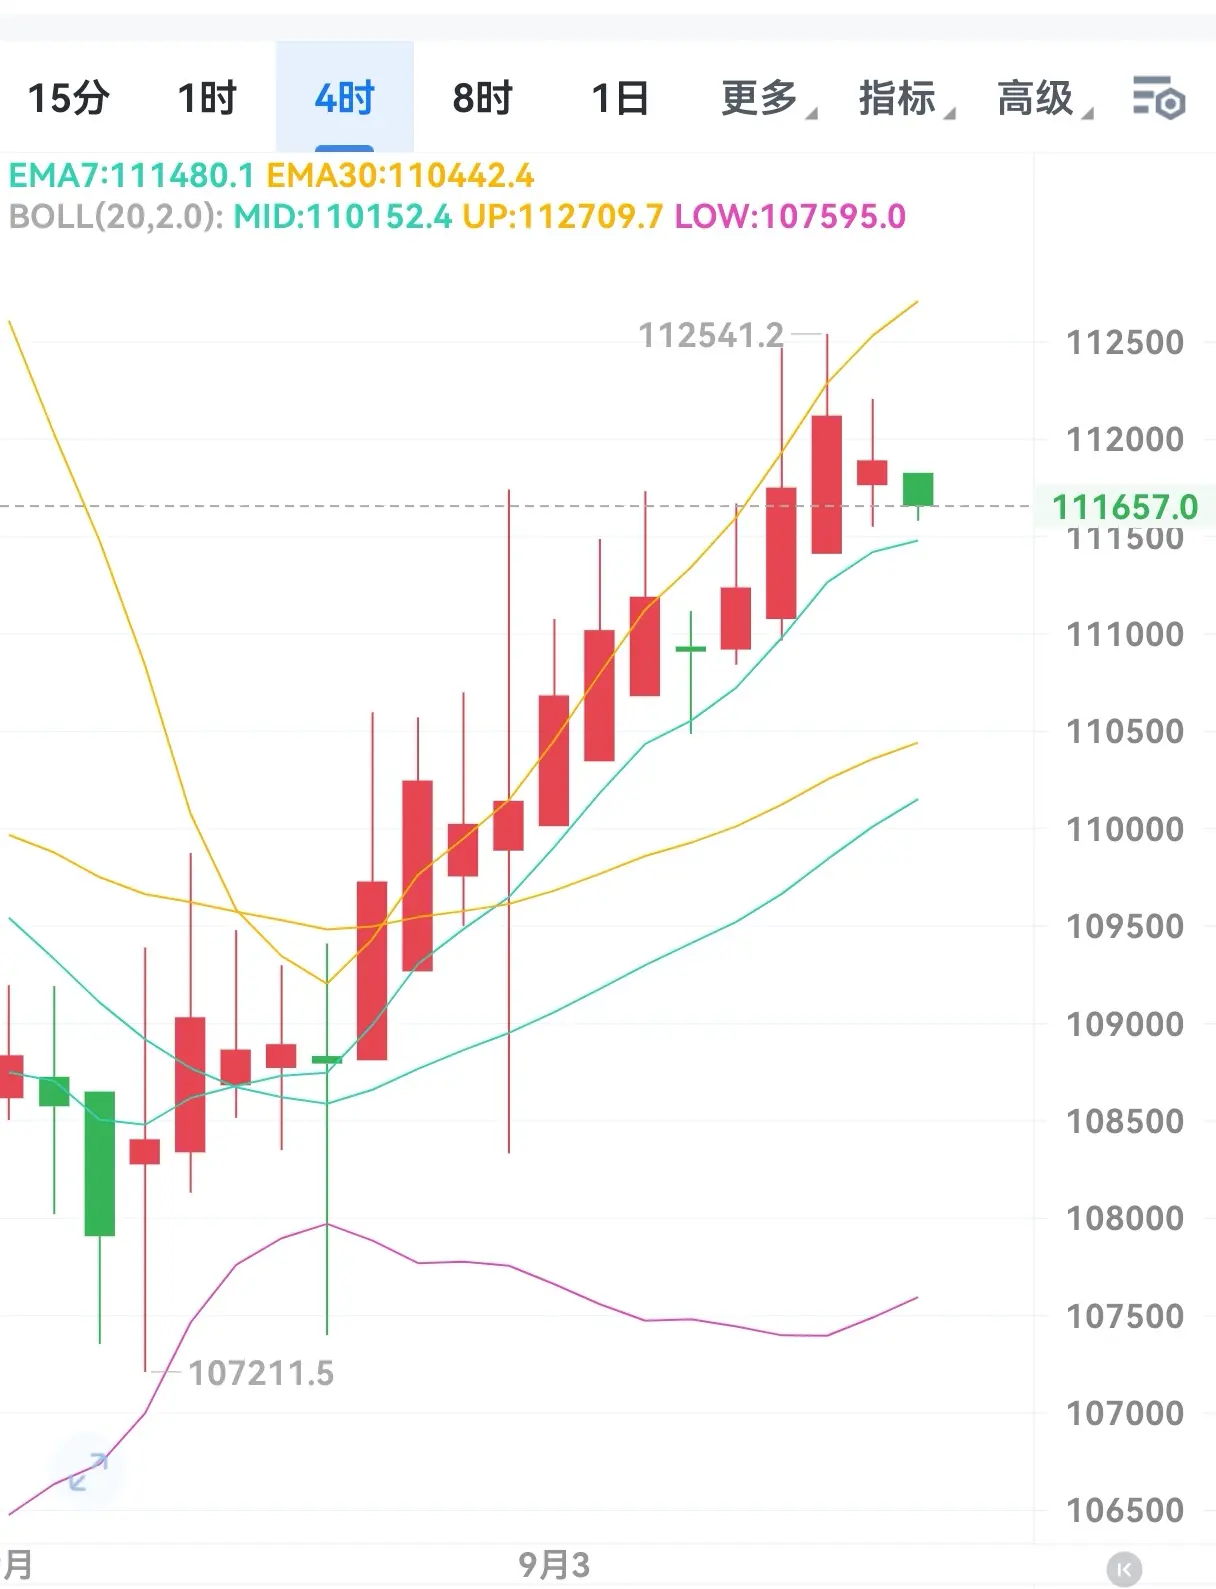
Insights on the Ethereum (ETH) market on the early morning of the 9th.
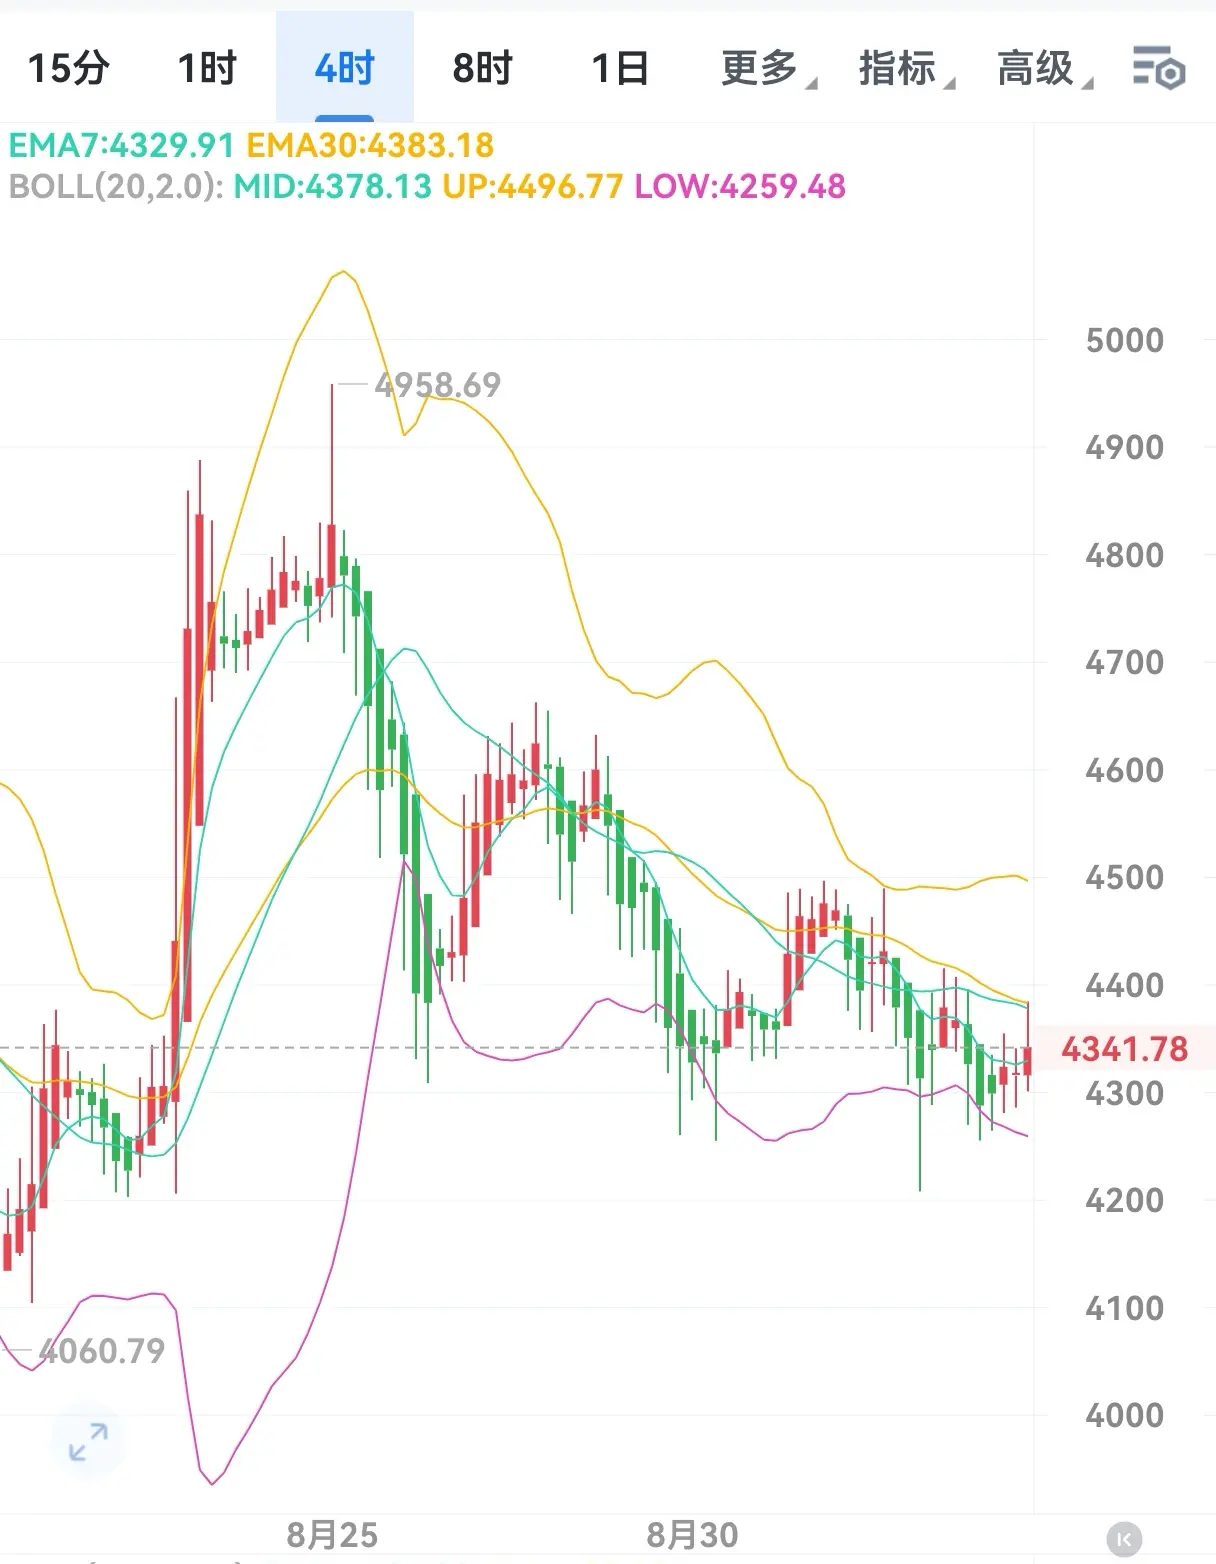
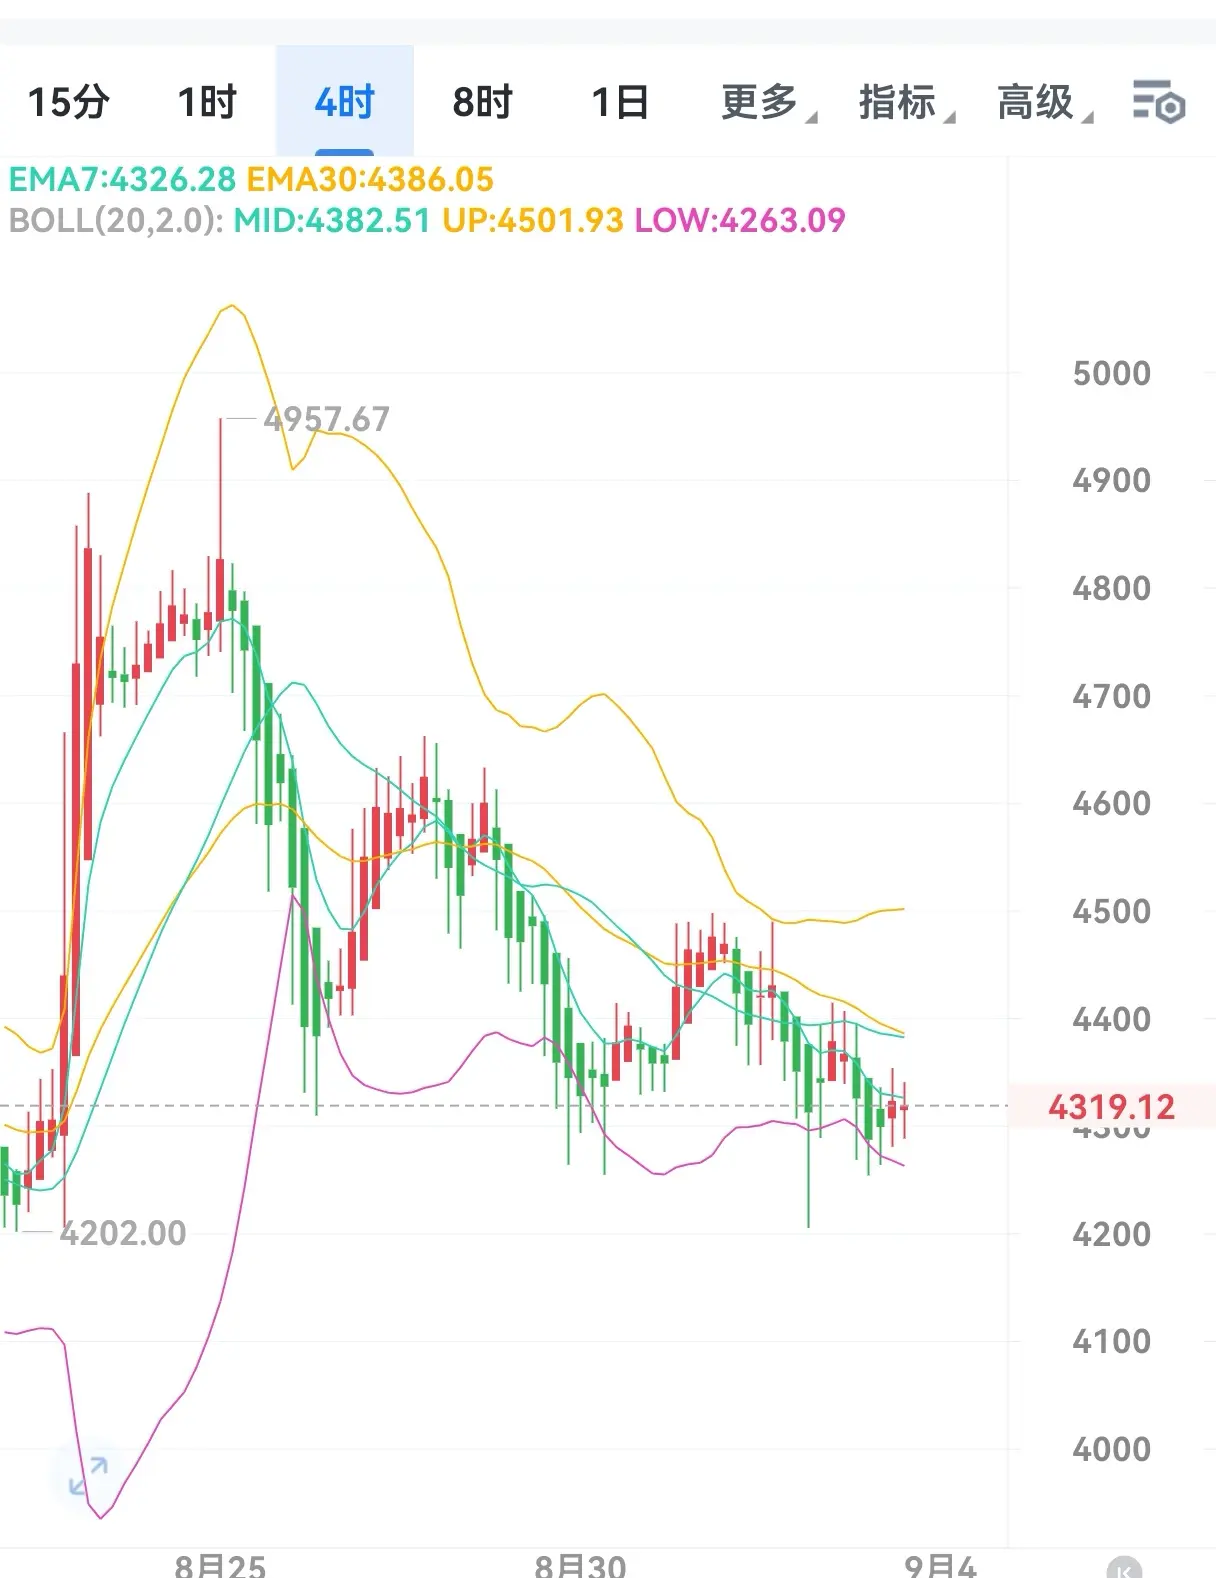
From the 4-hour candlestick chart, the price of ETH has rebounded strongly at the lower Bollinger Band at 4250, and has successfully stood above the middle band at 4380. This trend releases a positive signal for short-term stabilization.
In terms of resistance levels, the upper Bollinger Band is in the range of 4506 - 4520. Once the price can effectively break through this range, it will expand the space for further upward movement. On the support side, the short-term support is located in the range of 4380 - 4400, whil
ETH1.75%
- Reward
- like
- Comment
- Repost
- Share
The release of the US Non-farm Payrolls (NFP) is likely to bring Bitcoin (BTC) and Ethereum (ETH) to critical price points.
As a core indicator of the US economy, the impact path of US Non-farm Payrolls (NFP) on these two major cryptocurrencies is clear:
- If the data is weak, the market's bets on the Federal Reserve cutting interest rates will become stronger, risk asset sentiment may warm up, and Bitcoin and Ethereum may rise on expectations of liquidity easing.
- If the data performs strongly, it may strengthen expectations for the Federal Reserve to maintain high interest rates. Un
View OriginalAs a core indicator of the US economy, the impact path of US Non-farm Payrolls (NFP) on these two major cryptocurrencies is clear:
- If the data is weak, the market's bets on the Federal Reserve cutting interest rates will become stronger, risk asset sentiment may warm up, and Bitcoin and Ethereum may rise on expectations of liquidity easing.
- If the data performs strongly, it may strengthen expectations for the Federal Reserve to maintain high interest rates. Un


- Reward
- like
- Comment
- Repost
- Share
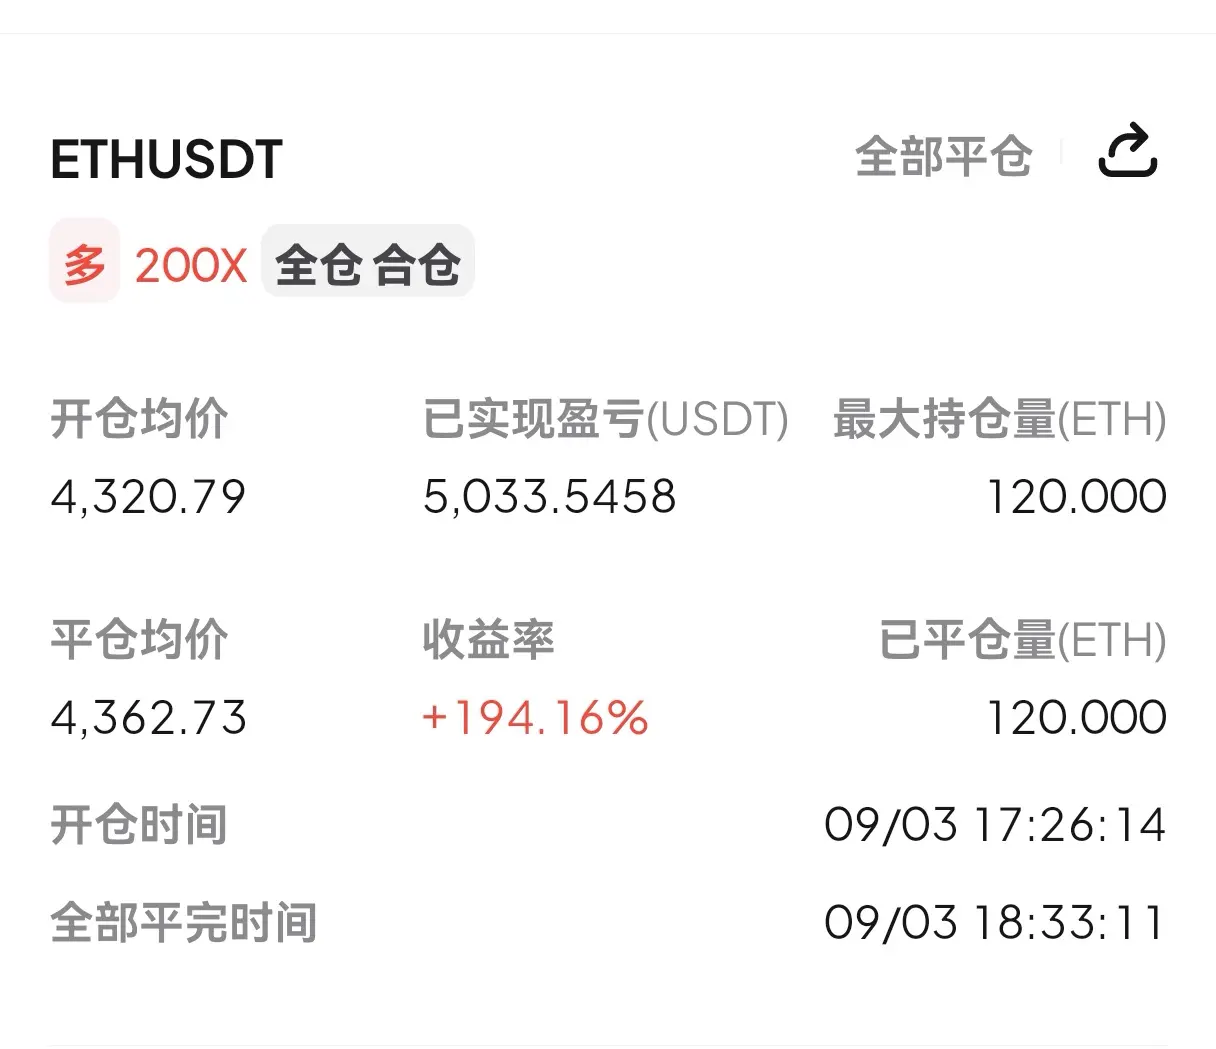
Today, the students operated smoothly and successfully achieved double the position size. The last order of ETH long order had a profit of up to 5033u, securing a solid 42 points.
In fact, doubling the position size is not a difficult task; it's just like climbing stairs. As long as the method is appropriate and the skills are proficient, even climbing to the tenth floor won't feel strenuous.
View OriginalIn fact, doubling the position size is not a difficult task; it's just like climbing stairs. As long as the method is appropriate and the skills are proficient, even climbing to the tenth floor won't feel strenuous.


- Reward
- like
- Comment
- Repost
- Share
9.3 Evening Ethereum (ETH) Market Insights
Ethereum (ETH) has shown significant upward momentum recently after experiencing a period of volatile adjustment. Its price has strongly broken through the upper Bollinger Band, while the MACD indicator has formed a golden cross, clearly releasing bullish signals.
The individual suggests the following operation: When the price is in the range of 4310 - 4340, consider placing long orders, with an initial profit target looking towards 4400 - 4450.
View OriginalEthereum (ETH) has shown significant upward momentum recently after experiencing a period of volatile adjustment. Its price has strongly broken through the upper Bollinger Band, while the MACD indicator has formed a golden cross, clearly releasing bullish signals.
The individual suggests the following operation: When the price is in the range of 4310 - 4340, consider placing long orders, with an initial profit target looking towards 4400 - 4450.
- Reward
- like
- Comment
- Repost
- Share
Analysis of the trading strategy for Bitcoin (BTC) on the evening of 9.3
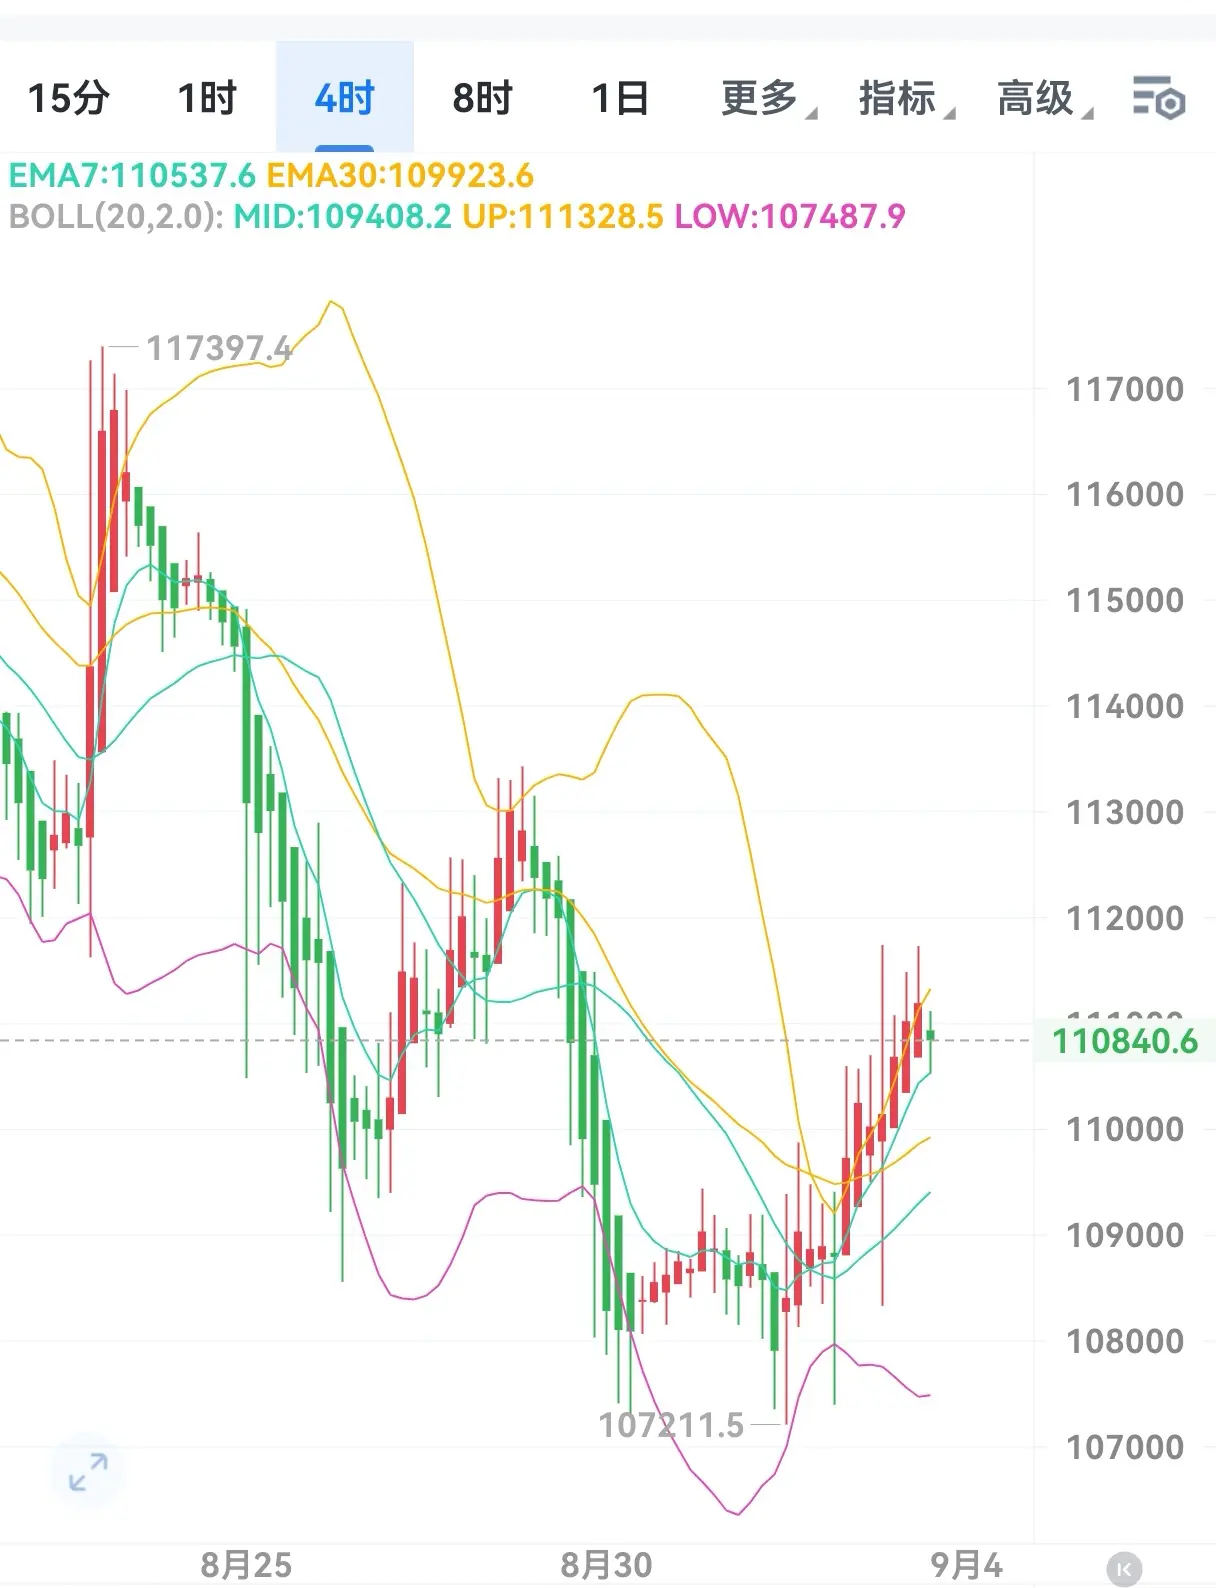
Bitcoin daily chart has closed positive for two consecutive days, indicating that bullish momentum has strengthened. However, the current Bitcoin price is about to face the key resistance level of $111,700. If the price can effectively hold above this resistance level, it is expected to initiate a new round of upward movement; conversely, if it encounters resistance and falls back here, it is likely to return to a range-bound trend.
Based on this market analysis, Aaron provides the trading strategy: before the price b
BTC-0.05%
- Reward
- like
- Comment
- Repost
- Share
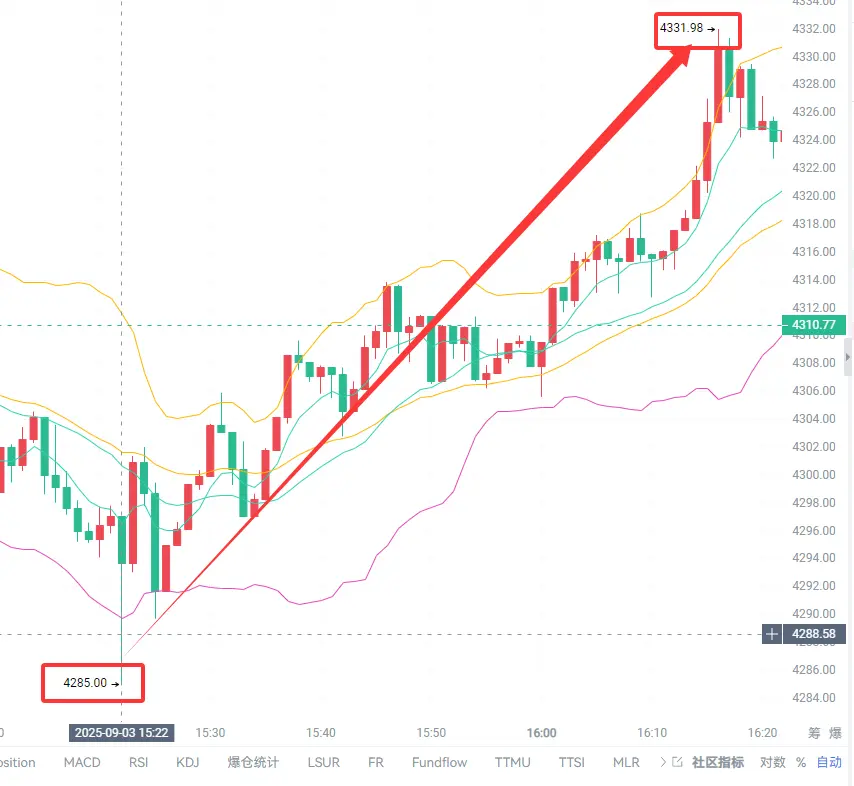
The ETH strategy shared at midday has shown a very ideal market trend. Although it didn't reach the target point perfectly, the overall gain was quite substantial. If there are more opportunities like this, can you keep up with the rhythm? This time it was easy to secure 45 points and successfully recover losses. Following A Long's rhythm, you won't have to risk snatching food from the tiger's mouth anymore!
View Original
- Reward
- like
- Comment
- Repost
- Share
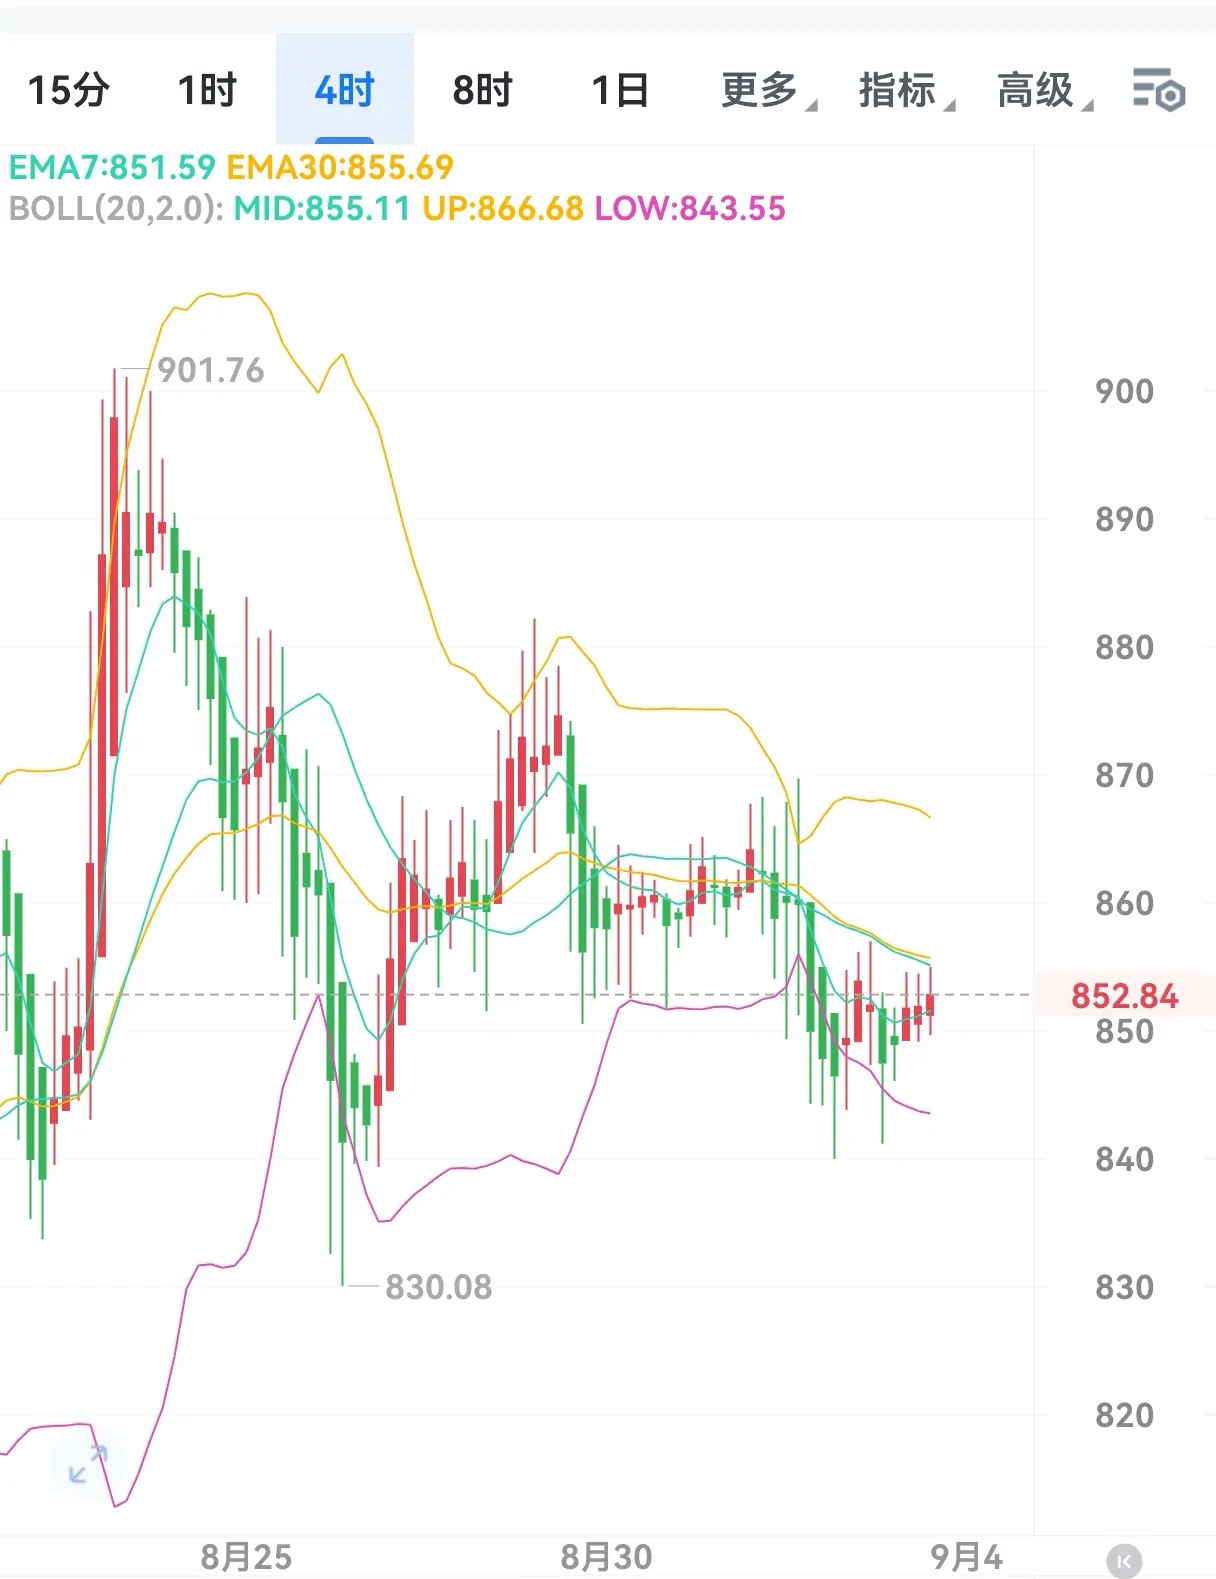
9.3 Today's BNB Market Insights
The current trading price of BNB is hovering around 855. In the past 24 hours, its price fluctuation range has been between 841 and 856.
If the price falls below 840, the next support level is expected to be between 820 and 830. Once it breaks above 860, the subsequent target may point to 900.
BNB is now nearing its all-time high, and the price movements in the next few days will be crucial, determining whether it will break through or enter a correction phase. Why not take a guess? Will BNB surge towards 900 or drop to 820?
BNB-0.37%
- Reward
- like
- Comment
- Repost
- Share
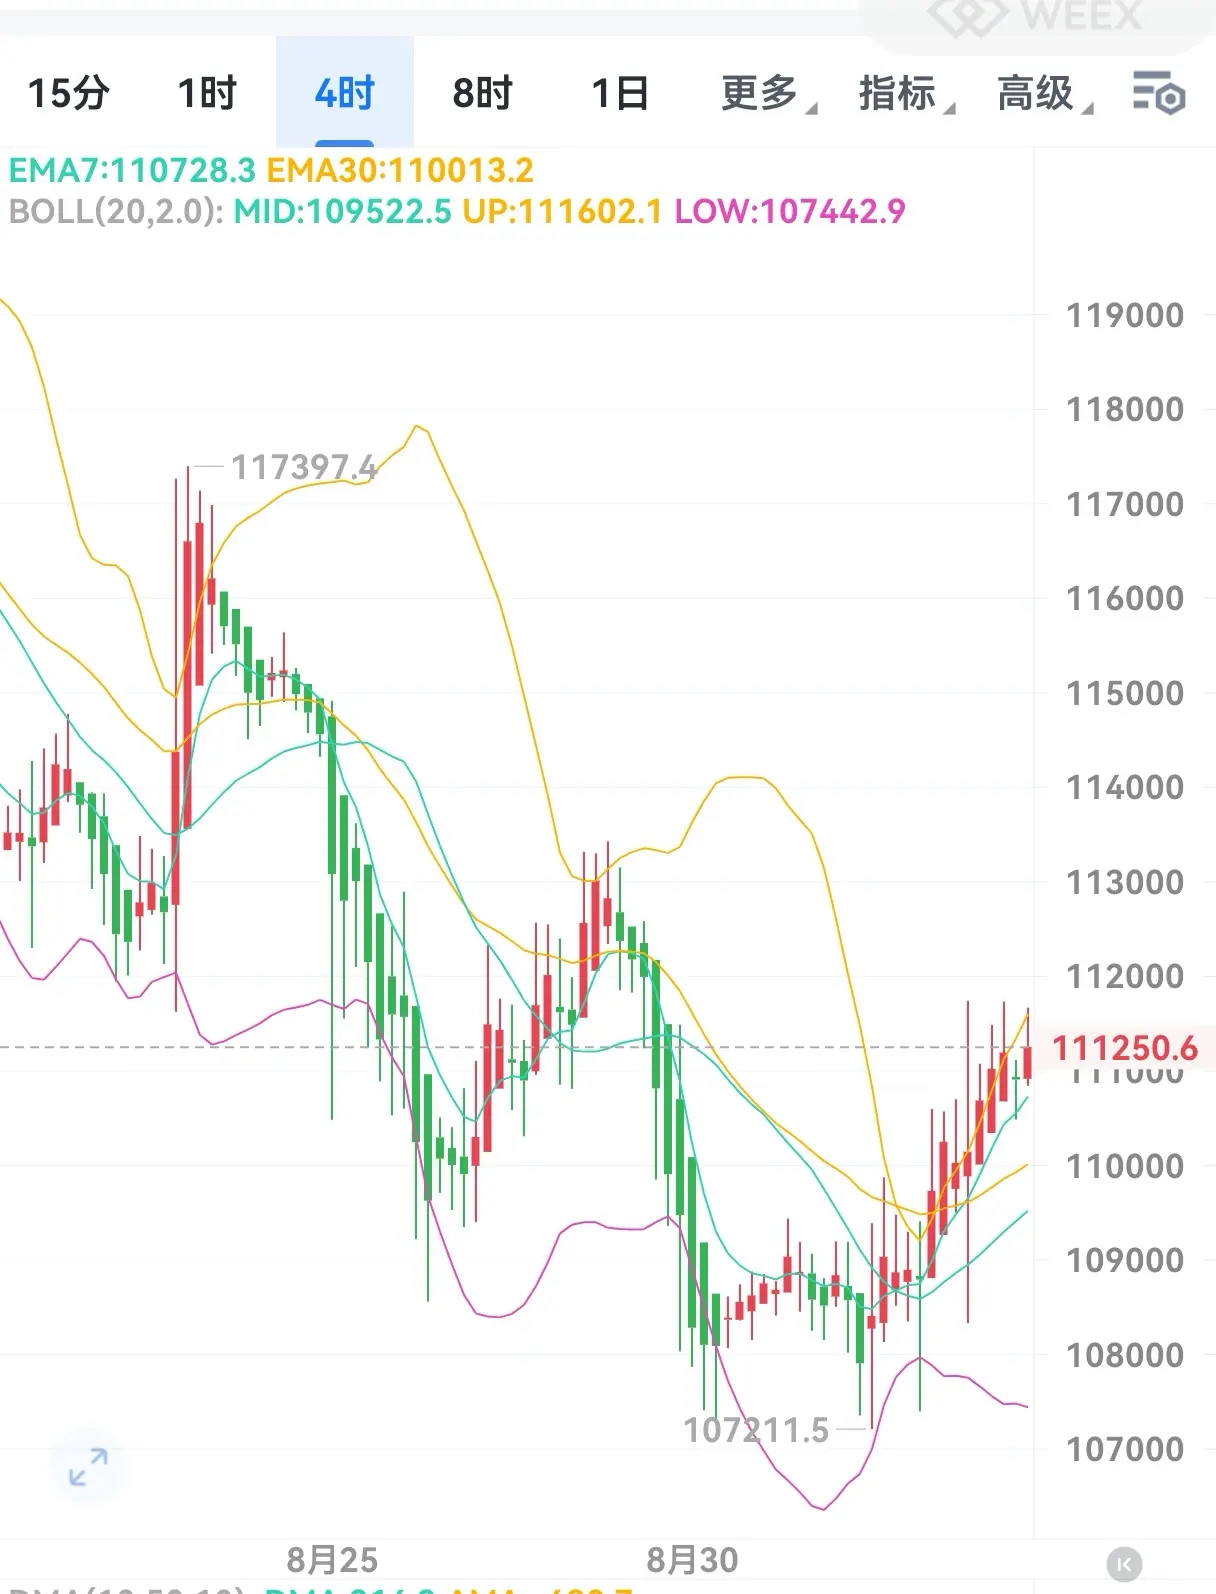
9.3 Wednesday Afternoon BTC Operation Insights
From the 4-hour chart, the price has tested the 111000 resistance level multiple times but has failed to break through successfully, subsequently entering a sideways movement. At this time, in the MACD indicator, the DIF and DEA are gradually approaching the zero axis, and the red bars are continuously narrowing, indicating that market bullish momentum is weakening, and the adjustment signal is quite obvious.
Looking at the 1-hour level again, the market is showing a volatile pattern, with both bulls and bears in a stalemate. However, it is wo
View OriginalFrom the 4-hour chart, the price has tested the 111000 resistance level multiple times but has failed to break through successfully, subsequently entering a sideways movement. At this time, in the MACD indicator, the DIF and DEA are gradually approaching the zero axis, and the red bars are continuously narrowing, indicating that market bullish momentum is weakening, and the adjustment signal is quite obvious.
Looking at the 1-hour level again, the market is showing a volatile pattern, with both bulls and bears in a stalemate. However, it is wo
- Reward
- like
- Comment
- Repost
- Share
Ether market analysis on midday of the 9.3
At midday, the price of Ether suddenly dropped sharply around 4310, once falling to 4280, with a decline of nearly 20 points that was quite noticeable. Subsequently, the price quickly rebounded and is now fluctuating around 4314.
Recently, the Ether market has experienced frequent fluctuations. From a technical analysis perspective, there are significant differences between the bulls and bears. Although the bullish strength has increased, there is a prominent divergence between volume and price, with consecutive daily candlesticks closing bearish,
View OriginalAt midday, the price of Ether suddenly dropped sharply around 4310, once falling to 4280, with a decline of nearly 20 points that was quite noticeable. Subsequently, the price quickly rebounded and is now fluctuating around 4314.
Recently, the Ether market has experienced frequent fluctuations. From a technical analysis perspective, there are significant differences between the bulls and bears. Although the bullish strength has increased, there is a prominent divergence between volume and price, with consecutive daily candlesticks closing bearish,
- Reward
- 2
- 2
- Repost
- Share
ALongStrategyTheory:
Quick, enter a position!🚗View More