


SOL Morning Analysis:
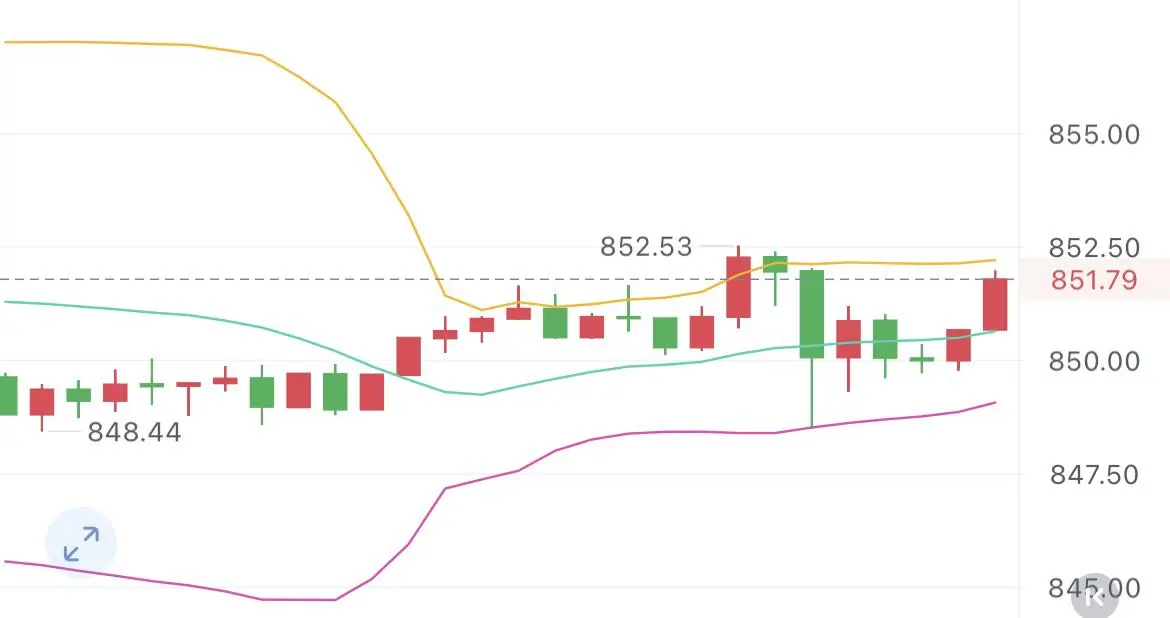
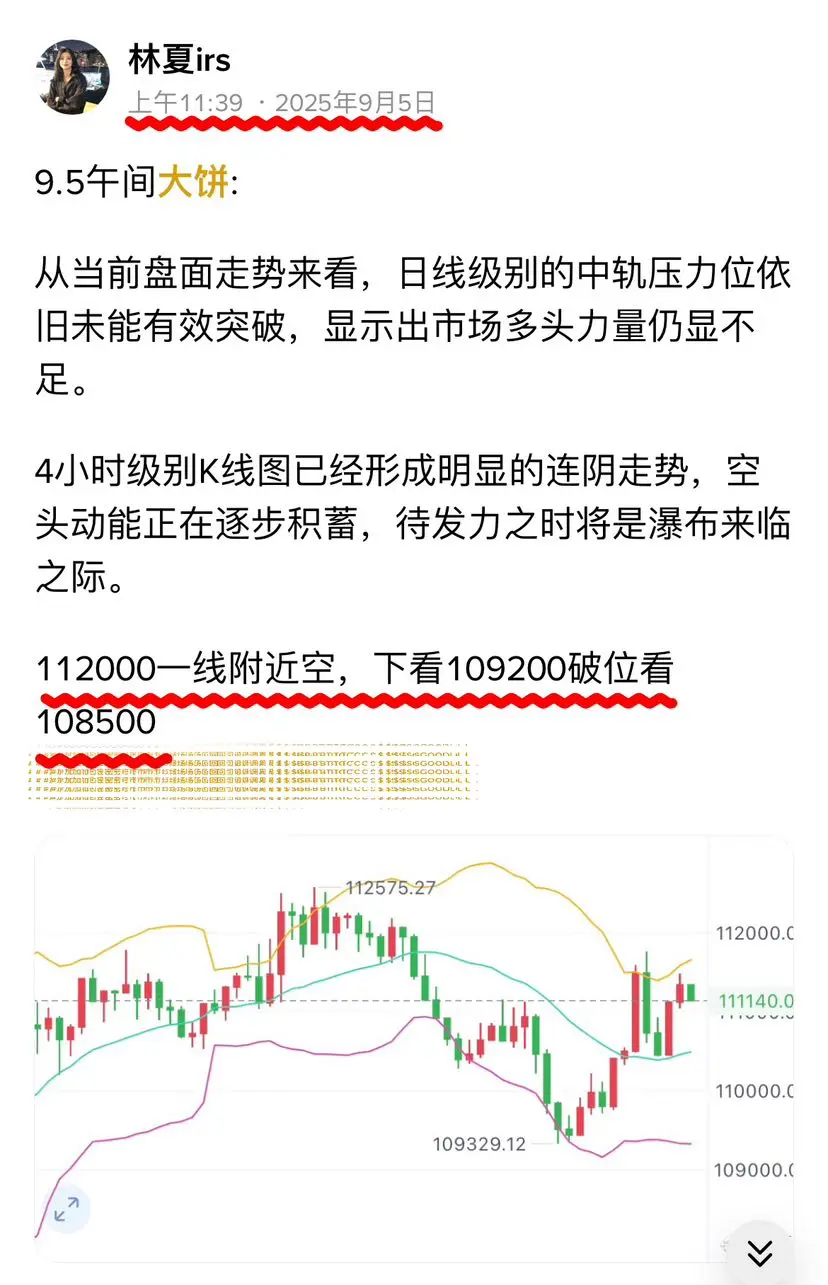
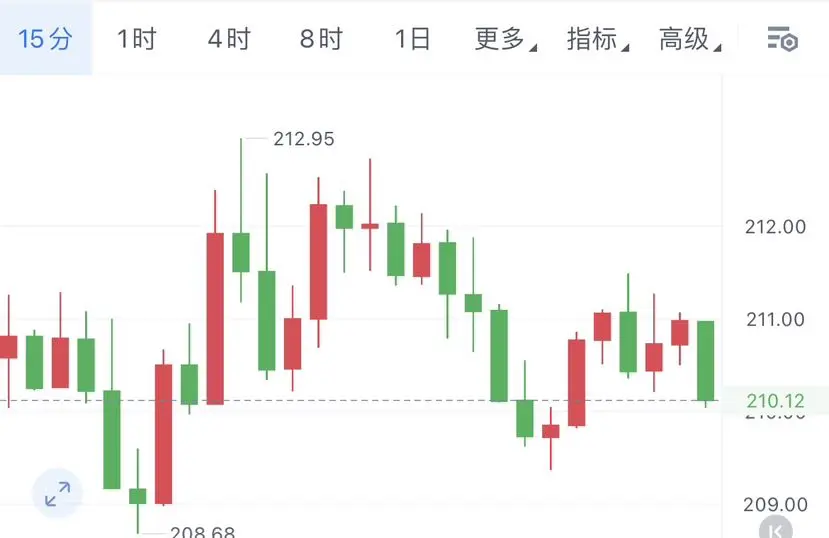
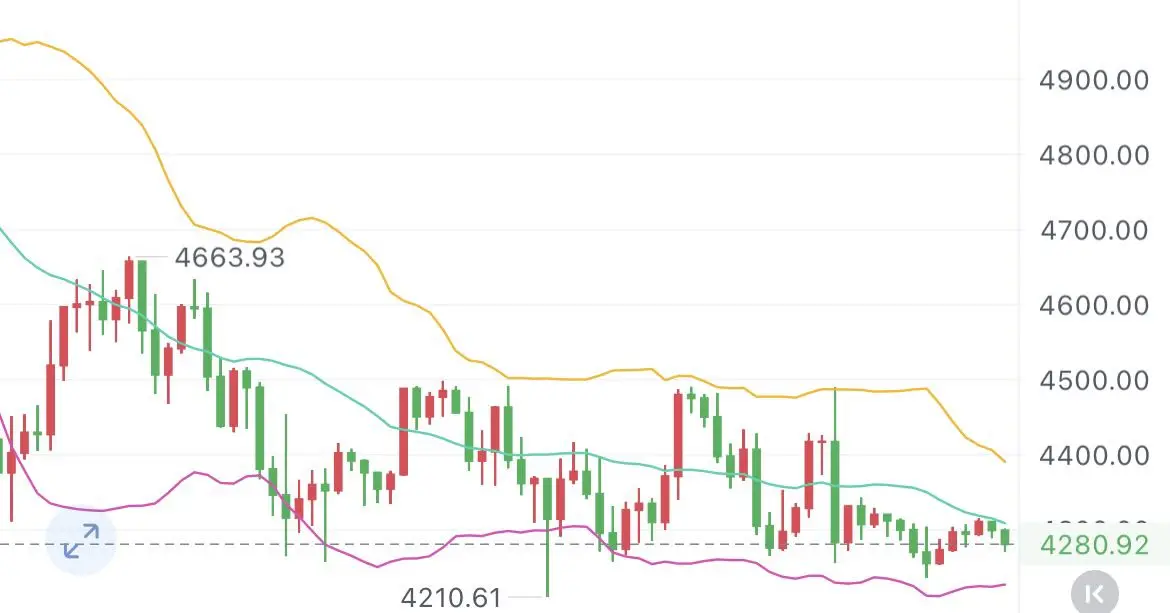
Short-term trend: On the 4-hour chart, the price is oscillating below the middle band of the Bollinger Bands, with trading volume decreasing during the upward movement. Although the MACD histogram is positive, it is gradually getting shorter.
Short around 207 to 209, looking down to around 202 to 198.
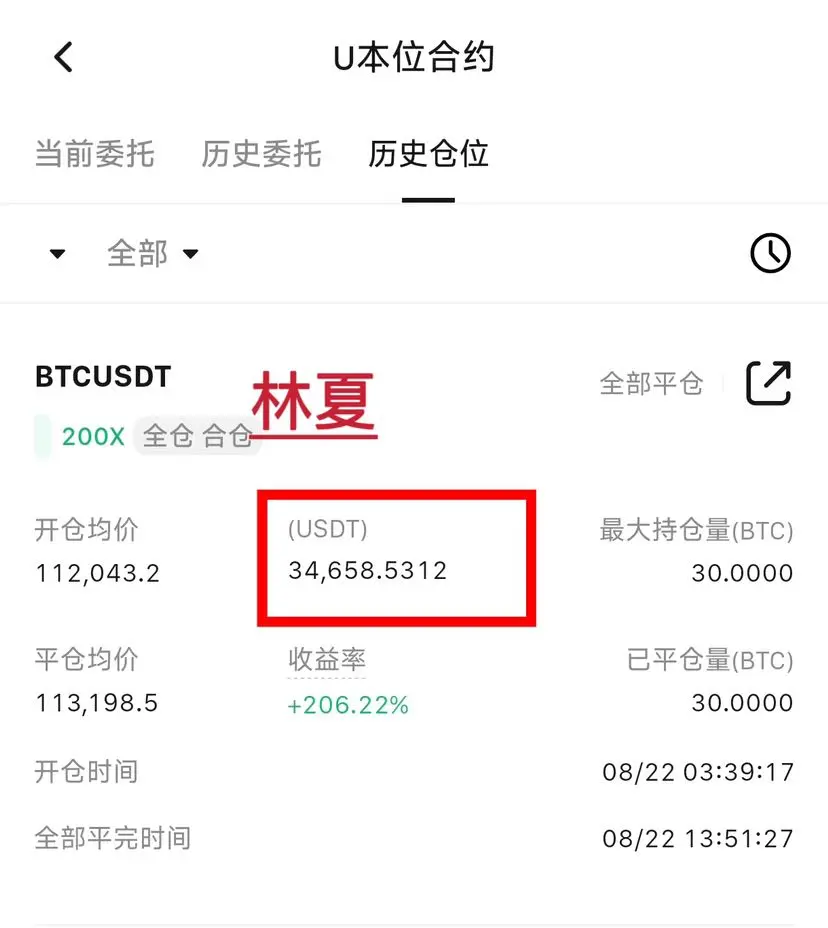
#Gate Alpha晒单挑战# #非农就业数据来袭#
View OriginalShort-term trend: On the 4-hour chart, the price is oscillating below the middle band of the Bollinger Bands, with trading volume decreasing during the upward movement. Although the MACD histogram is positive, it is gradually getting shorter.
Short around 207 to 209, looking down to around 202 to 198.
#Gate Alpha晒单挑战# #非农就业数据来袭#