Trade
Basic
Futures
Futures
Hundreds of contracts settled in USDT or BTC
TradFi
Gold
Trade global traditional assets with USDT in one place
Options
Hot
Trade European-style vanilla options
Unified Account
Maximize your capital efficiency
Demo Trading
Futures Kickoff
Get prepared for your futures trading
Futures Events
Participate in events to win generous rewards
Demo Trading
Use virtual funds to experience risk-free trading
Earn
Launch
CandyDrop
Collect candies to earn airdrops
Launchpool
Quick staking, earn potential new tokens
HODLer Airdrop
Hold GT and get massive airdrops for free
Launchpad
Be early to the next big token project
Alpha Points
New
Trade on-chain assets and enjoy airdrop rewards!
Futures Points
New
Earn futures points and claim airdrop rewards
Investment
Simple Earn
Earn interests with idle tokens
Auto-Invest
Auto-invest on a regular basis
Dual Investment
Buy low and sell high to take profits from price fluctuations
Soft Staking
Earn rewards with flexible staking
Crypto Loan
0 Fees
Pledge one crypto to borrow another
Lending Center
One-stop lending hub
VIP Wealth Hub
Customized wealth management empowers your assets growth
Private Wealth Management
Customized asset management to grow your digital assets
Quant Fund
Top asset management team helps you profit without hassle
Staking
Stake cryptos to earn in PoS products
Smart Leverage
New
No forced liquidation before maturity, worry-free leveraged gains
GUSD Minting
Use USDT/USDC to mint GUSD for treasury-level yields
More
- Reward
- 3
- 3
- Repost
- Share
Cryptoluck :
:
Happy New Year! 🤑View More
- Reward
- like
- Comment
- Repost
- Share
芝麻传奇
芝麻传奇之路
Created By@gatefunuser_e111
Listing Progress
100.00%
MC:
$2.75K
Create My Token
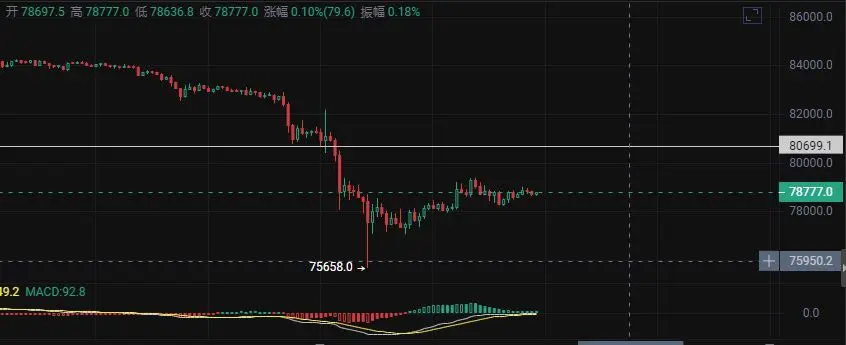
The current strong resistance level above BTC should be around 80,700, near the points of the last two dips. Once the funds rebound to this area, if there isn't much upward momentum, it is advisable to short.

Waiting for the funds to pull back to this zone, and if the upward strength is weak, consider shorting.
The previous two dips occurred around this level, and monitoring the market for a rebound can help determine the next move.
Stay cautious and watch for signs of a reversal before making trading decisions.
BTC-5,79%
- Reward
- 1
- Comment
- Repost
- Share
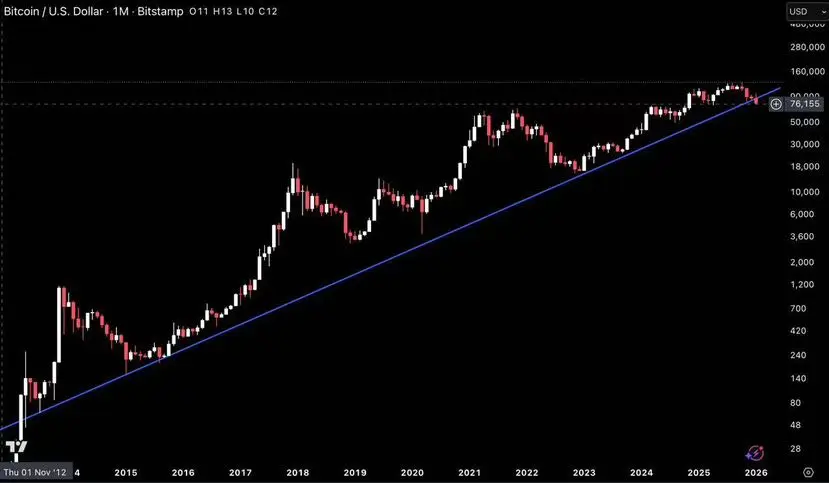
#BTC Bitcoin Technical Analysis:
From the chart, we can clearly see that the monthly candlestick chart has now closed below the long-term upward trend line, confirming a structural breakdown.
Bitcoin closed at approximately $76,000, breaking below the trend line that has supported it for over ten years. The current price has fallen about 20% from the recent high. This is no longer just a candlestick pattern or intraday deviation. The closing price confirms the loss of long-term momentum.
From the current position, the probability of continued decline is greater than an upward trend! The downtr
BTC-5,79%
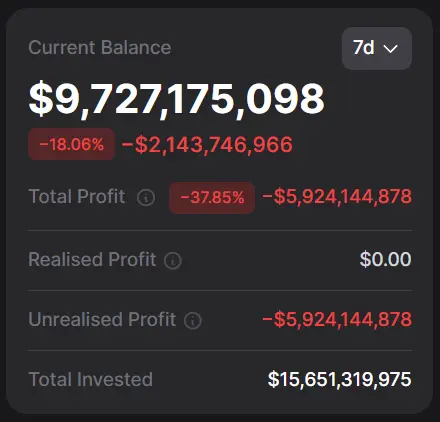
[The user has shared his/her trading data. Go to the App to view more.]
- Reward
- like
- Comment
- Repost
- Share
XAU ~$4,890 (-9%+), XAG ~$85 (-27%+) correction deepens post-parabolic rally unwind. USD strength + profit-taking dominate; Budget 2026 adds local pressure. Gold ops view: volatility = opportunity in timeless safe-haven stacks. Physical/tokenized utility shines through noise. Hold conviction.
Dont forget support our token PNDS
#A59 #PNDS #MyWeekendTradingPlan #PreciousMetalsPullBack #USGovernmentShutdownRisk
Dont forget support our token PNDS
#A59 #PNDS #MyWeekendTradingPlan #PreciousMetalsPullBack #USGovernmentShutdownRisk


MC:$3.79KHolders:3
0.60%
- Reward
- like
- Comment
- Repost
- Share
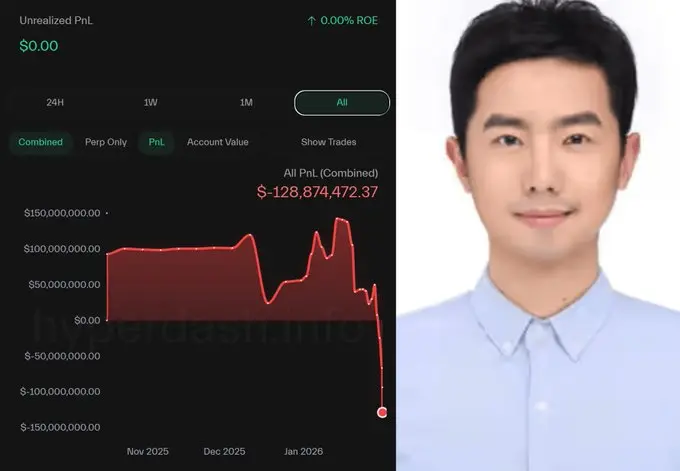
BREAKING
TRUMP’S INSIDER, GARRET JIN, WITH A 100% WIN RATE, WHO LONGED THE MARKET FOR $900 MILLION, JUST GOT FULLY LIQUIDATED.
IN OCTOBER, HE MADE $100 MILLION WITH ONE SHORT IN 3 HOURS.
THIS TIME, HE WENT ALL IN - AND GOT LIQUIDATED.
CRYPTO IS A WILD SPACE
#CryptoMarketPullback
TRUMP’S INSIDER, GARRET JIN, WITH A 100% WIN RATE, WHO LONGED THE MARKET FOR $900 MILLION, JUST GOT FULLY LIQUIDATED.
IN OCTOBER, HE MADE $100 MILLION WITH ONE SHORT IN 3 HOURS.
THIS TIME, HE WENT ALL IN - AND GOT LIQUIDATED.
CRYPTO IS A WILD SPACE
#CryptoMarketPullback
TRUMP-4,87%
- Reward
- 1
- Comment
- Repost
- Share
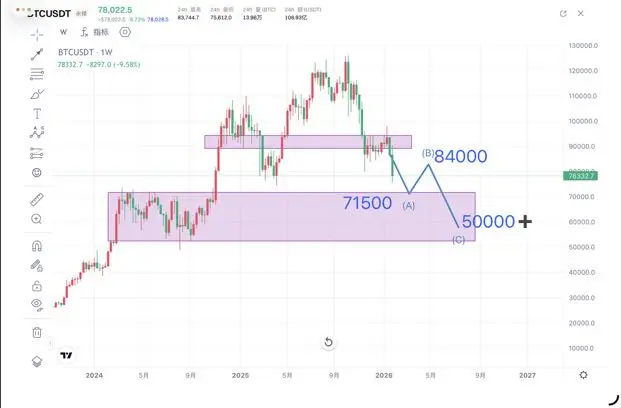
Bitcoin Weekly Chart Trend Forecast - Downtrend - Rebound - Deep Decline#加密市场回调
No need for unnecessary words, just look at the chart. The most probable trend in the coming months is to continue the bearish decline to around 71,000, then after overselling, start a rebound to around 84,000. After confirming weekly level resistance, a significant deep correction begins, with the bottom around 50,000.
No need for unnecessary words, just look at the chart. The most probable trend in the coming months is to continue the bearish decline to around 71,000, then after overselling, start a rebound to around 84,000. After confirming weekly level resistance, a significant deep correction begins, with the bottom around 50,000.
BTC-5,79%
- Reward
- like
- Comment
- Repost
- Share
Live Trading and Learning with Chillzzz
1
- Reward
- 1
- 1
- Repost
- Share
Cml1978 :
:
https://www.gate.com/nft/collection/21421/Boga https://www.gate.com/nft/collection/21418/Gate-logo-dragon
https://www.gate.com/nft/collection/21334/Zombi
https://www.gate.com/nft/collection/19167/GATE-NFT-BLUE
Happy SundayGm Believers. Just trust the process.

- Reward
- like
- Comment
- Repost
- Share
- Reward
- like
- Comment
- Repost
- Share
Are we gonna touch grass or continue crying in the casino

- Reward
- like
- Comment
- Repost
- Share
马跃前程
神马都给力
Created By@FortuñoRich
Listing Progress
0.00%
MC:
$2.92K
Create My Token
$I'm coming, I like this coin,,,,,,,,,, the dog whale is really excellent, short at 0.618 with stop loss being wiped out, long at 0.47777 with liquidation price chasing down and getting wrecked.
我踏马来了54,62%

- Reward
- 3
- 13
- Repost
- Share
CaiDi:
Keep buying the dip, keep going. Continue to bottom out and keep fighting.View More
Last night, MicroStrategy's $40 billion Bitcoin holdings evaporated entirely.
I opened Twitter, and industry sentiment hit rock bottom. Suddenly, I remembered that night in 2020.
At that time, I had already endured two years of bear market, almost exhausted all patience. ICO project teams exchanged the ETH they raised for luxury cars and mansions, and even mocked the crypto world for having no value. The hodlers became the laughingstock; believers held ETH for two years, only to see the price drop below $150.
Killing, arson, and gold belts, building bridges and repairing roads without corpses.
BTC-5,79%
- Reward
- like
- Comment
- Repost
- Share
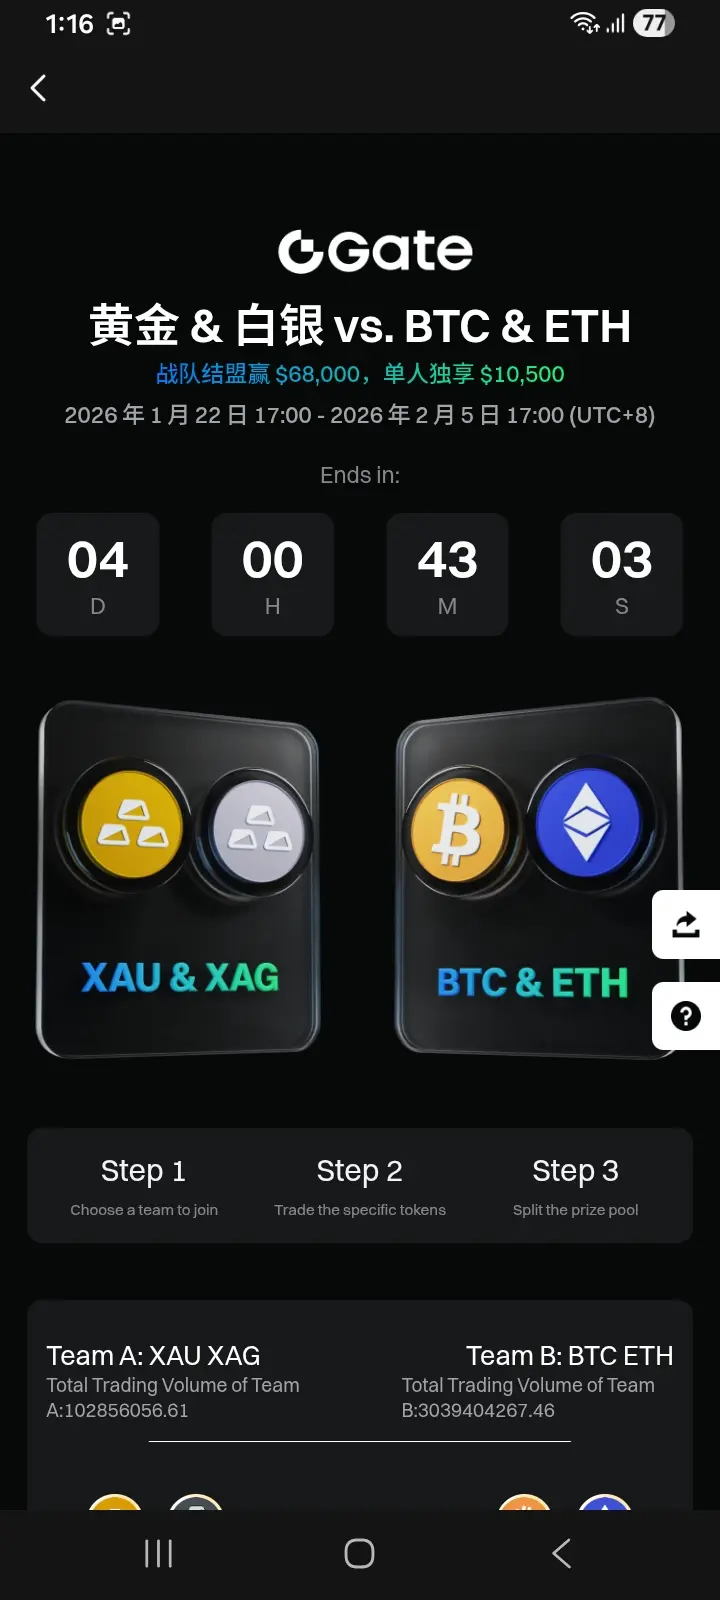
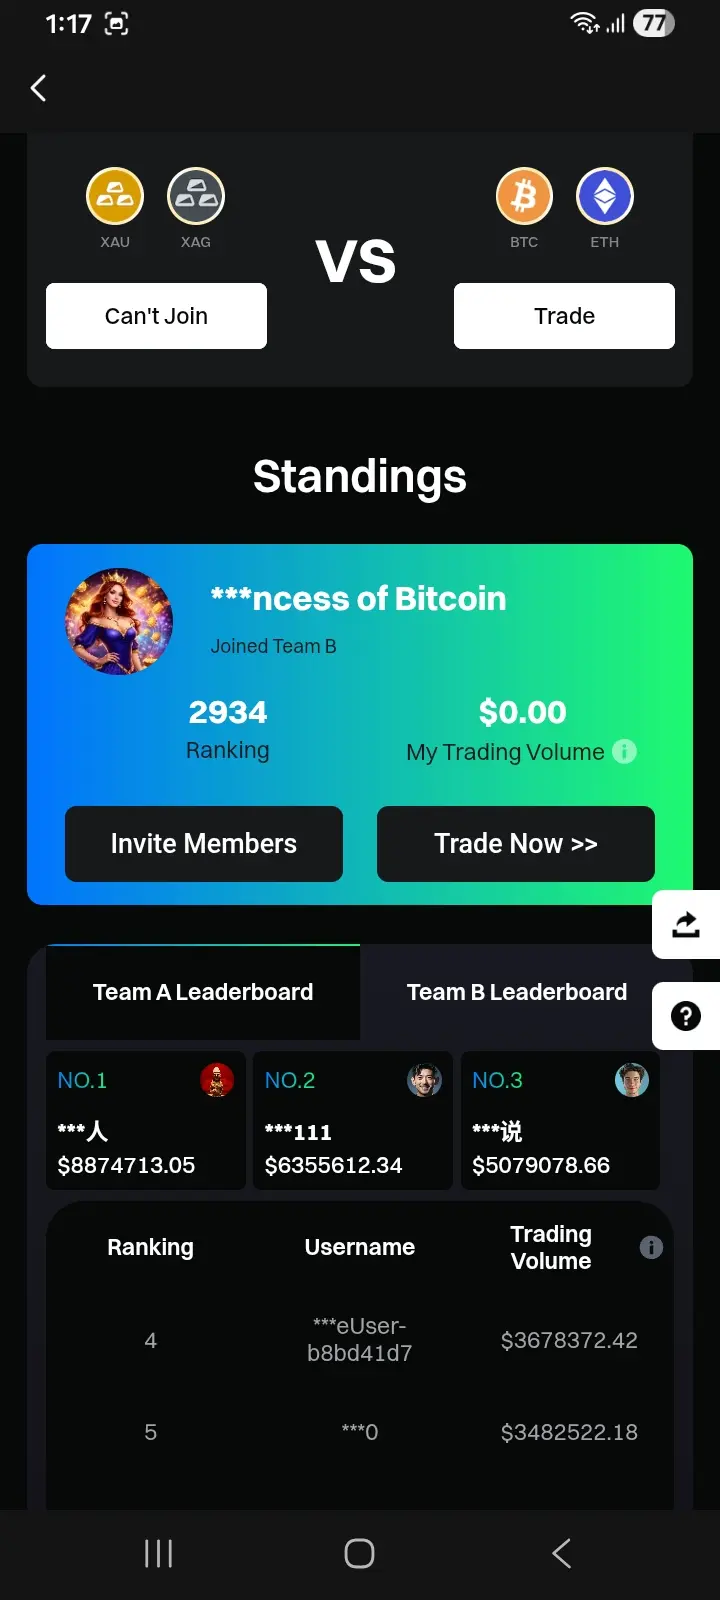
Crypto Team Battle
You've been invited to join & power up your team split mega rewards
Fight Now: https://www.gate.com/activities/crypto-team-battle/xau-vs-btc-perps-24/?invite=1&teamId=196&ch=teambattle&refUid=44126260
You've been invited to join & power up your team split mega rewards
Fight Now: https://www.gate.com/activities/crypto-team-battle/xau-vs-btc-perps-24/?invite=1&teamId=196&ch=teambattle&refUid=44126260

- Reward
- 1
- 1
- Repost
- Share
PrincessOfBitcoin :
:
Buy To Earn 💎Dragon Fly Official insight: SEC on tokenization — institutions, RWA, and sector focus 🏛️💎
The SEC’s clarification — that tokenizing assets doesn’t exempt them from securities regulations — sends a strong signal to the market: regulatory compliance remains non-negotiable, but tokenization itself can coexist with institutional frameworks.
🔍 Market & Structural Analysis
Institutional readiness: By confirming rules, the SEC reduces regulatory ambiguity, making RWA (Real-World Asset) tokenization more palatable for banks, asset managers, and insurers. Institutions can now design digital offerin
RWA-9,49%


- Reward
- 1
- 1
- Repost
- Share
DragonFlyOfficial:
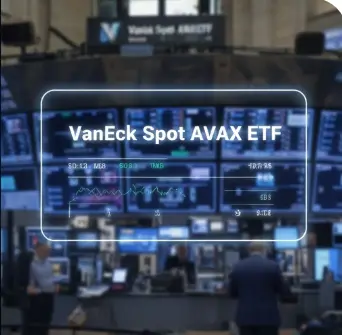
Which sectors do you think will see the fastest tokenized RWA adoption under SEC guidance — real estate, debt, or commodities? And how would you position?Dragon Fly Official insight: VanEck U.S. Spot AVAX ETF — institutional gateway or hype play? 🚀🦾
VanEck’s launch of the first U.S. spot AVAX ETF marks a structural milestone. By providing direct exposure plus staking rewards, it bridges traditional finance with Avalanche’s ecosystem in a compliant, institution-friendly format.
🔍 Market & Structural Analysis
Institutional access: Previously, institutions had limited avenues for direct AVAX exposure. Spot ETFs reduce custody friction and regulatory hurdles, enabling larger capital inflows.
Staking incentives: Layering staking rewards on a spot


- Reward
- 1
- 1
- Repost
- Share
DragonFlyOfficial:
Do you see the VanEck AVAX ETF as a game-changer for institutional adoption, or will retail and market hype dominate the near-term trend? How are you positioning?Fear Index Drops to 14 — Extreme Fear Zone: Bottom Signal or More Pain Ahead?
0
- Reward
- 1
- 1
- Repost
- Share
HighAmbition:
1000x VIbes 🤑
- Reward
- like
- Comment
- Repost
- Share
BTC ~$78K-$79K today—deeper dip amid volatility. Gold & Silver correcting sharply.
Like koi gliding through turbulent waters, value endures with patience & strong roots.
MKI: long-term, transparent blockchain—no hype.
Stay patient, family.
#MKI #A59 #MyWeekendTradingPlan #USGovernmentShutdownRisk #PreciousMetalsPullBack
Like koi gliding through turbulent waters, value endures with patience & strong roots.
MKI: long-term, transparent blockchain—no hype.
Stay patient, family.
#MKI #A59 #MyWeekendTradingPlan #USGovernmentShutdownRisk #PreciousMetalsPullBack
BTC-5,79%


MC:$3.58KHolders:42
0.02%
- Reward
- like
- Comment
- Repost
- Share
Load More
Join 40M users in our growing community
⚡️ Join 40M users in the crypto craze discussion
💬 Engage with your favorite top creators
👍 See what interests you
Trending Topics
View More24.58K Popularity
62.04K Popularity
367.22K Popularity
45.65K Popularity
61.44K Popularity
Hot Gate Fun
View More- MC:$2.91KHolders:10.00%
- MC:$2.91KHolders:10.00%
- MC:$2.9KHolders:10.00%
- MC:$2.92KHolders:10.00%
- MC:$2.9KHolders:10.00%
News
View MoreHyperliquid's largest Ethereum long positions have been liquidated one after another, with total losses approaching $284 million.
25 m
Data: 399.9 BTC transferred from an anonymous address, routed through intermediaries, and finally flowed into Cobo.com.
39 m
Trend Research Deposits 10,000 ETH to CEX After Accumulating 651,310 ETH
44 m
BULLA(BULLA) Perpetual contracts are now live in the Meme Zone of the Gate Contract, supporting leverage trading from 1x up to 20x.
45 m
ETH drops below 2400 USDT
1 h
Pin