Kaff
► RWA Perps - 次の流動性戦争
トークン化されたT-billやストックを取引するためだけに人生全体をdoxしたい人はいません。
トークン化されたスポットは、この初期段階では機関投資家向けです。私たちにとって本当の戦場は#RWA perpsです。ゲーム理論を理解すれば、それは非常に明白になります。
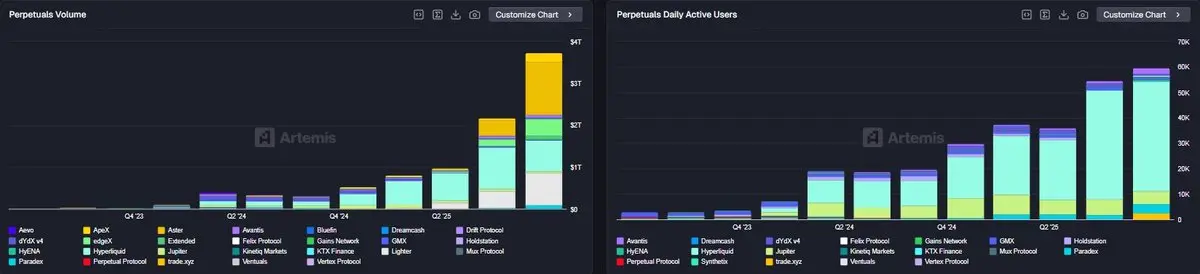
すでに暗号資産に勝利。暗号perpsは2025年に約86Tの取引量を記録し、多くのベニューではperpが活動の70~90%を占めています。
では、#TradFi資産をオンチェーンにもたらすなら(株式、指数、商品、FX、レート)、流動性がすでにperpで取引されているときに、遅く、制限されたボーマー的フォーマットにこだわるのはなぜでしょうか?
遅くてKYC重いトークンは忘れて、すべてをperpify化することが次の大規模な暗号メタです。
---
これはもはや「いつか」のテーゼではなくなります。
- 金属と指数の最初の波だけから、すでに1日あたり約10億ドルのRWA perp取引量を生成しています
- @tradexyzは数ヶ月で$3B から月額$31Bへと放物線を描きました
- @OstiumLabsは95%以上のOIをTradFiアセットに費やしています
- @GainsNetwork_ioのようなOGはすでにCFDモデルが数百のペアでぴったりとスケールすることを証明しました
原文表示トークン化されたT-billやストックを取引するためだけに人生全体をdoxしたい人はいません。
トークン化されたスポットは、この初期段階では機関投資家向けです。私たちにとって本当の戦場は#RWA perpsです。ゲーム理論を理解すれば、それは非常に明白になります。
すでに暗号資産に勝利。暗号perpsは2025年に約86Tの取引量を記録し、多くのベニューではperpが活動の70~90%を占めています。
では、#TradFi資産をオンチェーンにもたらすなら(株式、指数、商品、FX、レート)、流動性がすでにperpで取引されているときに、遅く、制限されたボーマー的フォーマットにこだわるのはなぜでしょうか?
遅くてKYC重いトークンは忘れて、すべてをperpify化することが次の大規模な暗号メタです。
---
これはもはや「いつか」のテーゼではなくなります。
- 金属と指数の最初の波だけから、すでに1日あたり約10億ドルのRWA perp取引量を生成しています
- @tradexyzは数ヶ月で$3B から月額$31Bへと放物線を描きました
- @OstiumLabsは95%以上のOIをTradFiアセットに費やしています
- @GainsNetwork_ioのようなOGはすでにCFDモデルが数百のペアでぴったりとスケールすることを証明しました
- 報酬
- いいね
- コメント
- リポスト
- 共有
- 報酬
- 1
- コメント
- リポスト
- 共有
1308
demoa
作成者@NoToExploitation
上場の進行状況
0.00%
時価総額:
$2.52K
より多くのトークン
ドナルド・トランプのランチイベントがTRUMPブランドの需要をどのように高めたか
今日の高度に相互接続された世界では、著名人は市場、消費者行動、ブランド認識に多大な影響力を行使しています。ドナルド・トランプが広く報道されるランチや高プロフィールの集まりを主催するとき、その波及効果は即座のイベント以上に広がります。
#TrumpLunchBoostsTRUMPDemand は、そのようなイベントによって生じる注目と活動の急増を捉え、セレブリティの存在、メディアの報道、社会的影響がどのようにTRUMPブランドの製品やサービスの需要に影響を与えるかを示しています。この投稿では、この現象を詳しく解説し、なぜ需要が急増するのか、それが何に影響し、またそれが消費者行動のより広いトレンドにどのように反映されるのかを説明します。
イベントトリガー:なぜ一つのランチが市場を動かすのか
著名人が関与する高プロフィールのイベントは、しばしばブランドの認知度を高める触媒となります。このケースでは、ドナルド・トランプのランチイベントは、政治的集会、メディアに好まれる募金活動、またはプライベートなVIPの集まりであったかに関わらず、重要なメディア報道を生み出しました。ニュースメディア、ソーシャルメディア、インフルエンサーのネットワークは、写真やゲストリスト、コメント、ハイライトなどの詳細を即座に拡散しまし
原文表示今日の高度に相互接続された世界では、著名人は市場、消費者行動、ブランド認識に多大な影響力を行使しています。ドナルド・トランプが広く報道されるランチや高プロフィールの集まりを主催するとき、その波及効果は即座のイベント以上に広がります。
#TrumpLunchBoostsTRUMPDemand は、そのようなイベントによって生じる注目と活動の急増を捉え、セレブリティの存在、メディアの報道、社会的影響がどのようにTRUMPブランドの製品やサービスの需要に影響を与えるかを示しています。この投稿では、この現象を詳しく解説し、なぜ需要が急増するのか、それが何に影響し、またそれが消費者行動のより広いトレンドにどのように反映されるのかを説明します。
イベントトリガー:なぜ一つのランチが市場を動かすのか
著名人が関与する高プロフィールのイベントは、しばしばブランドの認知度を高める触媒となります。このケースでは、ドナルド・トランプのランチイベントは、政治的集会、メディアに好まれる募金活動、またはプライベートなVIPの集まりであったかに関わらず、重要なメディア報道を生み出しました。ニュースメディア、ソーシャルメディア、インフルエンサーのネットワークは、写真やゲストリスト、コメント、ハイライトなどの詳細を即座に拡散しまし

- 報酬
- いいね
- コメント
- リポスト
- 共有
3.16ビットコイン昼間分析
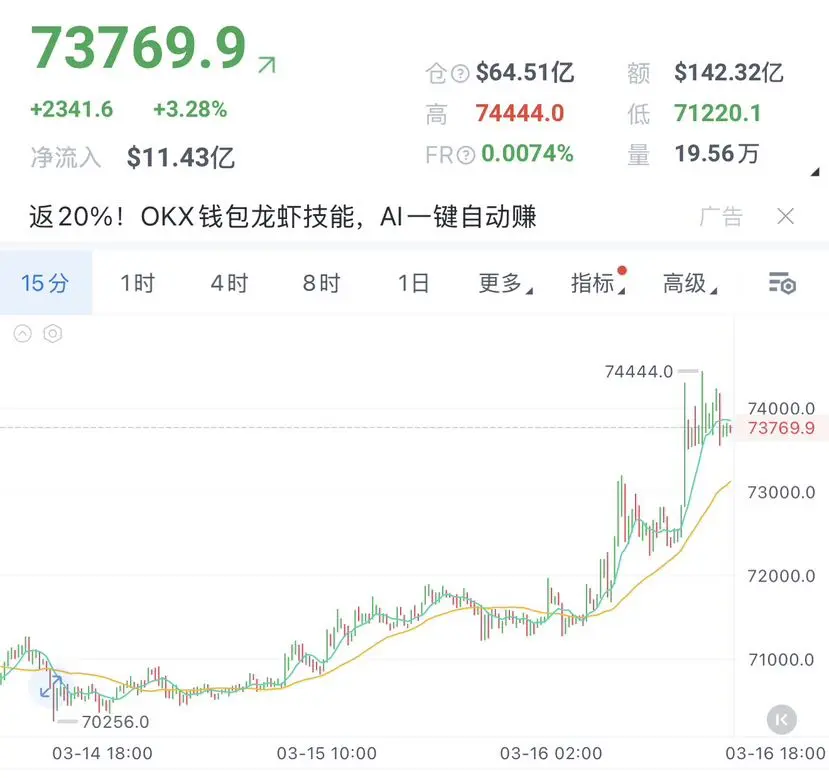
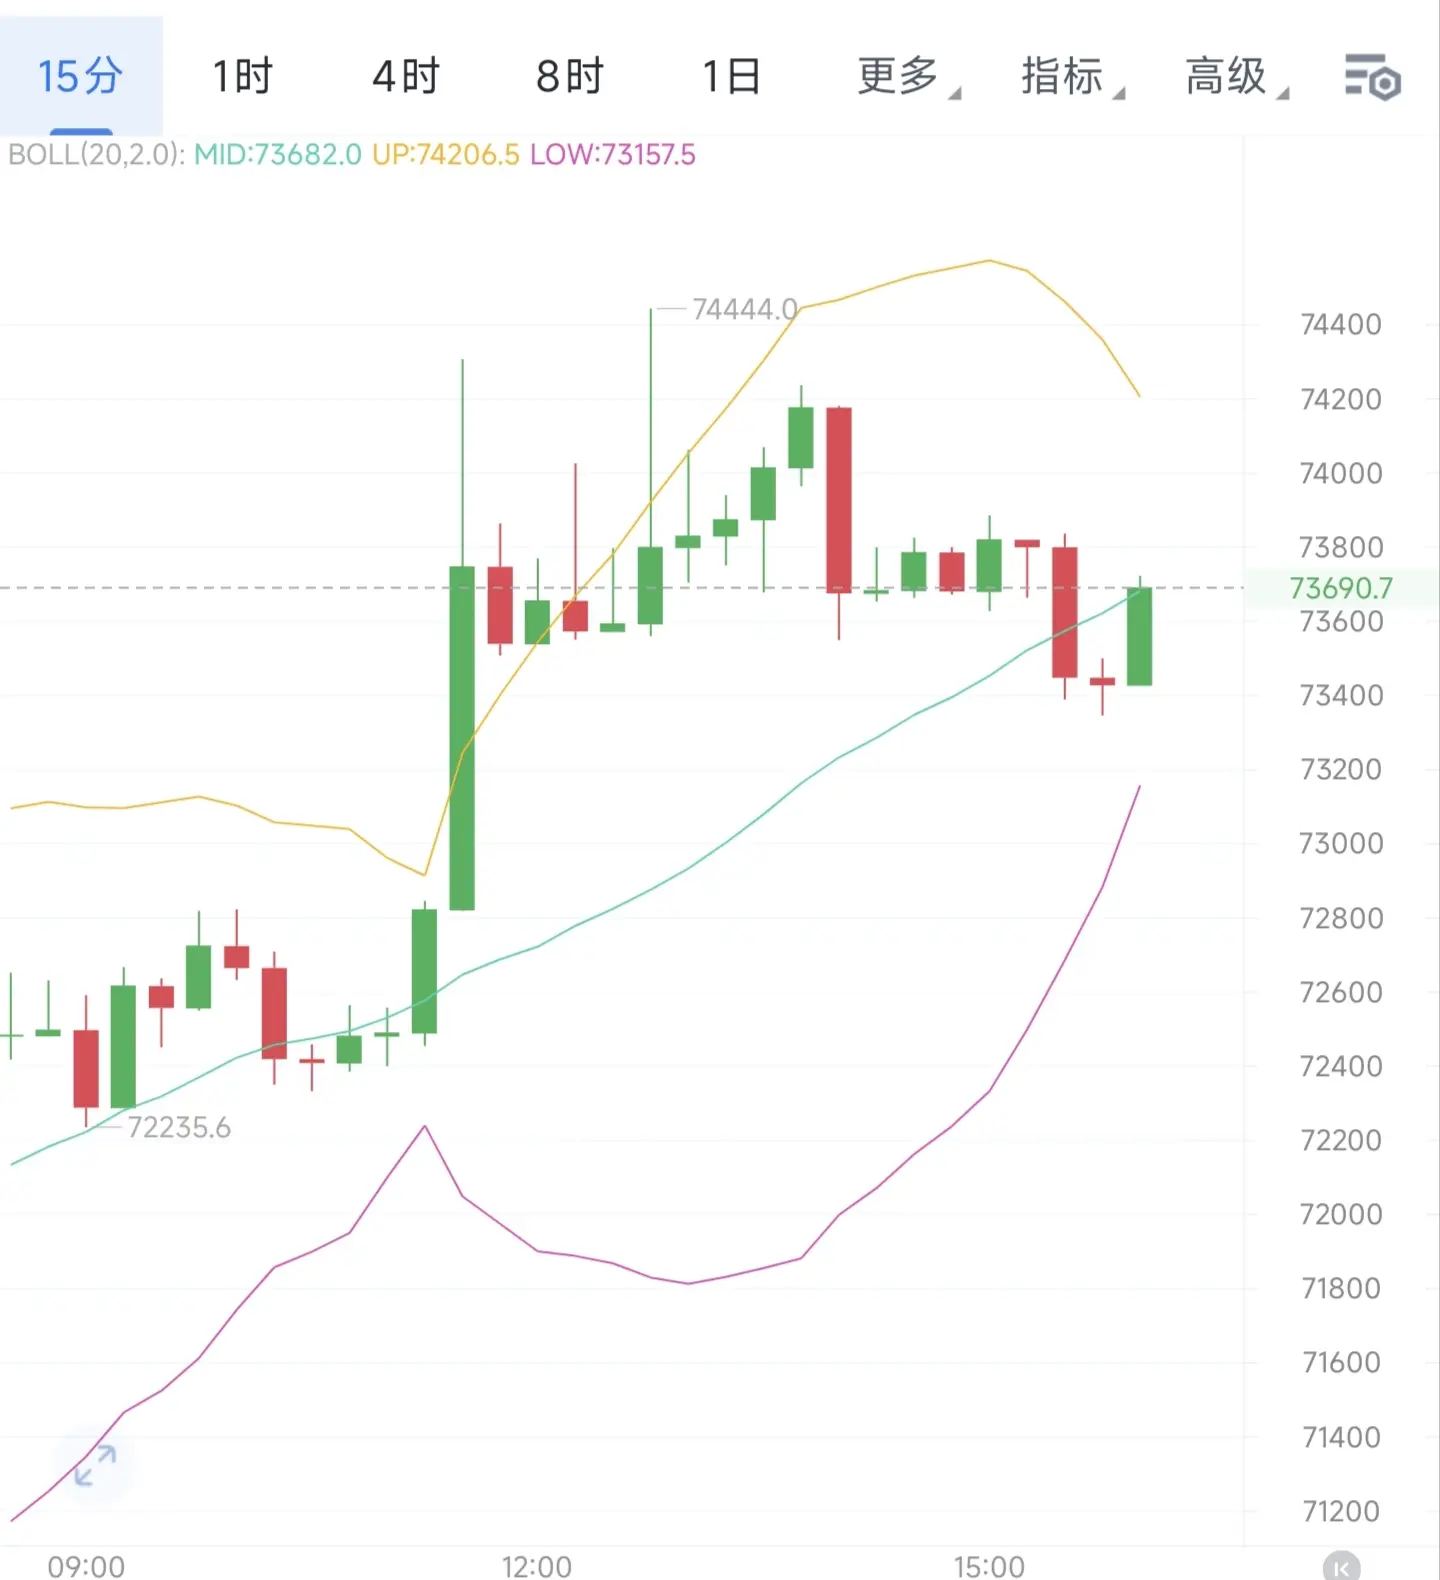
強気の買い圧力が続き、長い陰線のK線は短期的な利益確定のための調整に過ぎない。価格はボリンジャーバンドの中間線をサポートとして反発し、KDJは高値圏でデッドクロスを形成しながら急速に出来高を縮小、RSIは買われ過ぎゾーンから穏やかに下落しつつも、依然として強気の領域を維持している。移動平均線は良好な買いシグナルを示し、テクニカルな調整は次の上昇エネルギーを蓄えるためのものだ。
地政学的リスク回避の心理は段階的に和らいでいるが、デジタルゴールドの長期的な資産配分のロジックは依然として堅固であり、資金は短期の投機から長期の保有へと移行している。
米国株の早朝の下落による短期的なリスク選好の低下は一時的な資金の調整に過ぎず、暗号資産市場は高成長資産としての長期的な上昇トレンドを崩していない。FRB関係者が「利下げ延期」のシグナルを出すのは、いわば靴が落ちる前の調整であり、インフレデータが徐々に正常化していく中で、利下げ期待は最終的に復活し、ビットコインのさらなる上昇余地を広げるだろう。
短期的な好材料のきっかけは明確ではないが、半減期のナラティブは十分に織り込まれ、資金が沈殿した後にはより堅実な上昇基盤が形成される見込みだ。
操作の提案
72000-72500の範囲で押し目買いを行い、目標は74700-75700、損切りは71000以下に設定。
BTC3.08%
- 報酬
- いいね
- コメント
- リポスト
- 共有
暴騰に乗るな!大きなチャンスは全て「誰も見ていない」静寂の中に隠れている
市場が熱狂している時、価格は人を騙す。プロジェクトこそが根本だ。
多くの人がK線の上下を見つめ、値段の高い低いだけを問うが、プロジェクト自体の価値、チームの信頼性、実現可能性を見落としている。
相場が上がるほど、リスクはより深く隠される。フォロワーのように高値を追う人たちは、大抵が最後の一打を受ける。
真の大チャンスは、決して喧騒の群れの中にはなく、最も静寂で、最も注目されない段階の中にある。その時こそ、優良なプロジェクトが過小評価され、忍耐強く待つ人こそが、最大のリターンを手にするのだ。#btc $BTC $ETH
原文表示市場が熱狂している時、価格は人を騙す。プロジェクトこそが根本だ。
多くの人がK線の上下を見つめ、値段の高い低いだけを問うが、プロジェクト自体の価値、チームの信頼性、実現可能性を見落としている。
相場が上がるほど、リスクはより深く隠される。フォロワーのように高値を追う人たちは、大抵が最後の一打を受ける。
真の大チャンスは、決して喧騒の群れの中にはなく、最も静寂で、最も注目されない段階の中にある。その時こそ、優良なプロジェクトが過小評価され、忍耐強く待つ人こそが、最大のリターンを手にするのだ。#btc $BTC $ETH

- 報酬
- いいね
- コメント
- リポスト
- 共有
🔥 ビットコイン情況
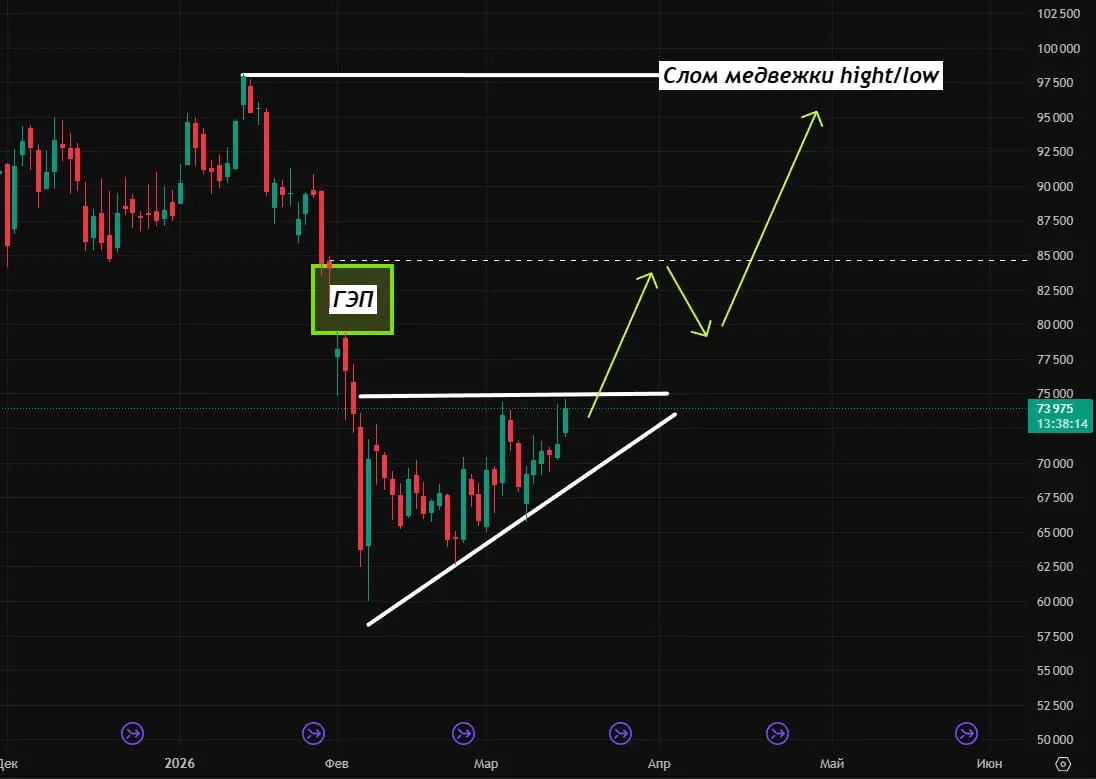
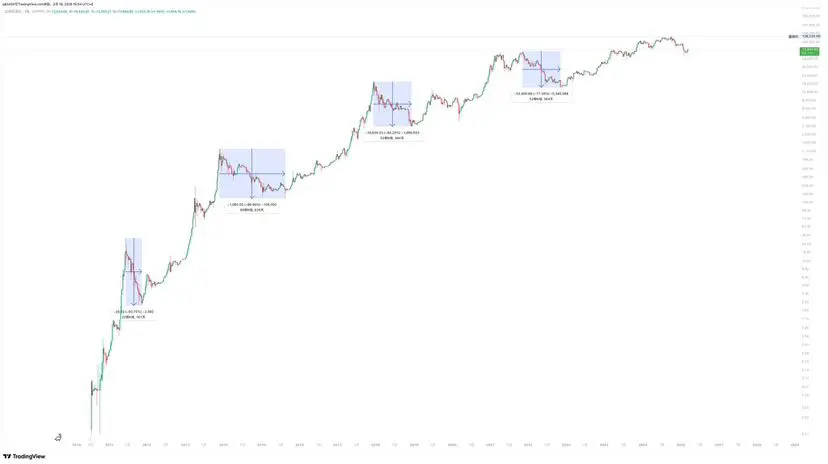
ビットコイン73,800ドル。74,500ドルの密度が薄れつつあり、どんどん細くなってきており、74,500ドル付近の集中度が高く、強い売却ではなく、そこから多くがショートをしているという事実は1つの事を物語っている。74,500ドル上方へのブレイクアウトと確定の可能性がある(フィボナッチ0.382レベル)、下落構造を壊すレベル(2022年のようにだ)。
ここ最近の全ての動画で述べてきたが、74,500ドル上方での確定が起きれば、弱気派は苦しくなるだろう。なぜなら、その先85,000ドルまで抵抗がはじめてないからだ。
80,000ドルから84,500ドルの間に当時CMEギャップがあったが、私たちはそれをローソク足で抜けた。スプレッドなしでだ。だから74,500ドル上方での確定は、84,500ドルと相当する。
その先はダンス・ウィズ・ア・シャーマン状態だ。なぜなら、さらに上方への動きは弱気派にとっ単純に大惨事であり、もう上方で下落構造の転換が起こる(弱気相場の終わり)。そして多くはまだ市場に入っていないか/ショートしている。
これについて多くの動画で警告してきた。70,000ドルでアルトコインを買った理由を述べていた。50,000ドルへの動きを受け入れ、耐え抜く準備ができている。これは市場に全く入っていなくて、どんな価格でも飛びつくより私にとって危険性が低い。
原文表示ビットコイン73,800ドル。74,500ドルの密度が薄れつつあり、どんどん細くなってきており、74,500ドル付近の集中度が高く、強い売却ではなく、そこから多くがショートをしているという事実は1つの事を物語っている。74,500ドル上方へのブレイクアウトと確定の可能性がある(フィボナッチ0.382レベル)、下落構造を壊すレベル(2022年のようにだ)。
ここ最近の全ての動画で述べてきたが、74,500ドル上方での確定が起きれば、弱気派は苦しくなるだろう。なぜなら、その先85,000ドルまで抵抗がはじめてないからだ。
80,000ドルから84,500ドルの間に当時CMEギャップがあったが、私たちはそれをローソク足で抜けた。スプレッドなしでだ。だから74,500ドル上方での確定は、84,500ドルと相当する。
その先はダンス・ウィズ・ア・シャーマン状態だ。なぜなら、さらに上方への動きは弱気派にとっ単純に大惨事であり、もう上方で下落構造の転換が起こる(弱気相場の終わり)。そして多くはまだ市場に入っていないか/ショートしている。
これについて多くの動画で警告してきた。70,000ドルでアルトコインを買った理由を述べていた。50,000ドルへの動きを受け入れ、耐え抜く準備ができている。これは市場に全く入っていなくて、どんな価格でも飛びつくより私にとって危険性が低い。
- 報酬
- いいね
- コメント
- リポスト
- 共有
- 報酬
- いいね
- コメント
- リポスト
- 共有
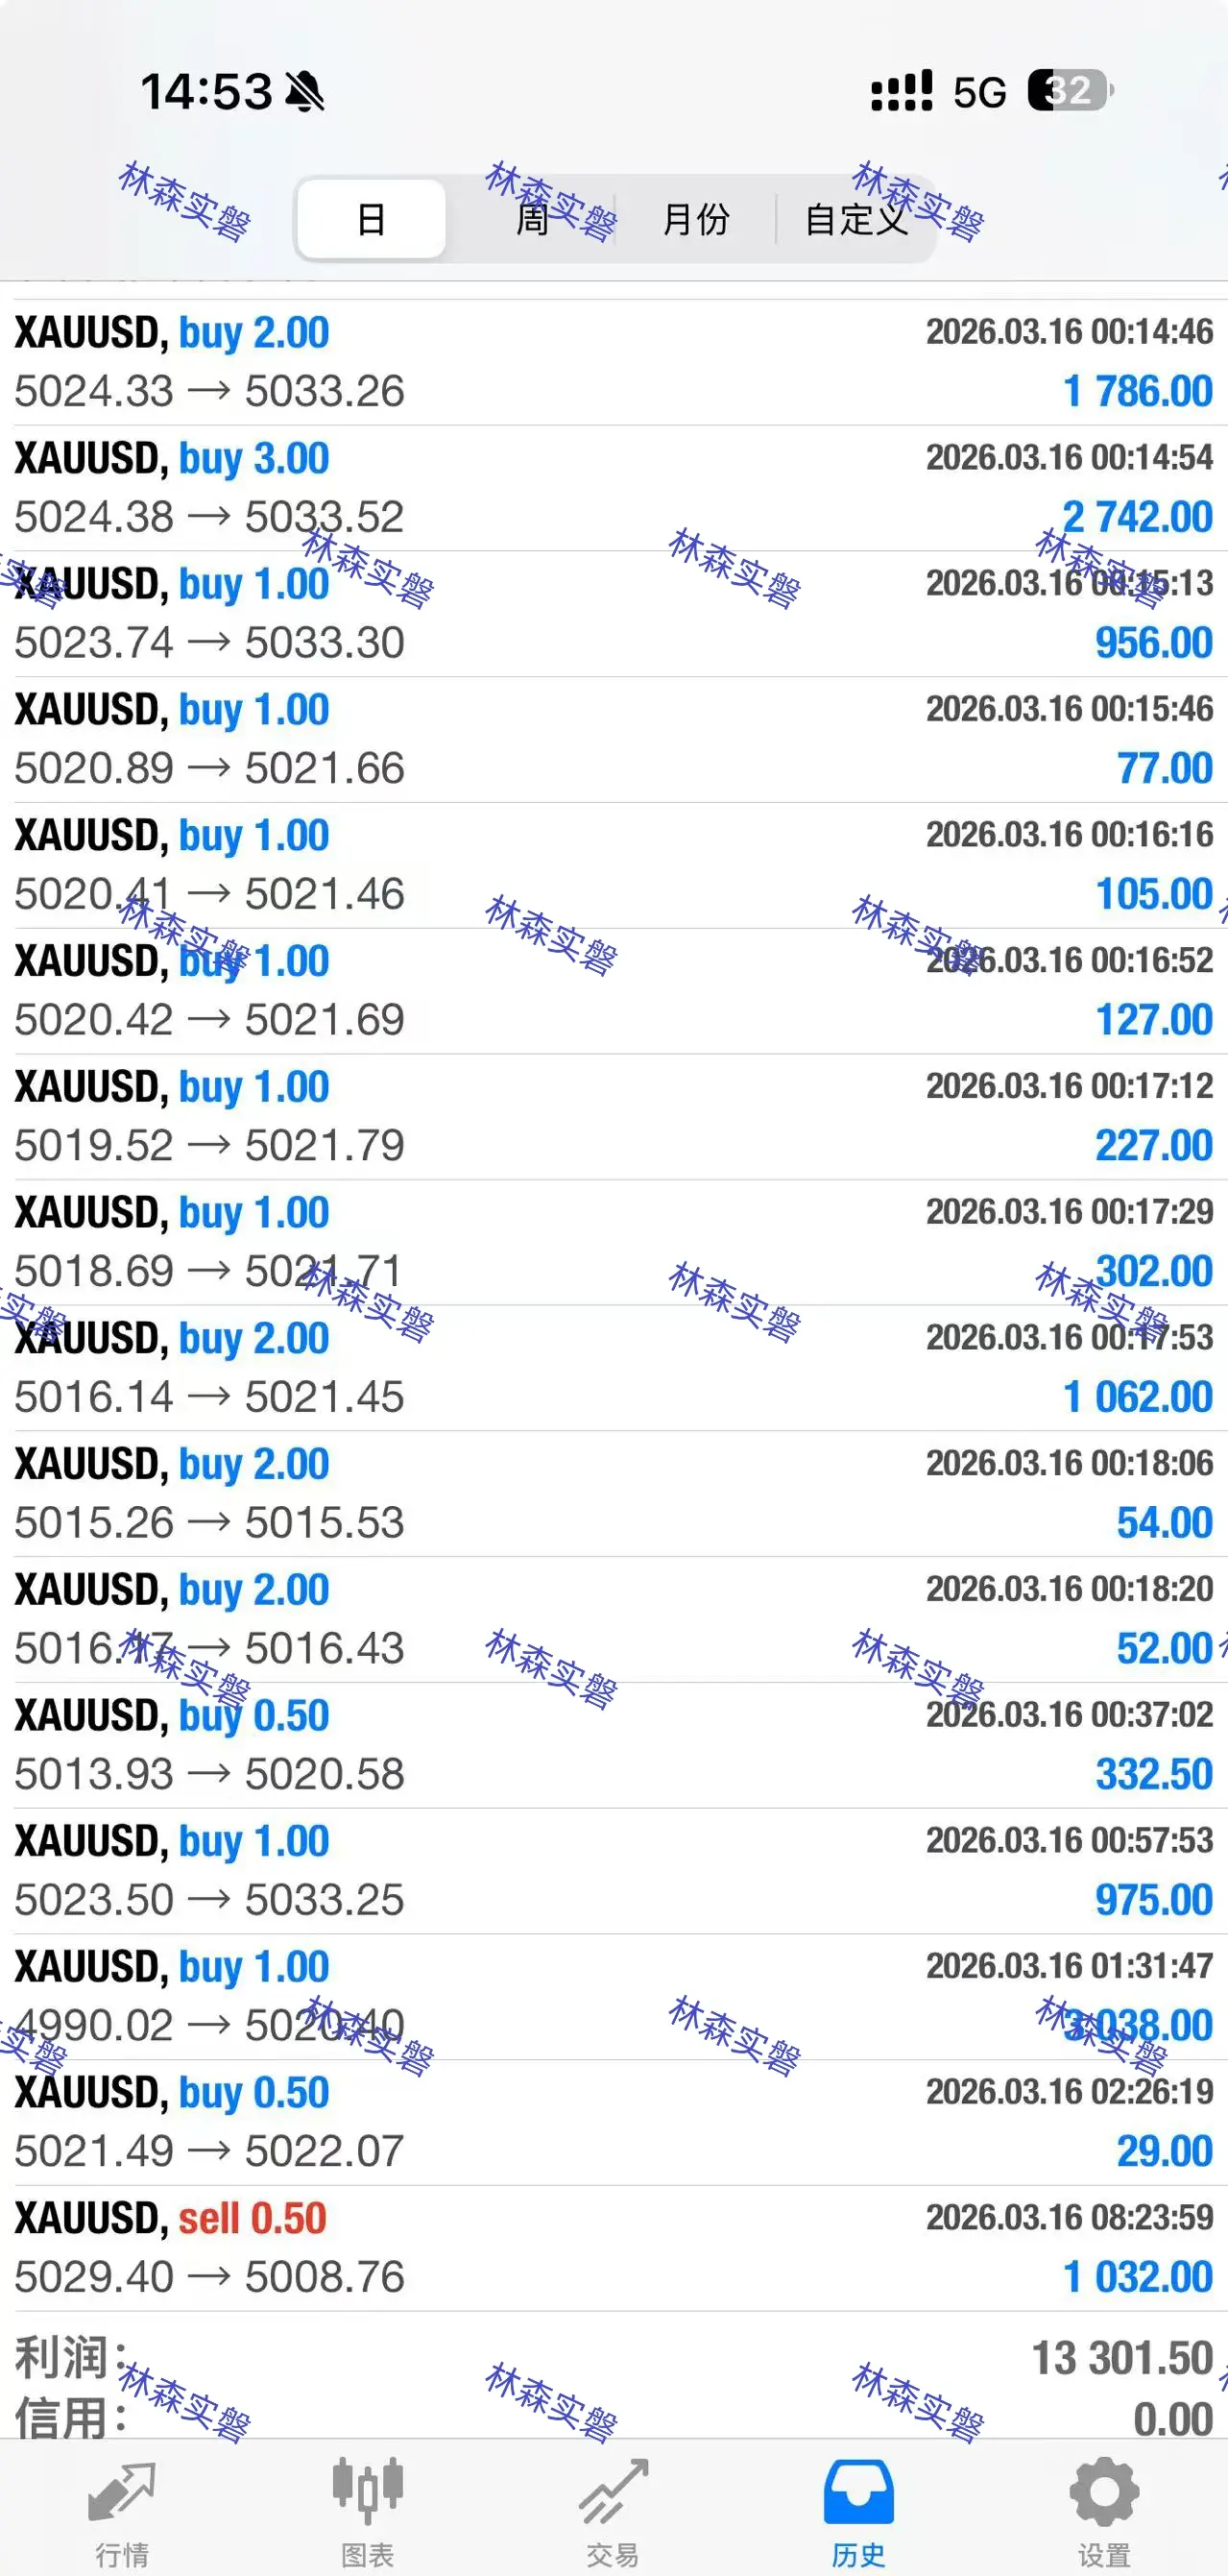
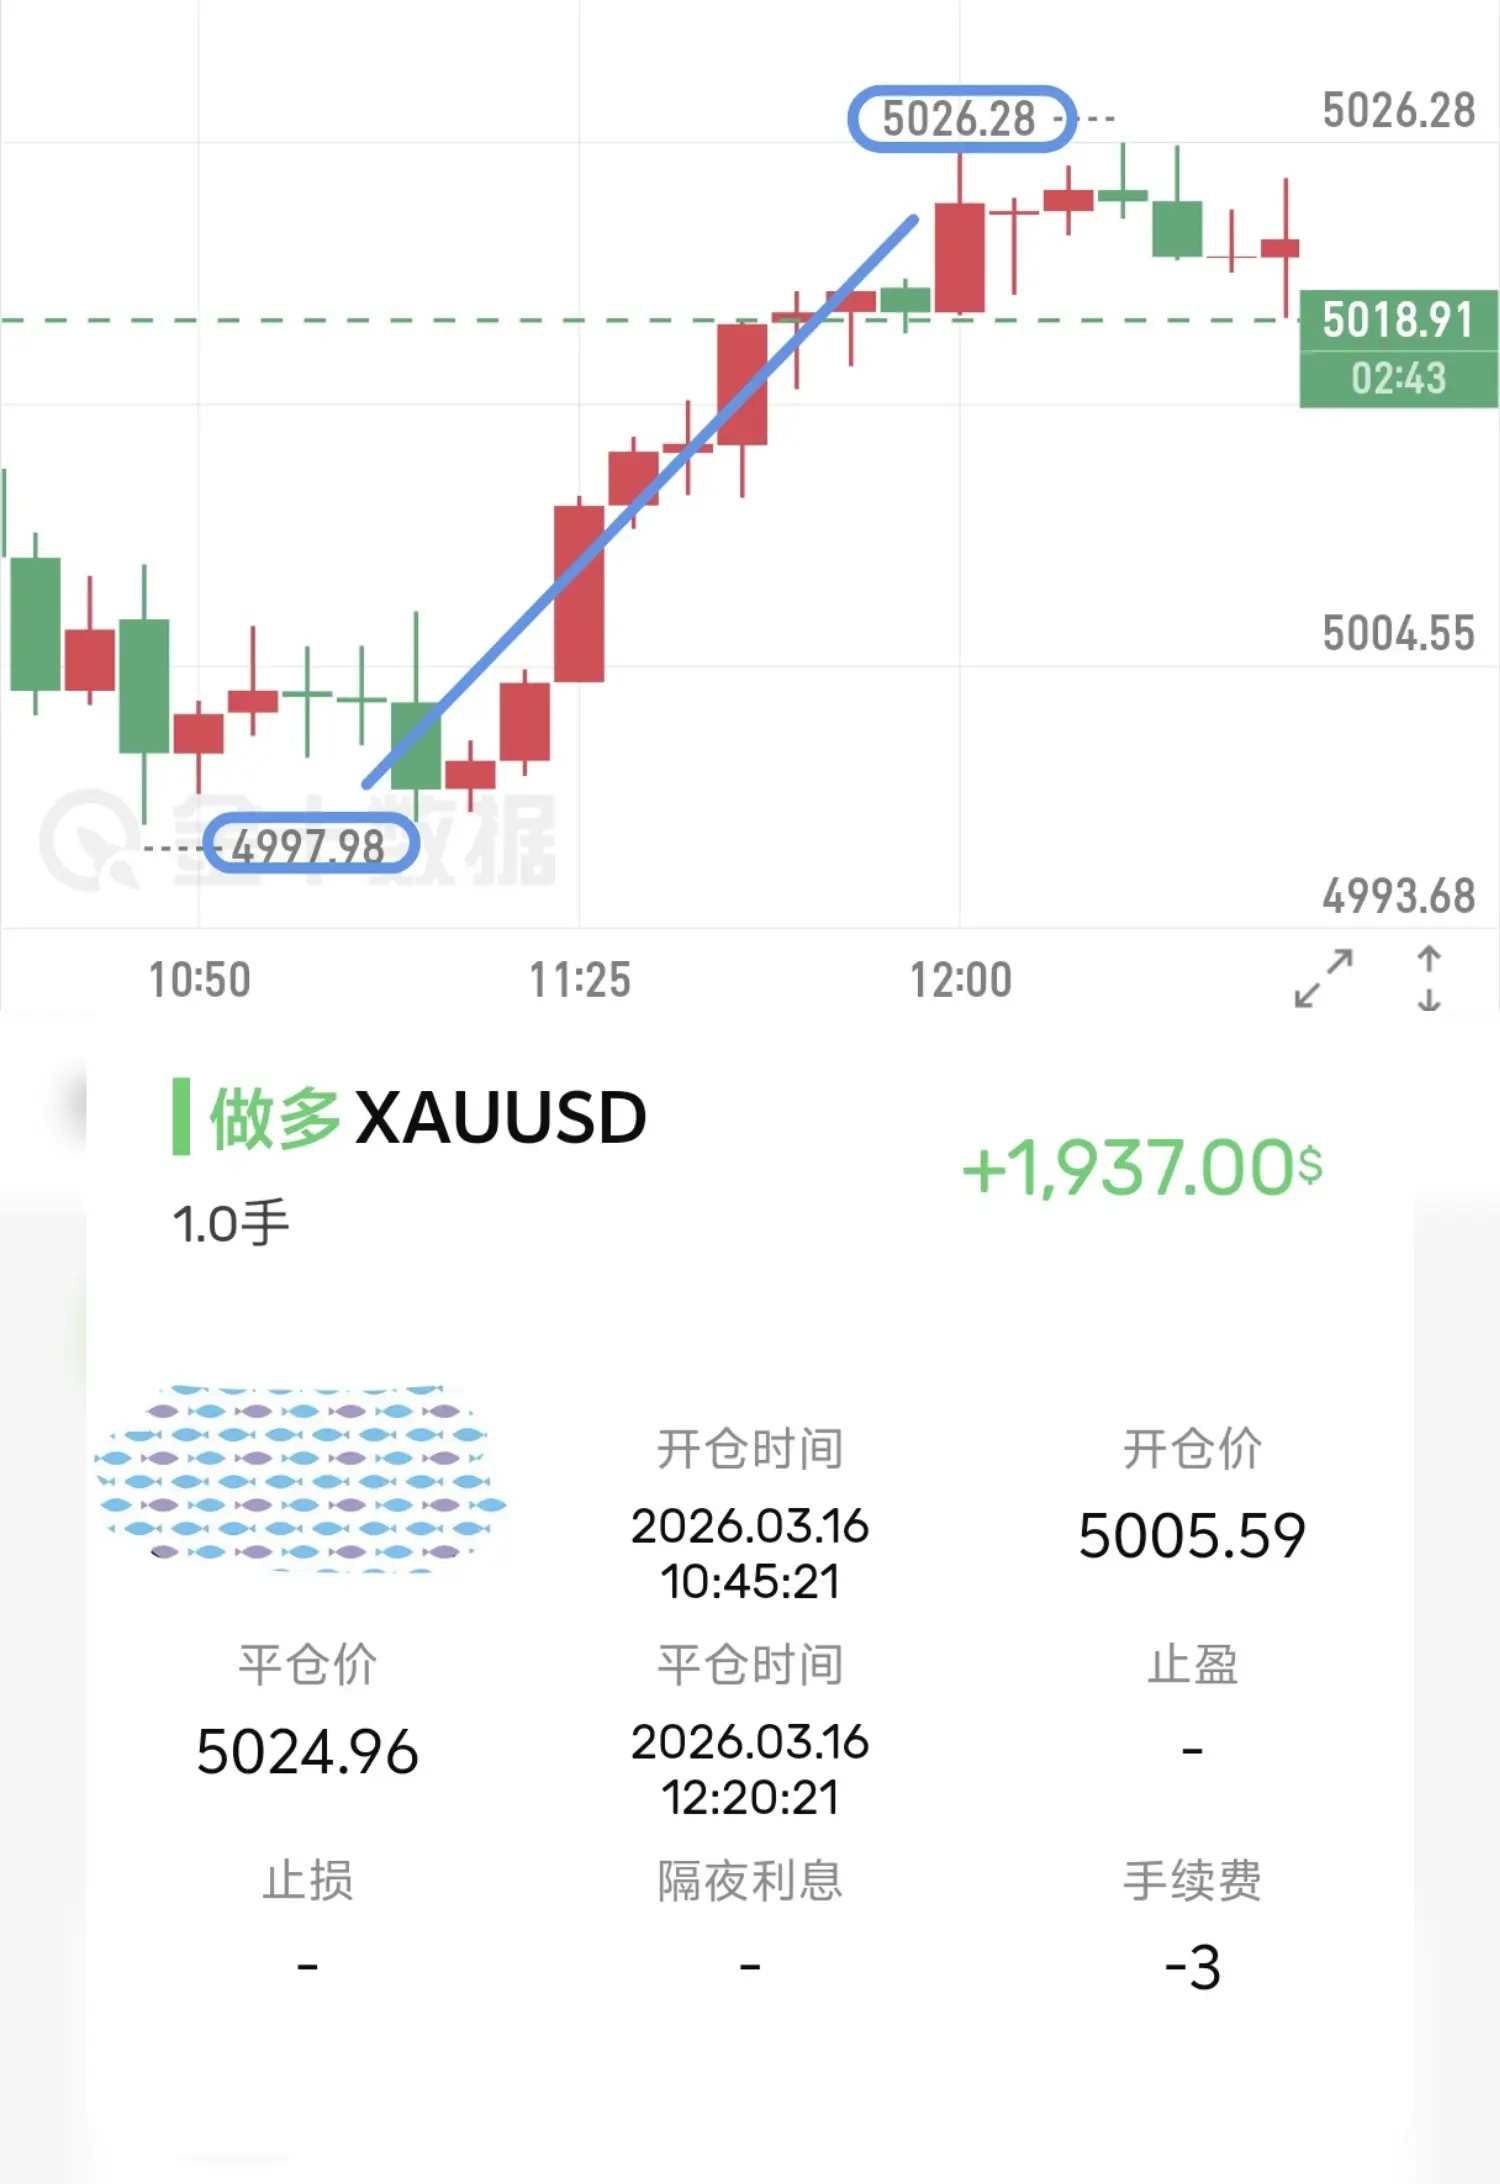
倉庫の第八段!
5005の倍、菊を出すのは5025、20個の典を手に入れた!これが五木の底力であり、五木の実力だ
22388-24325
#Gate广场AI测评官 #加密市场上涨 #比特币站上七万美元
5005の倍、菊を出すのは5025、20個の典を手に入れた!これが五木の底力であり、五木の実力だ
22388-24325
#Gate广场AI测评官 #加密市场上涨 #比特币站上七万美元
BTC3.08%
- 報酬
- いいね
- コメント
- リポスト
- 共有
暗号資産市場は週末に何が起きたのか?
• ビットコインは74,000ドルを超えて上昇を続けた。
• ビットコインETFは3月13日に1億8040万ドルの純流入を記録した。
• The Merge以降、イーサリアムの流通供給量は100万ETH以上増加した。
• トランプ氏は、イランにおける米国の支援がなければNATOは「非常に悪い未来」に直面するリスクがあると警告した。
• 米国や他国は、オルムズ海峡の安全確保のために軍艦を派遣した。
• ブレント原油の価格は106ドルを超えた。
• Bloombergによると、複数の指標がビットコインの過小評価を示唆している。
• キヨサキは、大規模な崩壊後、金、銀、ビットコインの価格が上昇すると述べた。
• マイケル・セイラーは、さらにビットコインを買い増す可能性を示唆した。
• Circleは、開発者向けのオープンソースAIスキルセット「Circle Skills」を立ち上げた。
• テザーのCEOは、今後のAIにおける大きな進展を発表した。
• ストーリープロトコルは、AI関連の新規プロジェクトを模索する中で複数の従業員を解雇した。
• ボリス・ジョンソンは、ビットコインをポンジスキームの可能性がある詐欺と呼んだ。
• 米国でビットコインの税制改革が勢いを増している。
• コリン・バトラーは、規制の不確実性がステーブルコインに関わる銀行の遅れ
原文表示• ビットコインは74,000ドルを超えて上昇を続けた。
• ビットコインETFは3月13日に1億8040万ドルの純流入を記録した。
• The Merge以降、イーサリアムの流通供給量は100万ETH以上増加した。
• トランプ氏は、イランにおける米国の支援がなければNATOは「非常に悪い未来」に直面するリスクがあると警告した。
• 米国や他国は、オルムズ海峡の安全確保のために軍艦を派遣した。
• ブレント原油の価格は106ドルを超えた。
• Bloombergによると、複数の指標がビットコインの過小評価を示唆している。
• キヨサキは、大規模な崩壊後、金、銀、ビットコインの価格が上昇すると述べた。
• マイケル・セイラーは、さらにビットコインを買い増す可能性を示唆した。
• Circleは、開発者向けのオープンソースAIスキルセット「Circle Skills」を立ち上げた。
• テザーのCEOは、今後のAIにおける大きな進展を発表した。
• ストーリープロトコルは、AI関連の新規プロジェクトを模索する中で複数の従業員を解雇した。
• ボリス・ジョンソンは、ビットコインをポンジスキームの可能性がある詐欺と呼んだ。
• 米国でビットコインの税制改革が勢いを増している。
• コリン・バトラーは、規制の不確実性がステーブルコインに関わる銀行の遅れ
- 報酬
- 1
- コメント
- リポスト
- 共有
小龙虾
小龙虾
作成者@EarnedOneBillionIn2026
上場の進行状況
0.00%
時価総額:
$2.52K
より多くのトークン
Today's ETH Dual Currency with highest annualized yield of 745% 🚀
Earn regardless of price movement, no fear of market volatility:
📈 Rise ➡️ Take profits + Earn stable returns
📉 Fall ➡️ Build positions on dips + Still collect returns
🎁 Limited time offer: Purchase $100 and receive $100 trial bonus!
🔗 https://www.gate.com/campaigns/4242
Earn regardless of price movement, no fear of market volatility:
📈 Rise ➡️ Take profits + Earn stable returns
📉 Fall ➡️ Build positions on dips + Still collect returns
🎁 Limited time offer: Purchase $100 and receive $100 trial bonus!
🔗 https://www.gate.com/campaigns/4242
ETH7.08%

- 報酬
- 1
- 1
- リポスト
- 共有
SiYu :
:
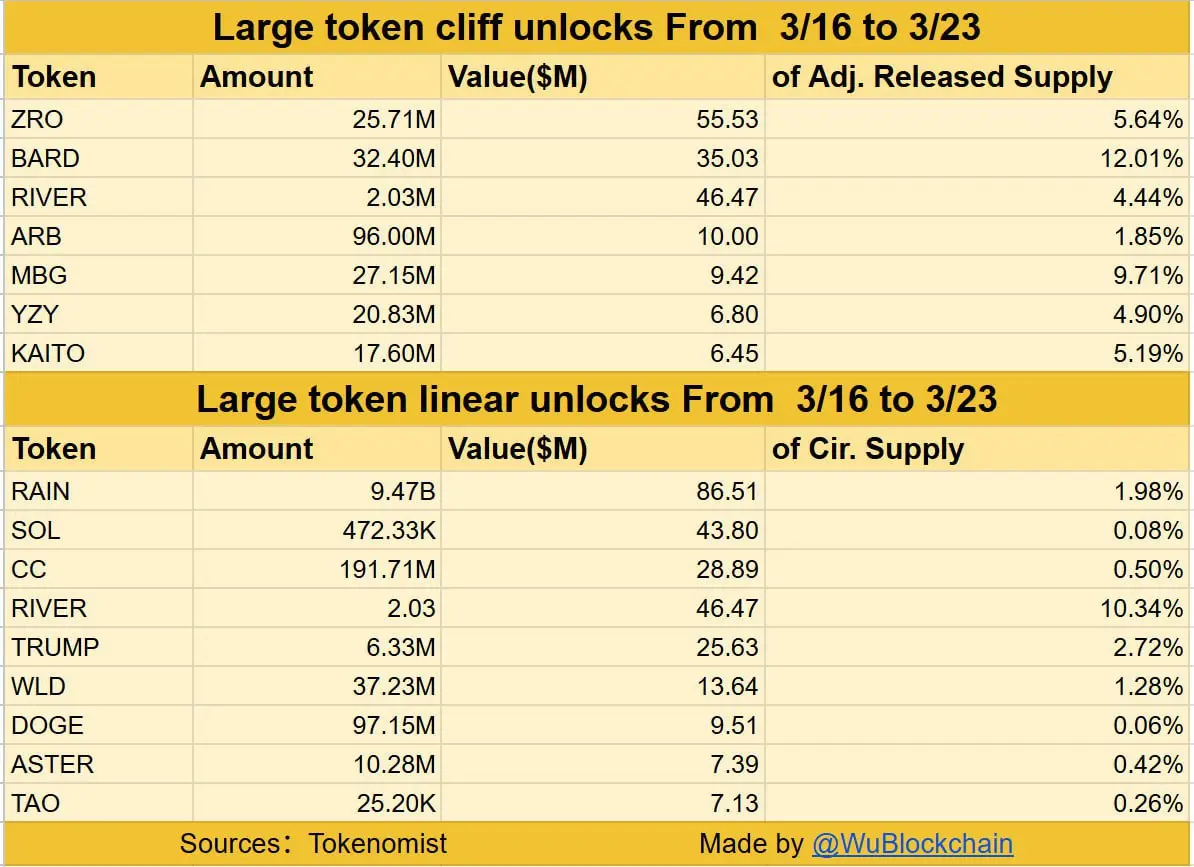
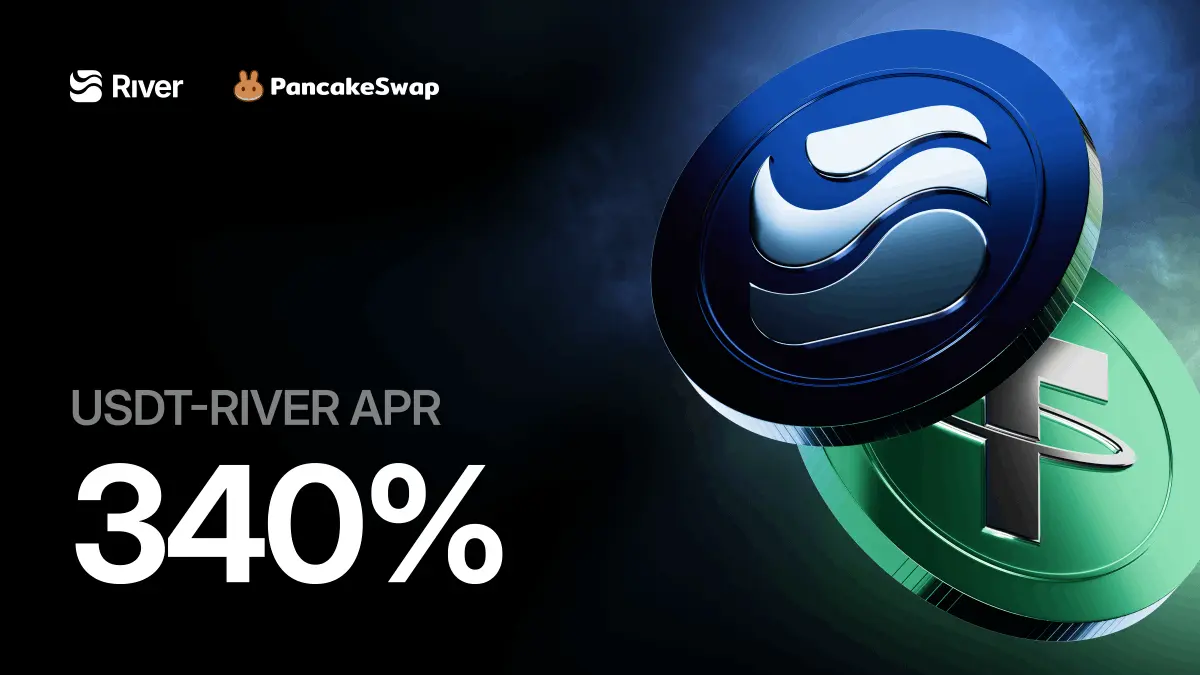
馬年に大儲け 🐴I've reviewed the River project. In simple terms, it's a cross-chain collateral lending protocol for stablecoins—you can collateralize BTC on the ETH chain and directly borrow satUSD on BNB Chain without needing cross-chain bridges or wrapped assets.
Technically, it uses LayerZero's OFT standard and currently supports 15 chains including Ethereum, Arbitrum, Base, and Sui. From a data perspective, TVL has reached $600 million, satUSD circulation is close to $270 million, with an overcollateralization ratio of 182%—there's a solid safety buffer. Financing looks solid too, with Arthur Hayes' fund
原文表示Technically, it uses LayerZero's OFT standard and currently supports 15 chains including Ethereum, Arbitrum, Base, and Sui. From a data perspective, TVL has reached $600 million, satUSD circulation is close to $270 million, with an overcollateralization ratio of 182%—there's a solid safety buffer. Financing looks solid too, with Arthur Hayes' fund
- 報酬
- いいね
- コメント
- リポスト
- 共有
ホルムズ海峡は海軍にとって悪夢だ。
狭い航路、イラン側の高い地形、そして短いミサイル飛行時間。
非対称戦争には最適な場所だ。
大型船舶には最悪の場所だ。
原文表示狭い航路、イラン側の高い地形、そして短いミサイル飛行時間。
非対称戦争には最適な場所だ。
大型船舶には最悪の場所だ。

- 報酬
- いいね
- コメント
- リポスト
- 共有
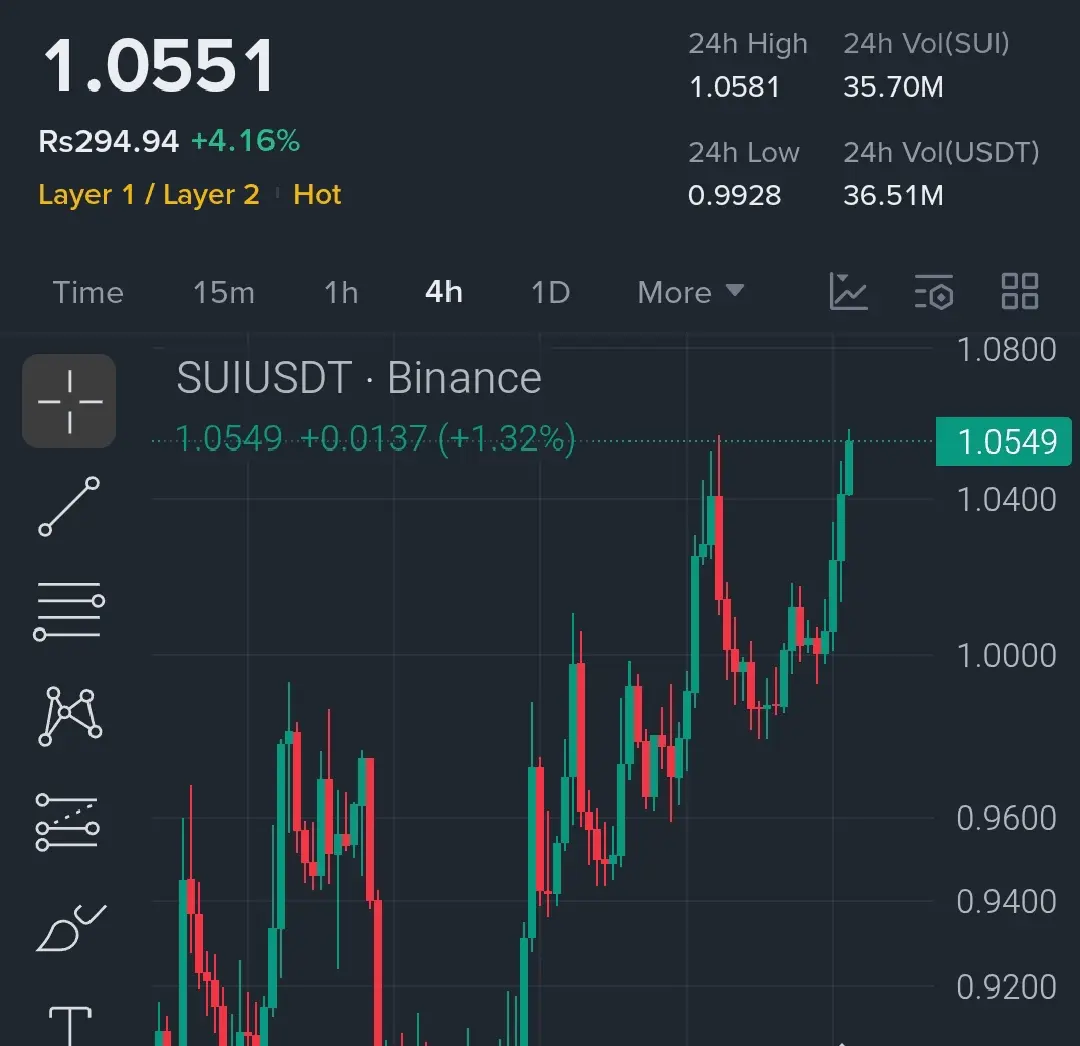
Week of (3.16–3.22) BTC Market Analysis
As of March 16, BTC is trading around $71,500. Early in the week, driven by geopolitical safe-haven demand and ETF capital inflows, it surged to $73,000, with the week showing a wide-range upward oscillation pattern.
Technical Analysis: The daily chart maintains an uptrend channel, but MACD shows a bearish divergence at high levels and RSI at 68 is approaching overbought conditions, indicating weakening bullish momentum and rising pullback pressure. Key levels: Support at $70,000–$68,500, Resistance at $73,000–$74,000. The 4-hour Bollinger Bands are narr
BTC3.08%


- 報酬
- 2
- 3
- リポスト
- 共有
WoodGrowsIntoAForest.:
快上車!🚗もっと見る


- 報酬
- 2
- コメント
- リポスト
- 共有
74000が65600までわずか4日で下落
65600から74000への反発はたった8日で
これで強気が勝ったと言えるのか?
強気はどこで勝ったのか?
もう少し頑張って、1月の98000の起点まで引き戻せないのか?
60000を割るのは時間の問題に過ぎない
相場は強気にもっと息つく時間を与えた
しかしそれはただの弱気市場の中休みの時間に過ぎない#比特币站上七万美元 $BTC $ETH
原文表示65600から74000への反発はたった8日で
これで強気が勝ったと言えるのか?
強気はどこで勝ったのか?
もう少し頑張って、1月の98000の起点まで引き戻せないのか?
60000を割るのは時間の問題に過ぎない
相場は強気にもっと息つく時間を与えた
しかしそれはただの弱気市場の中休みの時間に過ぎない#比特币站上七万美元 $BTC $ETH
- 報酬
- いいね
- コメント
- リポスト
- 共有


- 報酬
- 4
- 4
- リポスト
- 共有
Jun541888 :
:
バカ、脳みそ使えよ。この価格なら太陽系が買える。もっと見る
もっと詳しく