


#BitcoinSupportAndResistanceAnalysis
Bitcoin Support and Resistance Analysis Current Technical Market Breakdown
As of today, Bitcoin (BTC) is trading in the range of $74,050 – $74,150, showing renewed momentum after recent market fluctuations. This range has become a critical pivot zone, where short-term decisions by traders could dictate whether BTC pushes higher or consolidates. Understanding these support and resistance levels is crucial for anyone looking to navigate the Bitcoin market effectively.
Understanding Support and Resistance in BTC Price Action
In technical analysis, support levels are price points where buying pressure tends to prevent further declines, while resistance levels are zones where selling pressure slows or reverses upward movement. These levels are tested repeatedly and are key indicators of market sentiment. BTC’s behavior around these zones often signals whether a trend will continue, pause, or reverse.
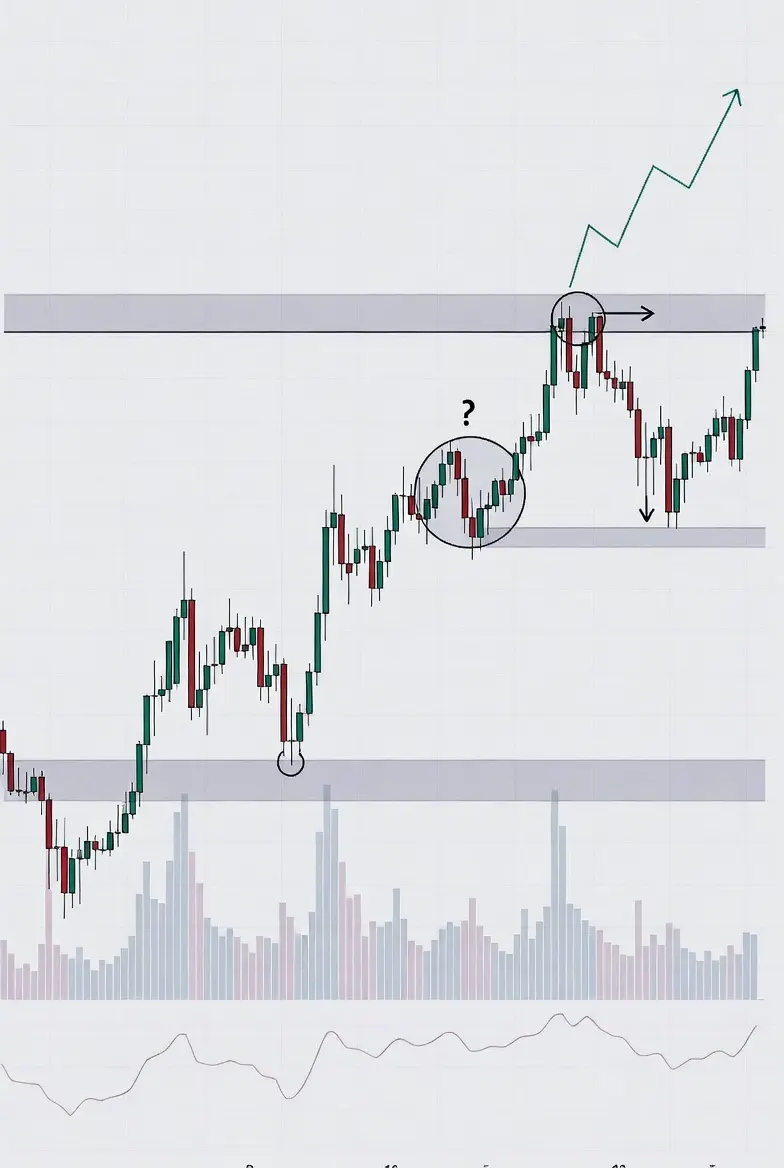
Immediate Support Zones
Around the current trading range near $74,100, there are several important support levels:
$70,000 Support: This psychological and technical support has historically acted as a cushion during pullbacks. Buyers have consistently stepped in around this level, creating a strong foundation for rebounds.
$68,000–$70,000 Zone: A broader demand area where prior consolidation has occurred. This zone often provides a safety net in case of deeper corrections and is watched closely by both retail and institutional traders.
Maintaining these support zones is vital for BTC to sustain momentum. A drop below $70,000 could trigger further downside, but so far, BTC has shown resilience above $68,000.
Key Resistance Levels
BTC faces notable resistance levels above the current price:
$74,500–$75,000: The immediate resistance cluster. Sellers historically emerge in this zone, making it a critical hurdle for short-term bullish continuation.
$75,000–$76,000: A major resistance ceiling. A successful break above this area could open the path toward new short-term highs, attracting more buying activity.
Overcoming these resistance zones is essential for BTC to maintain its upward trajectory. Failure to do so may result in sideways movement or short-term consolidation.
Current Market Conditions Supporting the Analysis
Several factors currently support BTC’s technical strength:
Short Liquidations: Traders betting on declines have been forced to close positions, fueling upward momentum.
Institutional Flows: Inflows into Bitcoin ETFs have added buying pressure, reflecting renewed confidence from larger market participants.
Momentum Indicators: RSI and other momentum tools show moderate bullish pressure, suggesting room for short-term upside without immediate overextension.
These elements combine to create a technically constructive environment, though resistance levels above remain significant.
Why the $74,000 Zone Matters
The range around $74,000–$75,000 is pivotal. It represents the intersection of strong support and approaching resistance:
Holding Above $74,000: Indicates buyer commitment and increases the likelihood of testing higher resistance levels.
Struggling at Resistance: Suggests potential range-bound behavior, where BTC may oscillate between support and resistance zones before a decisive breakout.
This zone is a key barometer for short-term market sentiment and can dictate the next directional move.
Technical Tools for Traders
Traders often rely on several technical tools to analyze these levels:
Fibonacci Retracement: Identifies potential reversal zones based on prior trends.
Pivot Points: Helps determine intraday and short-term trend bias.
Momentum Indicators: Tools like RSI and MACD assess overbought or oversold conditions, indicating trend strength and potential reversals.
Combining these tools provides a more holistic view of where BTC might find support or encounter resistance.
Short-Term and Mid-Term Scenarios
Bullish Scenario:
If BTC sustains above $74,000 and breaks $75,000–$76,000 resistance, the market may see accelerated buying, potentially driving prices toward the next technical targets above $77,000.
Bearish Scenario:
If BTC fails to hold the $74,000 zone and falls below $70,000, it could enter a deeper retracement toward $68,000 or lower. Such a move could trigger increased selling and short-term consolidation.
Trading Takeaways
Support Levels to Watch: $70,000 and $68,000.
Resistance Levels to Watch: $74,500–$75,000 and $75,000–$76,000.
Market Drivers: Short liquidations, ETF inflows, and momentum indicators all favor cautious optimism.
Next Moves: A clear break above resistance could signal further upside, while failure to hold support may lead to consolidation.
Conclusion
Bitcoin’s trading around $74,000 is currently defined by a delicate balance between buyer and seller pressures. Traders should focus on these key support and resistance zones, closely monitor momentum indicators, and consider both technical and fundamental factors such as institutional flows and market sentiment.
The next few days will be crucial in determining whether BTC can sustain bullish momentum toward $76,000 and beyond, or if a retracement toward $70,000–$68,000 is likely. Staying informed on these levels provides traders and investors with the best opportunity to navigate the market strategically.
Bitcoin Support and Resistance Analysis Current Technical Market Breakdown
As of today, Bitcoin (BTC) is trading in the range of $74,050 – $74,150, showing renewed momentum after recent market fluctuations. This range has become a critical pivot zone, where short-term decisions by traders could dictate whether BTC pushes higher or consolidates. Understanding these support and resistance levels is crucial for anyone looking to navigate the Bitcoin market effectively.
Understanding Support and Resistance in BTC Price Action
In technical analysis, support levels are price points where buying pressure tends to prevent further declines, while resistance levels are zones where selling pressure slows or reverses upward movement. These levels are tested repeatedly and are key indicators of market sentiment. BTC’s behavior around these zones often signals whether a trend will continue, pause, or reverse.
Immediate Support Zones
Around the current trading range near $74,100, there are several important support levels:
$70,000 Support: This psychological and technical support has historically acted as a cushion during pullbacks. Buyers have consistently stepped in around this level, creating a strong foundation for rebounds.
$68,000–$70,000 Zone: A broader demand area where prior consolidation has occurred. This zone often provides a safety net in case of deeper corrections and is watched closely by both retail and institutional traders.
Maintaining these support zones is vital for BTC to sustain momentum. A drop below $70,000 could trigger further downside, but so far, BTC has shown resilience above $68,000.
Key Resistance Levels
BTC faces notable resistance levels above the current price:
$74,500–$75,000: The immediate resistance cluster. Sellers historically emerge in this zone, making it a critical hurdle for short-term bullish continuation.
$75,000–$76,000: A major resistance ceiling. A successful break above this area could open the path toward new short-term highs, attracting more buying activity.
Overcoming these resistance zones is essential for BTC to maintain its upward trajectory. Failure to do so may result in sideways movement or short-term consolidation.
Current Market Conditions Supporting the Analysis
Several factors currently support BTC’s technical strength:
Short Liquidations: Traders betting on declines have been forced to close positions, fueling upward momentum.
Institutional Flows: Inflows into Bitcoin ETFs have added buying pressure, reflecting renewed confidence from larger market participants.
Momentum Indicators: RSI and other momentum tools show moderate bullish pressure, suggesting room for short-term upside without immediate overextension.
These elements combine to create a technically constructive environment, though resistance levels above remain significant.
Why the $74,000 Zone Matters
The range around $74,000–$75,000 is pivotal. It represents the intersection of strong support and approaching resistance:
Holding Above $74,000: Indicates buyer commitment and increases the likelihood of testing higher resistance levels.
Struggling at Resistance: Suggests potential range-bound behavior, where BTC may oscillate between support and resistance zones before a decisive breakout.
This zone is a key barometer for short-term market sentiment and can dictate the next directional move.
Technical Tools for Traders
Traders often rely on several technical tools to analyze these levels:
Fibonacci Retracement: Identifies potential reversal zones based on prior trends.
Pivot Points: Helps determine intraday and short-term trend bias.
Momentum Indicators: Tools like RSI and MACD assess overbought or oversold conditions, indicating trend strength and potential reversals.
Combining these tools provides a more holistic view of where BTC might find support or encounter resistance.
Short-Term and Mid-Term Scenarios
Bullish Scenario:
If BTC sustains above $74,000 and breaks $75,000–$76,000 resistance, the market may see accelerated buying, potentially driving prices toward the next technical targets above $77,000.
Bearish Scenario:
If BTC fails to hold the $74,000 zone and falls below $70,000, it could enter a deeper retracement toward $68,000 or lower. Such a move could trigger increased selling and short-term consolidation.
Trading Takeaways
Support Levels to Watch: $70,000 and $68,000.
Resistance Levels to Watch: $74,500–$75,000 and $75,000–$76,000.
Market Drivers: Short liquidations, ETF inflows, and momentum indicators all favor cautious optimism.
Next Moves: A clear break above resistance could signal further upside, while failure to hold support may lead to consolidation.
Conclusion
Bitcoin’s trading around $74,000 is currently defined by a delicate balance between buyer and seller pressures. Traders should focus on these key support and resistance zones, closely monitor momentum indicators, and consider both technical and fundamental factors such as institutional flows and market sentiment.
The next few days will be crucial in determining whether BTC can sustain bullish momentum toward $76,000 and beyond, or if a retracement toward $70,000–$68,000 is likely. Staying informed on these levels provides traders and investors with the best opportunity to navigate the market strategically.