The Truth About Market Makers: Price Manipulation, Liquidity, and How Retail Traders Get Harvested
This recent flash crash has led many traders to speculate that Binance’s market makers encountered issues—even PAX Gold ($PAXG), which is backed by gold, experienced similar sudden price spikes.
Why do retail investors often complain that prices drop right after they buy and rise as soon as they sell?
So, what is the role of a market maker, and how does their mechanism operate?
1. Trading Fee Rebates
2. Two-sided order placement: By executing both buy and sell orders, market makers earn small profits from the spread. These incremental gains are achieved by capturing liquidity through time and information asymmetry.
3. Price Discovery: Facilitating efficient market pricing and providing essential liquidity
4. Proprietary Trading: Managing the order book, sometimes coordinating with news events to offload liquidity to retail participants
The term “Market Maker” describes an entity that creates a market where none previously existed.
Imagine you’re the market maker for a project. The order book is structured as follows:
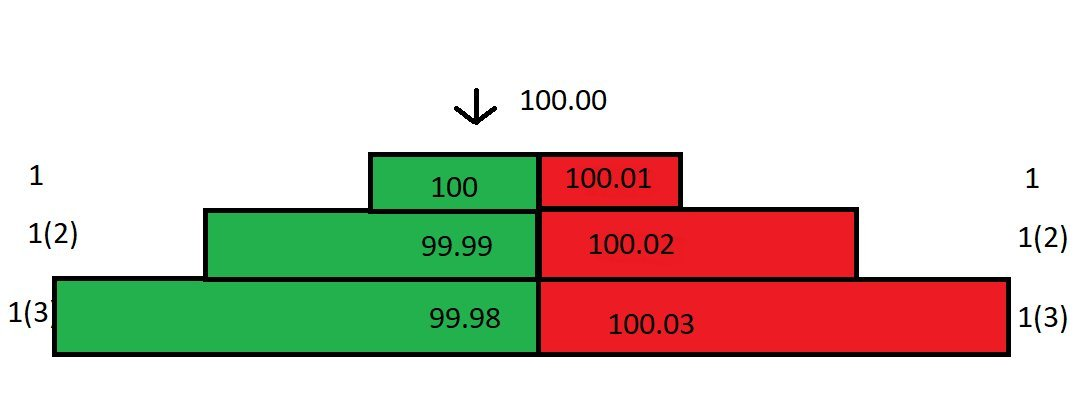
Assume there are no other investors posting limit orders; you are the sole liquidity provider—the only market maker. The minimum price increment is 0.01. Taker (market) orders pay a 0.025% fee; Maker orders (limit orders) receive a 0.01% rebate.
As the market maker, you post limit orders. Every market order that matches your price earns you a 0.01% rebate.
The difference between the Best Bid/Offer (BBO) is the spread. Currently, the spread in the order book is 0.01.
Suppose a market sell order arrives and matches your best bid at 100. You pay 100, but the seller receives only 99.975 due to a 0.025% trading fee. You receive a 0.01% rebate, so your net cost is 99.99.
With the best bid removed, the order book’s spread widens to 0.02. The last traded price remains at 100:
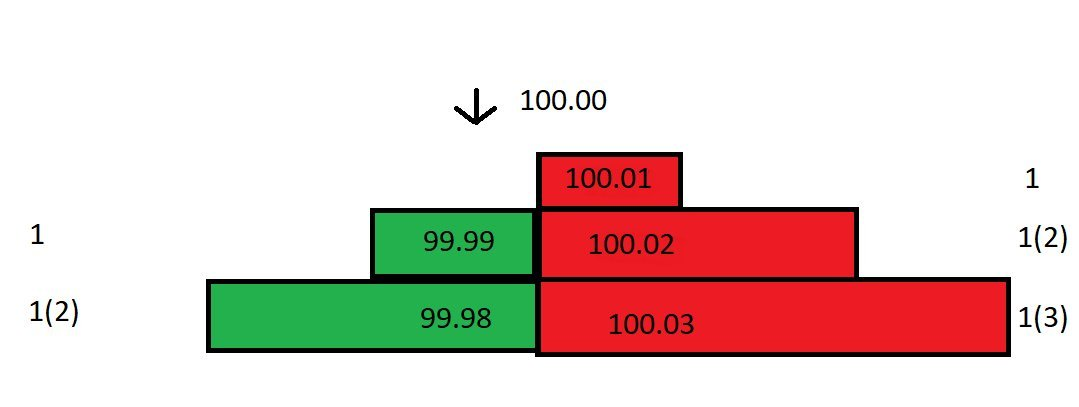
If a buy order comes in, it matches your best ask at 100.01. You previously bought at 99.99 and now sell at 100.01, earning 0.02, plus the rebate for a total Round-Trip Profit of about 0.03.
Even though the spread between your best bid (100) and best ask (100.01) is only 0.01, your actual profit is 0.03!
If market orders continue to flow and match your limit orders, you earn 0.03 per transaction. Over time, these small profits can add up rapidly.
However, markets rarely move as planned. After you buy at 99.99, the spot price drops from 100 to 99.80. You quickly withdraw your bids at 99.99 and 99.98 to prevent arbitrage.
Now that the price is 99.80 and your best ask remains at 100.01, buyers may find the ask too high. Lowering your ask to 99.81 would result in a 0.17 loss.
As the only market maker, you can leverage your position to adjust the order book and minimize losses.
You calculate the break-even sell price. Since you bought at 99.99, to break even, your best ask should be 99.98 (with the rebate, your net proceeds are 99.99—neither profit nor loss).
You update the order book, posting bids at 99.80 and 99.79, and an ask at 99.98:
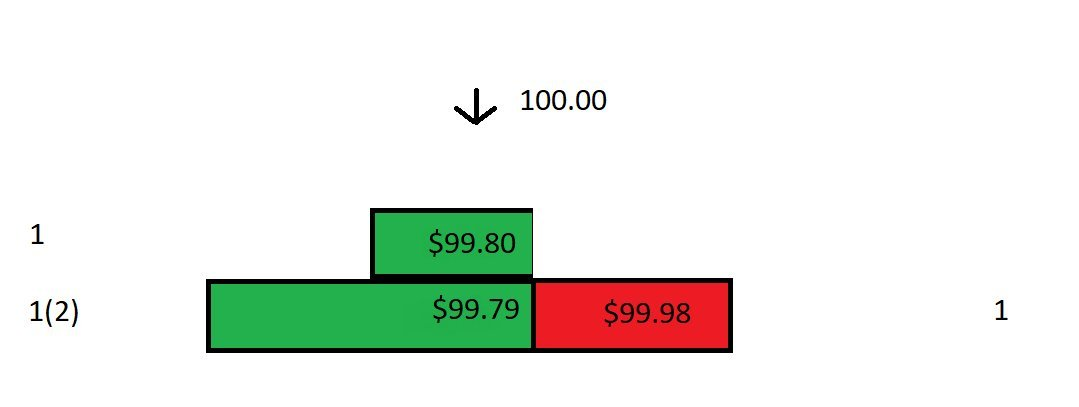
Although the spread is now significant, you can choose not to lower the ask price. It’s ideal when a buyer accepts your 99.98 ask. If not, your lower bids at 99.80 may attract market orders.
Now, a market buy order matches your best bid. You hold two contracts, and your average cost is (99.79+99.99)/2 = 99.89. This lower price reflects the 0.01% maker rebate applied to your recent trade.
Your average holding cost has dropped to 99.89. You lower your best ask from 99.98 to 99.89, halving the spread. By repeating this process, you can reduce cost and tighten the spread.
In this example, the price moved only 0.2%. But if it suddenly moves 5%, 10%, or more, even these tactics might not prevent losses due to the widened spread!
That’s why market makers must analyze two factors:
How volatile is the price over various time frames?
What is the market’s trading volume?
Volatility refers to how much the price deviates from its average, varying by time window. A product may be erratic on a one-minute chart but stable on a daily chart. Volume reflects liquidity, affecting both spread and fill rates.
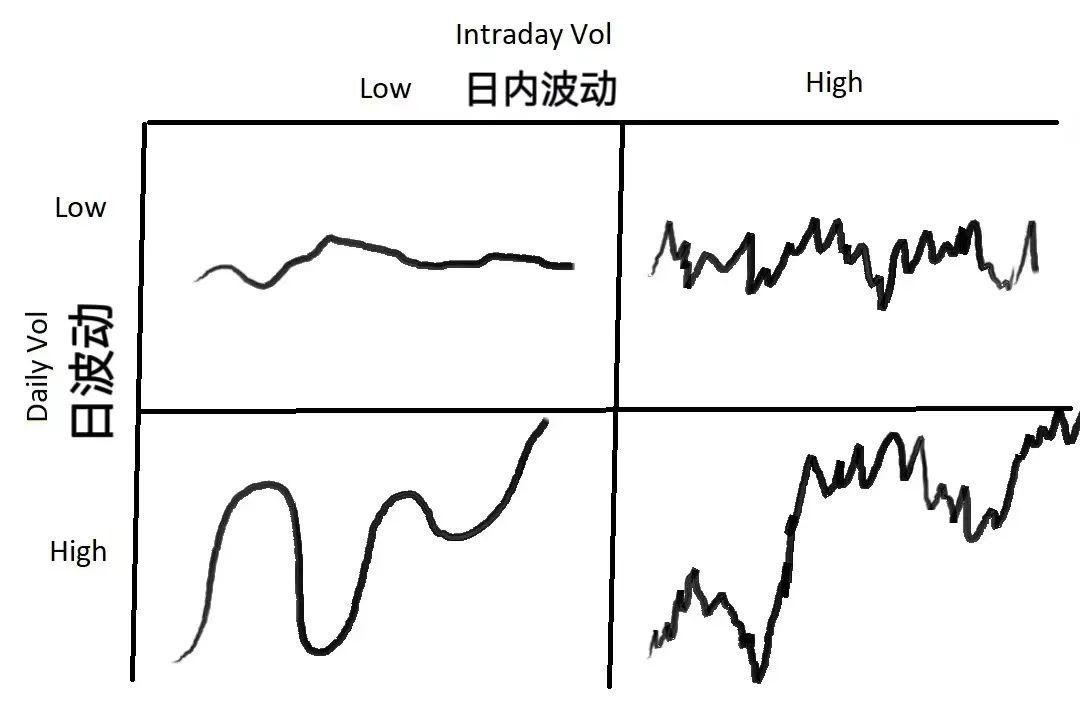
The chart above illustrates four types of price volatility. Market makers must adapt their strategies accordingly:
If overall market volatility is low—both daily and intraday—choose a narrow spread to maximize trading volume.
If daily volatility is low but intraday volatility is high (large swings, but no net move), widen the spread and use larger order sizes. If prices move against you, average down to mitigate loss.
If daily volatility is high but intraday volatility is low (steady trending market), use a smaller, tighter spread.
If both daily and intraday volatility are high, widen the spread and reduce order size. This is the riskiest scenario, often driving away other market makers—but with risk comes opportunity. Most of the time, market makers earn steady returns, yet sudden market moves can wipe out one side of your order book, forcing a loss.
Market making involves two essential steps: determining the fair price and setting the spread.
First, establish the fair price—the level at which you post orders. This is critical: misjudging the fair price can leave you stuck with inventory, forcing you to liquidate at a loss.
One pricing method is referencing other markets. For example, trading USD/JPY in London, you may look at New York’s price. However, if another market experiences abnormal swings, this reference becomes unreliable.
Another method is using the mid price: (best bid + best ask) / 2. Quoting near the mid price is simple and effective, as it reflects the market’s consensus. “Quote around mid, the market is probably right.”
There are other pricing methods—algorithmic models, market depth, and more—but these are beyond this discussion.
The second key factor is the spread. To set an appropriate spread, consider average volume, its variance, average size and variance of taker orders, the quantity of limit orders near the fair price, short-term volatility and its variance, trading and rebate fees, and secondary factors like API speed and order management speed.
In very short time frames, expected profit from market making is actually negative. Every taker order aims to match at a price advantage—unless it’s a forced stop-loss. Every other participant seeks to profit from your liquidity.
Imagine you’re a market maker: where do you post your orders?
To maximize the spread while ensuring execution, post at the front of the order book—best bid and best ask. Once the price moves, your best bid is instantly matched. However, frequent price changes can be a problem—if you just acquired inventory, a price shift may prevent your best ask from being filled.
In a low-liquidity market with minor price changes, posting at best bid/ask is safer, but this leads to competition—other market makers may tighten the spread, reducing profits to zero.
Let’s examine spread determination mathematically, starting with volatility. You need to know the asset’s price and volume volatility around its mean over short cycles. Assume price movement follows a normal distribution, though real data may differ.
Suppose you sample every second over a 60-second window. The current mid price’s mean matches the mean from 60 seconds ago (constant mean), and the standard deviation is 0.04. Under a normal distribution, 68% of prices stay within one standard deviation ($-0.04 to +$0.04), and 99.7% stay within three standard deviations ($-0.12 to +$0.12).
For further illustration: If you quote a spread of 0.08 (0.04 on each side of the mid price), 68% of the time, prices stay within one standard deviation. For the remaining 32%, price volatility exceeds this range. Thus, expected profit per unit time is approximately 32% * $0.04 = $0.0128.
Consider this additional example: If you quote a 0.06 spread (0.03 from the mid on each side), that’s 0.75 standard deviations. The probability of price movement exceeding 0.75 standard deviations is 45%, so expected profit per unit time is 45% 0.03 = $0.0135. If you quote a 0.04 spread (0.02 from the mid on each side), that’s 0.5 standard deviations, with a 61% chance of exceeding 0.5 standard deviations, so expected profit per unit time is 61% 0.02 = $0.0122.
Thus, quoting at 0.75 standard deviations (a 0.06 spread) results in the highest expected profit: $0.0135. Comparing 1, 0.75, and 0.5 standard deviations, 0.75 offers the maximum return. An Excel simulation further confirms this, revealing a convex function peaking near 0.75 standard deviations.
This assumes price volatility follows a normal distribution with zero mean—meaning average market return is zero. In reality, the mean can shift. When holding inventory, not only can you face losses, but your expected profit also declines.
In summary, a market maker’s expected outcome has two components: the probability that posted orders are executed (e.g., posting at one standard deviation yields a 32% chance), and the probability that orders are not filled (e.g., posting at one standard deviation leaves 68% of the time with price moving within the spread).
When orders aren’t filled, the mean price can change. Market makers must manage “inventory cost”—akin to an interest-bearing loan. As time passes, volatility and the “interest” increase. You can use average volatility across time frames to inform mean reversion strategies and limit holding costs.
Statement:
- This article is republished from [DtDt666]. Copyright is retained by the original author [DtDt666]. If you have concerns regarding republication, please contact the Gate Learn team for prompt resolution following our procedures.
- Disclaimer: The views and opinions expressed are solely those of the author and do not constitute investment advice.
- Other language versions are translated by the Gate Learn team. Unless explicitly referencing Gate, translated articles may not be copied, distributed, or plagiarized.
Share


Related Articles

The Future of Cross-Chain Bridges: Full-Chain Interoperability Becomes Inevitable, Liquidity Bridges Will Decline

Solana Need L2s And Appchains?

Sui: How are users leveraging its speed, security, & scalability?

Navigating the Zero Knowledge Landscape

What is Tronscan and How Can You Use it in 2025?