XCH vs VET: Comparing the Potential of Chia and VeChain in the Blockchain Ecosystem
Introduction: XCH vs VET Investment Comparison
In the cryptocurrency market, the comparison between Chia (XCH) and VeChain (VET) has been an unavoidable topic for investors. The two not only show significant differences in market cap ranking, application scenarios, and price performance, but also represent different positions in the crypto asset space.
Chia (XCH): Since its launch in 2021, it has gained market recognition for its unique approach to blockchain verification using unused hard disk storage space.
VeChain (VET): Introduced in 2017, it has been hailed as a pioneer in enterprise blockchain solutions, focusing on supply chain management and business processes.
This article will provide a comprehensive analysis of the investment value comparison between XCH and VET, focusing on historical price trends, supply mechanisms, institutional adoption, technological ecosystems, and future predictions, attempting to answer the question investors care about most:
"Which is the better buy right now?"
I. Price History Comparison and Current Market Status
XCH (Chia) and VET (VeChain) Historical Price Trends
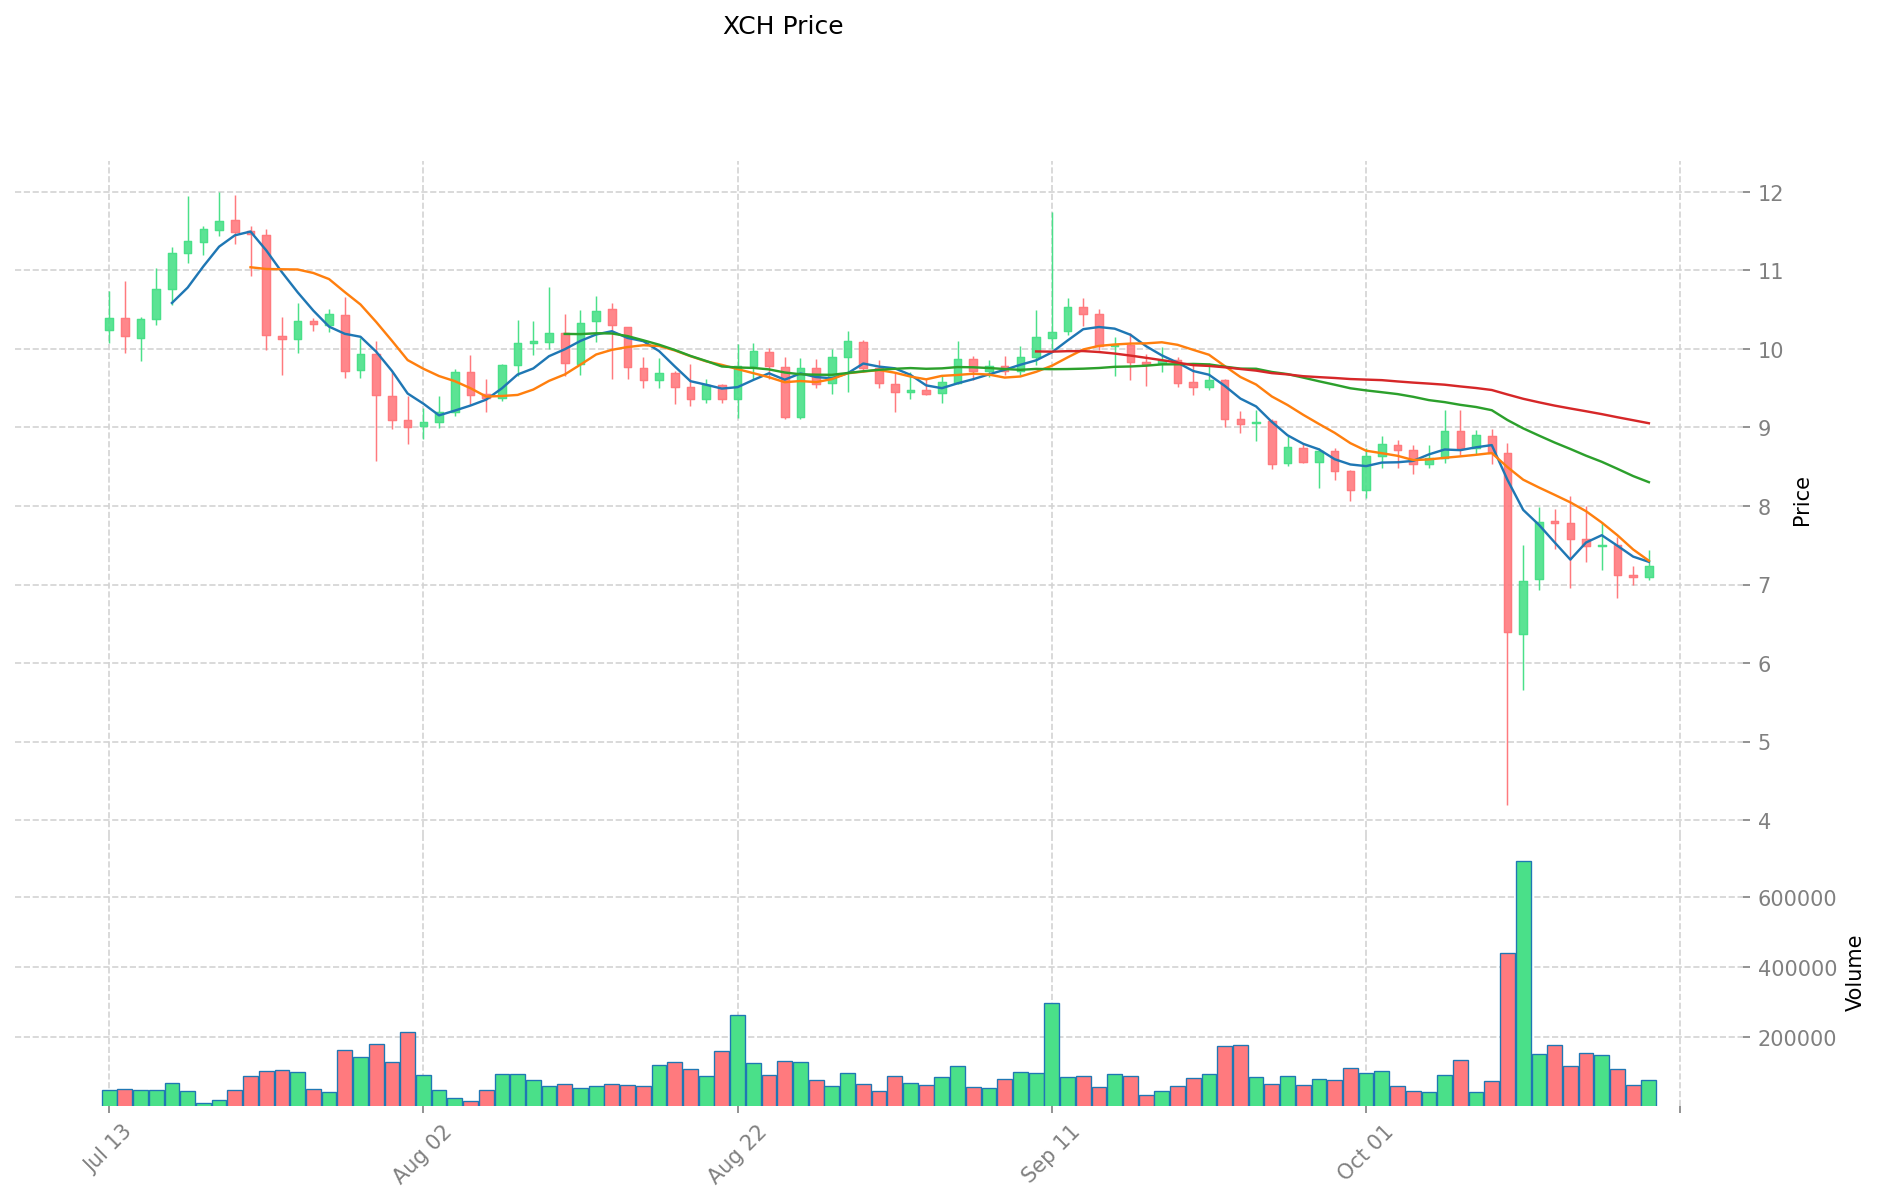
- 2021: XCH reached its all-time high of $1645.12 on May 15, 2021.
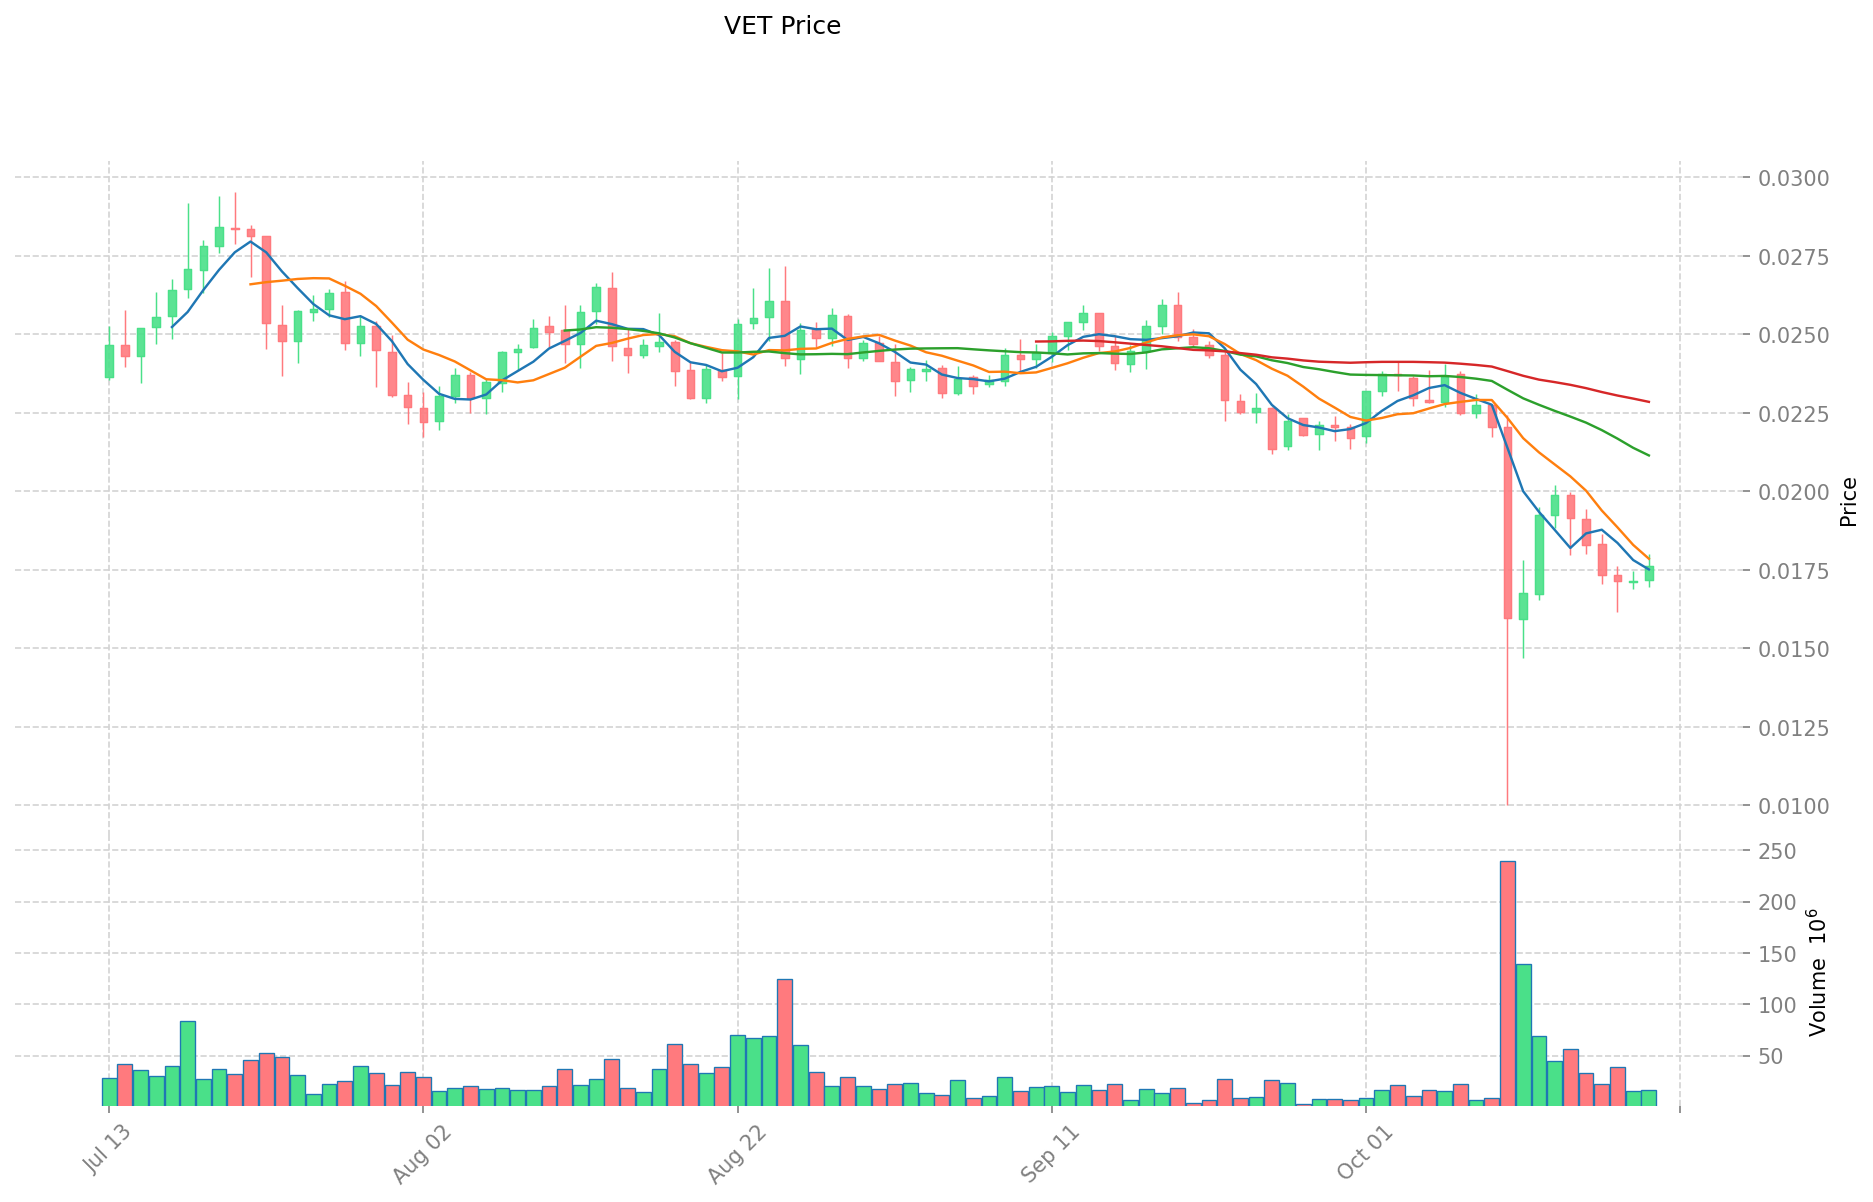
- 2021: VET hit its all-time high of $0.280991 on April 19, 2021.
- Comparative Analysis: In the current market cycle, XCH has fallen from its all-time high of $1645.12 to a current price of $7.24, while VET has declined from $0.280991 to $0.01758.
Current Market Situation (2025-10-20)
- XCH current price: $7.24
- VET current price: $0.01758
- 24-hour trading volume: XCH $590,689.42 vs VET $281,699.53
- Market Sentiment Index (Fear & Greed Index): 29 (Fear)
Click to view real-time prices:
- Check XCH current price Market Price
- Check VET current price Market Price
II. Key Factors Affecting the Investment Value of XCH vs VET
Supply Mechanism Comparison (Tokenomics)
-
XCH: Pre-farm of 21 million XCH coins (equivalent to 21% of total supply) for company use; farming rewards that follow a halving schedule and decrease over time
-
VET: Fixed maximum supply of 86.7 billion tokens, with tokens distributed between the VeChain Foundation, enterprise investors, and private investors
-
📌 Historical pattern: Supply mechanisms tend to drive price cycles with halving events (in XCH's case) or token burns creating supply restrictions that can influence market dynamics.
Institutional Adoption and Market Applications
- Institutional holdings: VET has more established enterprise partnerships including PWC, DNV GL, and Walmart China, while XCH has focused more on infrastructure adoption
- Enterprise adoption: VET has stronger real-world applications in supply chain management, while XCH is positioned more as a decentralized cloud storage solution
- National policies: Regulatory approaches vary by jurisdiction, with VET having strong connections in China while facing scrutiny in other markets
Technical Development and Ecosystem Building
- XCH technical upgrades: Focused on improving its Proof of Space and Time consensus mechanism and expanding its decentralized storage capabilities
- VET technical development: Continuous improvement of its dual-token system (VET/VTHO) and ToolChain platform for supply chain management
- Ecosystem comparison: VET has more established commercial applications and partnerships, while XCH is developing its storage-focused ecosystem with applications still emerging
Macroeconomic and Market Cycles
- Performance in inflationary environments: Both assets have limited historical data during significant inflation periods
- Macroeconomic monetary policy: Interest rates and USD strength typically impact the entire cryptocurrency market, including both XCH and VET
- Geopolitical factors: VET's strong ties to Chinese markets may create both opportunities and risks depending on international relations and regulatory changes
III. 2025-2030 Price Prediction: XCH vs VET
Short-term Prediction (2025)
- XCH: Conservative $4.48 - $7.22 | Optimistic $7.22 - $10.33
- VET: Conservative $0.0111 - $0.0174 | Optimistic $0.0174 - $0.0205
Mid-term Prediction (2027)
- XCH may enter a growth phase, with prices estimated between $10.12 - $16.21
- VET may enter a steady growth phase, with prices estimated between $0.0174 - $0.0252
- Key drivers: Institutional capital inflow, ETF, ecosystem development
Long-term Prediction (2030)
- XCH: Base scenario $17.01 - $25.01 | Optimistic scenario $25.01+
- VET: Base scenario $0.0326 - $0.0382 | Optimistic scenario $0.0382+
Disclaimer: This analysis is based on historical data and projections. Cryptocurrency markets are highly volatile and unpredictable. These predictions should not be considered as financial advice. Always conduct your own research before making investment decisions.
XCH:
| 年份 | 预测最高价 | 预测平均价格 | 预测最低价 | 涨跌幅 |
|---|---|---|---|---|
| 2025 | 10.32603 | 7.221 | 4.47702 | 0 |
| 2026 | 12.9848022 | 8.773515 | 7.28201745 | 21 |
| 2027 | 16.209946314 | 10.8791586 | 10.117617498 | 50 |
| 2028 | 18.55603686609 | 13.544552457 | 9.75207776904 | 87 |
| 2029 | 17.9763300209304 | 16.050294661545 | 9.46967385031155 | 121 |
| 2030 | 25.009569141619419 | 17.0133123412377 | 12.079451762278767 | 134 |
VET:
| 年份 | 预测最高价 | 预测平均价格 | 预测最低价 | 涨跌幅 |
|---|---|---|---|---|
| 2025 | 0.0205202 | 0.01739 | 0.0111296 | -1 |
| 2026 | 0.025210283 | 0.0189551 | 0.011941713 | 7 |
| 2027 | 0.02517426831 | 0.0220826915 | 0.017445326285 | 25 |
| 2028 | 0.03284358706795 | 0.023628479905 | 0.01630365113445 | 34 |
| 2029 | 0.036989203867282 | 0.028236033486475 | 0.025694790472692 | 60 |
| 2030 | 0.038156763851947 | 0.032612618676878 | 0.023154959260583 | 85 |
IV. Investment Strategy Comparison: XCH vs VET
Long-term vs Short-term Investment Strategy
- XCH: Suitable for investors focused on decentralized storage potential and long-term ecosystem growth
- VET: Suitable for investors interested in supply chain solutions and enterprise adoption
Risk Management and Asset Allocation
- Conservative investors: XCH: 30% vs VET: 70%
- Aggressive investors: XCH: 60% vs VET: 40%
- Hedging tools: Stablecoin allocation, options, cross-currency portfolios
V. Potential Risk Comparison
Market Risk
- XCH: High volatility due to relatively new market status
- VET: Susceptible to changes in enterprise adoption rates and market sentiment
Technical Risk
- XCH: Scalability, network stability
- VET: Hash power concentration, potential security vulnerabilities
Regulatory Risk
- Global regulatory policies may have differing impacts on both assets
VI. Conclusion: Which Is the Better Buy?
📌 Investment Value Summary:
- XCH advantages: Unique consensus mechanism, potential in decentralized storage market
- VET advantages: Established enterprise partnerships, real-world applications in supply chain management
✅ Investment Advice:
- New investors: Consider a balanced approach with a slight preference for VET due to its more established market presence
- Experienced investors: Explore strategic allocation between both assets based on risk tolerance and market outlook
- Institutional investors: Evaluate VET for its enterprise solutions while monitoring XCH's potential in the growing decentralized storage sector
⚠️ Risk Warning: The cryptocurrency market is highly volatile. This article does not constitute investment advice. None
VII. FAQ
Q1: What are the main differences between XCH and VET? A: XCH focuses on decentralized storage using unused hard disk space, while VET specializes in enterprise blockchain solutions for supply chain management. XCH is newer (launched in 2021) with a unique consensus mechanism, while VET (introduced in 2017) has more established partnerships and real-world applications.
Q2: Which cryptocurrency has performed better historically? A: Both XCH and VET reached their all-time highs in 2021. XCH peaked at $1645.12 on May 15, 2021, while VET hit $0.280991 on April 19, 2021. However, both have since declined significantly, with XCH currently at $7.24 and VET at $0.01758 as of 2025-10-20.
Q3: How do their supply mechanisms differ? A: XCH has a pre-farm of 21 million coins (21% of total supply) and follows a halving schedule for farming rewards. VET has a fixed maximum supply of 86.7 billion tokens distributed among the VeChain Foundation, enterprise investors, and private investors.
Q4: Which cryptocurrency has better institutional adoption? A: VET has more established enterprise partnerships, including PWC, DNV GL, and Walmart China. XCH has focused more on infrastructure adoption and is still developing its ecosystem.
Q5: What are the price predictions for XCH and VET by 2030? A: For XCH, the base scenario predicts $17.01 - $25.01, with an optimistic scenario of $25.01+. For VET, the base scenario predicts $0.0326 - $0.0382, with an optimistic scenario of $0.0382+.
Q6: How should investors allocate their portfolio between XCH and VET? A: Conservative investors might consider 30% XCH and 70% VET, while aggressive investors might opt for 60% XCH and 40% VET. The allocation should be based on individual risk tolerance and market outlook.
Q7: What are the main risks associated with investing in XCH and VET? A: XCH faces high volatility due to its newer market status and potential technical risks related to scalability. VET is susceptible to changes in enterprise adoption rates and potential security vulnerabilities. Both face regulatory risks depending on global policies.
Share
Content