VET vs DOT: A Comparative Analysis of Two Promising Blockchain Projects
Introduction: VET vs DOT Investment Comparison
In the cryptocurrency market, VET vs DOT comparison has always been a topic that investors cannot avoid. The two not only have significant differences in market cap ranking, application scenarios, and price performance, but also represent different cryptocurrency positioning.
Vechain (VET): Since its launch in 2017, it has gained market recognition for its enterprise-focused blockchain solutions and supply chain management capabilities.
Polkadot (DOT): Since its inception in 2020, it has been hailed as the "Internet of Blockchains," aiming to facilitate interoperability between different blockchain networks.
This article will comprehensively analyze the investment value comparison between VET and DOT, focusing on historical price trends, supply mechanisms, institutional adoption, technological ecosystems, and future predictions, and attempt to answer the question that investors are most concerned about:
"Which is the better buy right now?" I. Price History Comparison and Current Market Status
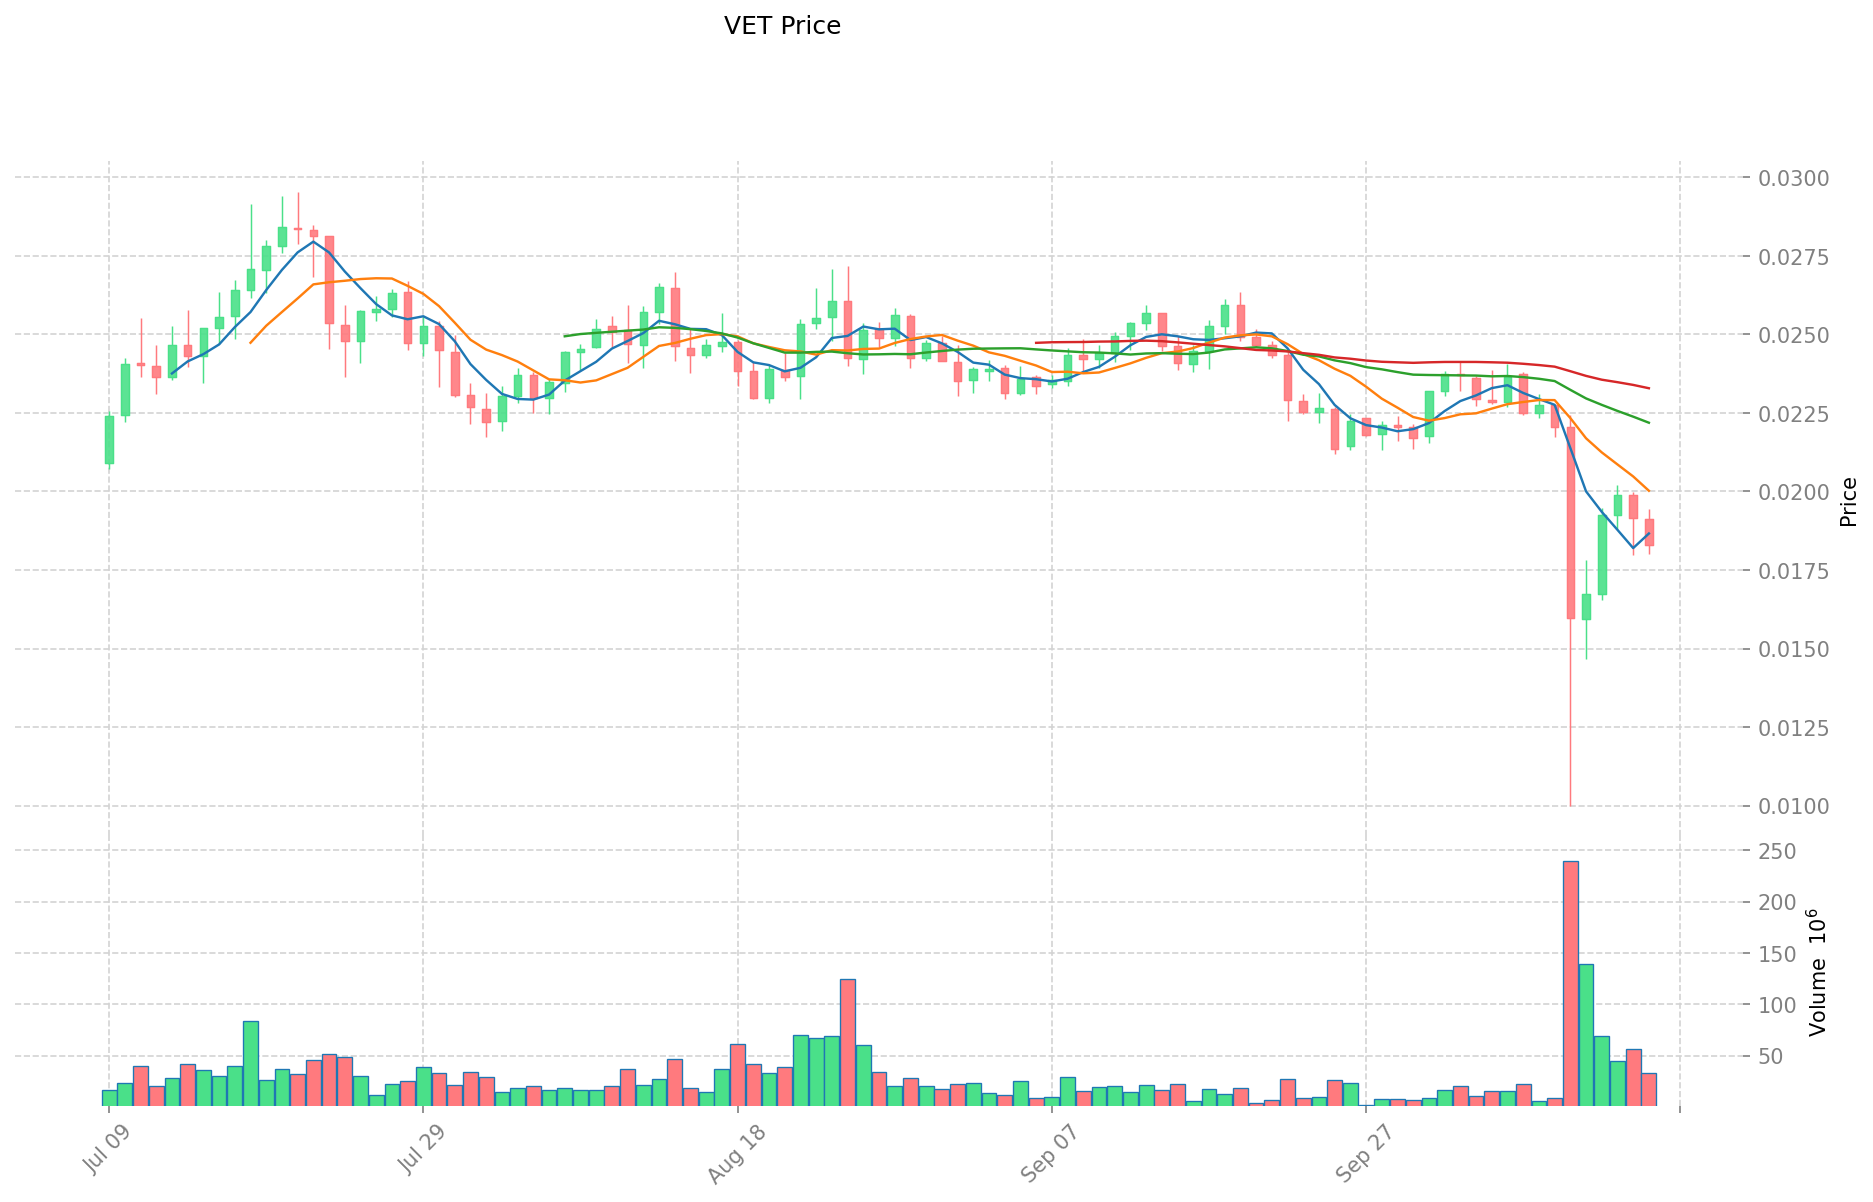
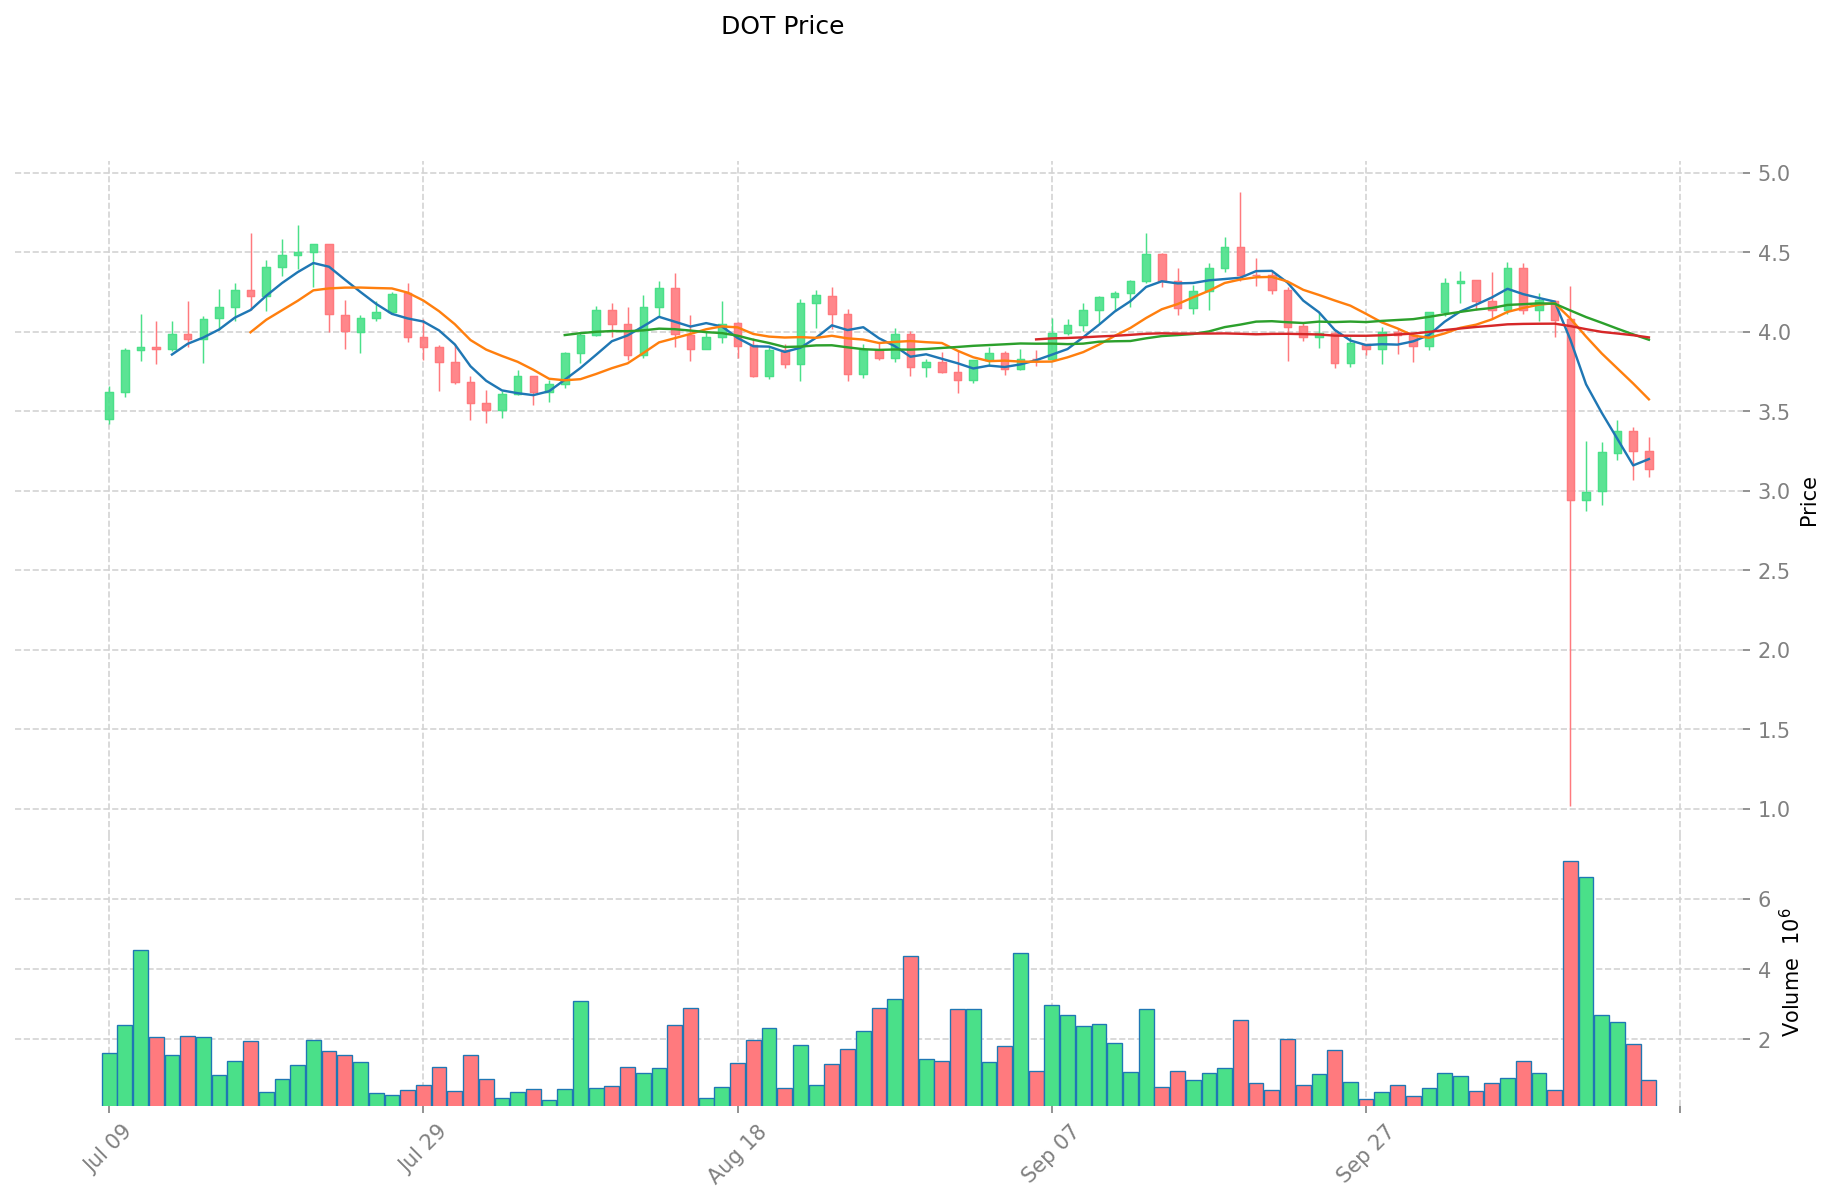
VET and DOT Historical Price Trends
- 2021: VET reached its all-time high of $0.280991 on April 17, 2021.
- 2021: DOT hit its all-time high of $54.98 on November 4, 2021.
- Comparative analysis: During the market cycle, VET dropped from its high of $0.280991 to a low of $0.01823, while DOT fell from $54.98 to $3.134.
Current Market Situation (2025-10-16)
- VET current price: $0.01823
- DOT current price: $3.134
- 24-hour trading volume: VET $610,365,526 vs DOT $2,648,236,648
- Market Sentiment Index (Fear & Greed Index): 34 (Fear)
Click to view real-time prices:
- Check VET current price Market Price
- Check DOT current price Market Price
VET vs DOT: Comparative Investment Analysis
The Core Factors Affecting VET vs DOT Investment Value
Supply Mechanism Comparison (Tokenomics)
- VET: Limited supply model with enterprise-focused distribution strategy
- DOT: Inflationary model with staking rewards to secure the network
- 📌 Historical pattern: VET's price movements have been driven by enterprise adoption milestones, while DOT's value correlates with ecosystem expansion and parachain auctions.
Institutional Adoption and Market Applications
- Institutional holdings: DOT appears in more institutional portfolios due to its infrastructure positioning
- Enterprise adoption: VET leads in supply chain implementations with partners like Walmart and BMW, while DOT focuses on cross-chain interoperability solutions
- Regulatory attitudes: VET benefits from its enterprise focus making it less scrutinized, while DOT's governance model attracts regulatory interest
Technical Development and Ecosystem Building
- VET technical upgrades: Supply chain traceability solutions showing increasing real-world utility despite moderate token price performance
- DOT technical development: Elastic scaling and asynchronous support targeting 623,000 TPS, with Kusama testnet already achieving 143K TPS; Ethereum compatibility via EVM integration
- Ecosystem comparison: VET excels in enterprise applications while DOT focuses on cross-chain communication (XCM protocol) and decentralized governance
Macroeconomic Factors and Market Cycles
- Performance in inflationary environments: Both projects show resilience due to their utility-focused approach
- Macroeconomic monetary policy: Both tokens represent a small market share (DOT at 0.16% of crypto market value) suggesting potential undervaluation
- Geopolitical factors: VET's supply chain focus positions it well for global trade needs, while DOT's interoperability vision addresses cross-border value transfer
III. 2025-2030 Price Prediction: VET vs DOT
Short-term Prediction (2025)
- VET: Conservative $0.0175968 - $0.01833 | Optimistic $0.01833 - $0.0216294
- DOT: Conservative $1.66473 - $3.141 | Optimistic $3.141 - $3.26664
Mid-term Prediction (2027)
- VET may enter a growth phase, with prices estimated at $0.01648525047 - $0.033193274595
- DOT may enter a steady growth phase, with prices estimated at $2.712354012 - $3.790759824
- Key drivers: Institutional capital inflow, ETF, ecosystem development
Long-term Prediction (2030)
- VET: Base scenario $0.020494182689498 - $0.035334797740515 | Optimistic scenario $0.035334797740515 - $0.051235456723746
- DOT: Base scenario $2.68865980236216 - $4.4810996706036 | Optimistic scenario $4.4810996706036 - $6.587216515787292
Disclaimer
VET:
| 年份 | 预测最高价 | 预测平均价格 | 预测最低价 | 涨跌幅 |
|---|---|---|---|---|
| 2025 | 0.0216294 | 0.01833 | 0.0175968 | 0 |
| 2026 | 0.024575031 | 0.0199797 | 0.012986805 | 9 |
| 2027 | 0.033193274595 | 0.0222773655 | 0.01648525047 | 22 |
| 2028 | 0.0299541456513 | 0.0277353200475 | 0.0188600176323 | 52 |
| 2029 | 0.04182486263163 | 0.0288447328494 | 0.016441497724158 | 58 |
| 2030 | 0.051235456723746 | 0.035334797740515 | 0.020494182689498 | 93 |
DOT:
| 年份 | 预测最高价 | 预测平均价格 | 预测最低价 | 涨跌幅 |
|---|---|---|---|---|
| 2025 | 3.26664 | 3.141 | 1.66473 | 0 |
| 2026 | 3.3319728 | 3.20382 | 2.5950942 | 2 |
| 2027 | 3.790759824 | 3.2678964 | 2.712354012 | 4 |
| 2028 | 3.84696764208 | 3.529328112 | 1.9411304616 | 12 |
| 2029 | 5.2740514641672 | 3.68814787704 | 3.0611627379432 | 17 |
| 2030 | 6.587216515787292 | 4.4810996706036 | 2.68865980236216 | 42 |
IV. Investment Strategy Comparison: VET vs DOT
Long-term vs Short-term Investment Strategy
- VET: Suitable for investors focused on enterprise adoption and supply chain solutions
- DOT: Suitable for investors interested in blockchain interoperability and ecosystem growth
Risk Management and Asset Allocation
- Conservative investors: VET 30% vs DOT 70%
- Aggressive investors: VET 60% vs DOT 40%
- Hedging tools: Stablecoin allocation, options, cross-currency portfolios
V. Potential Risk Comparison
Market Risk
- VET: Dependent on enterprise adoption rates and real-world implementation success
- DOT: Vulnerable to competition from other interoperability solutions and market sentiment
Technical Risk
- VET: Scalability, network stability
- DOT: Parachain auction dynamics, cross-chain security
Regulatory Risk
- Global regulatory policies may affect both differently, with VET potentially facing less scrutiny due to its enterprise focus
VI. Conclusion: Which Is the Better Buy?
📌 Investment Value Summary:
- VET advantages: Strong enterprise partnerships, real-world supply chain applications
- DOT advantages: Interoperability focus, potential for ecosystem growth, higher institutional interest
✅ Investment Advice:
- New investors: Consider a balanced approach, leaning towards DOT for its broader ecosystem potential
- Experienced investors: Evaluate based on risk tolerance and belief in enterprise blockchain vs interoperability solutions
- Institutional investors: Consider DOT for its infrastructure play and potential for cross-chain innovations
⚠️ Risk Warning: The cryptocurrency market is highly volatile, and this article does not constitute investment advice. None
VII. FAQ
Q1: What are the main differences between VET and DOT? A: VET focuses on enterprise-level blockchain solutions and supply chain management, while DOT aims to facilitate interoperability between different blockchain networks. VET has a limited supply model, while DOT has an inflationary model with staking rewards.
Q2: Which cryptocurrency has shown better price performance historically? A: DOT reached a higher all-time high of $54.98 in November 2021, compared to VET's all-time high of $0.280991 in April 2021. However, both have experienced significant drops from their peak prices.
Q3: How do VET and DOT compare in terms of institutional adoption? A: DOT appears in more institutional portfolios due to its infrastructure positioning, while VET leads in enterprise adoption with partnerships like Walmart and BMW for supply chain implementations.
Q4: What are the key technical developments for each project? A: VET is focusing on supply chain traceability solutions, showing increasing real-world utility. DOT is developing elastic scaling and asynchronous support, targeting 623,000 TPS, and has implemented Ethereum compatibility via EVM integration.
Q5: How do the long-term price predictions for VET and DOT compare? A: By 2030, VET's base scenario predicts a range of $0.020494182689498 - $0.035334797740515, while DOT's base scenario predicts $2.68865980236216 - $4.4810996706036. The optimistic scenarios for both tokens suggest higher potential gains.
Q6: What are the main risks associated with investing in VET and DOT? A: VET risks include dependence on enterprise adoption rates and real-world implementation success. DOT faces risks from competition in the interoperability space and market sentiment. Both are subject to general market volatility and potential regulatory challenges.
Q7: How should investors approach asset allocation between VET and DOT? A: Conservative investors might consider allocating 30% to VET and 70% to DOT, while aggressive investors might opt for 60% VET and 40% DOT. The exact allocation should be based on individual risk tolerance and belief in enterprise blockchain versus interoperability solutions.