UMA vs XLM: A Comparative Analysis of Decentralized Oracle Solutions in DeFi
Introduction: UMA vs XLM Investment Comparison
In the cryptocurrency market, the comparison between UMA and XLM has always been an unavoidable topic for investors. The two not only show significant differences in market cap ranking, application scenarios, and price performance but also represent different positioning in the crypto asset space.
UMA (UMA): Since its launch in 2020, it has gained market recognition for its decentralized financial contract platform.
Stellar (XLM): Launched in 2014, it has been hailed as a decentralized gateway for transmitting digital and fiat currencies, facilitating rapid and low-cost transfers between banks, payment institutions, and individuals.
This article will comprehensively analyze the investment value comparison between UMA and XLM, focusing on historical price trends, supply mechanisms, institutional adoption, technological ecosystems, and future predictions, attempting to answer the question investors care about most:
"Which is the better buy right now?"
I. Price History Comparison and Current Market Status
UMA and XLM Historical Price Trends
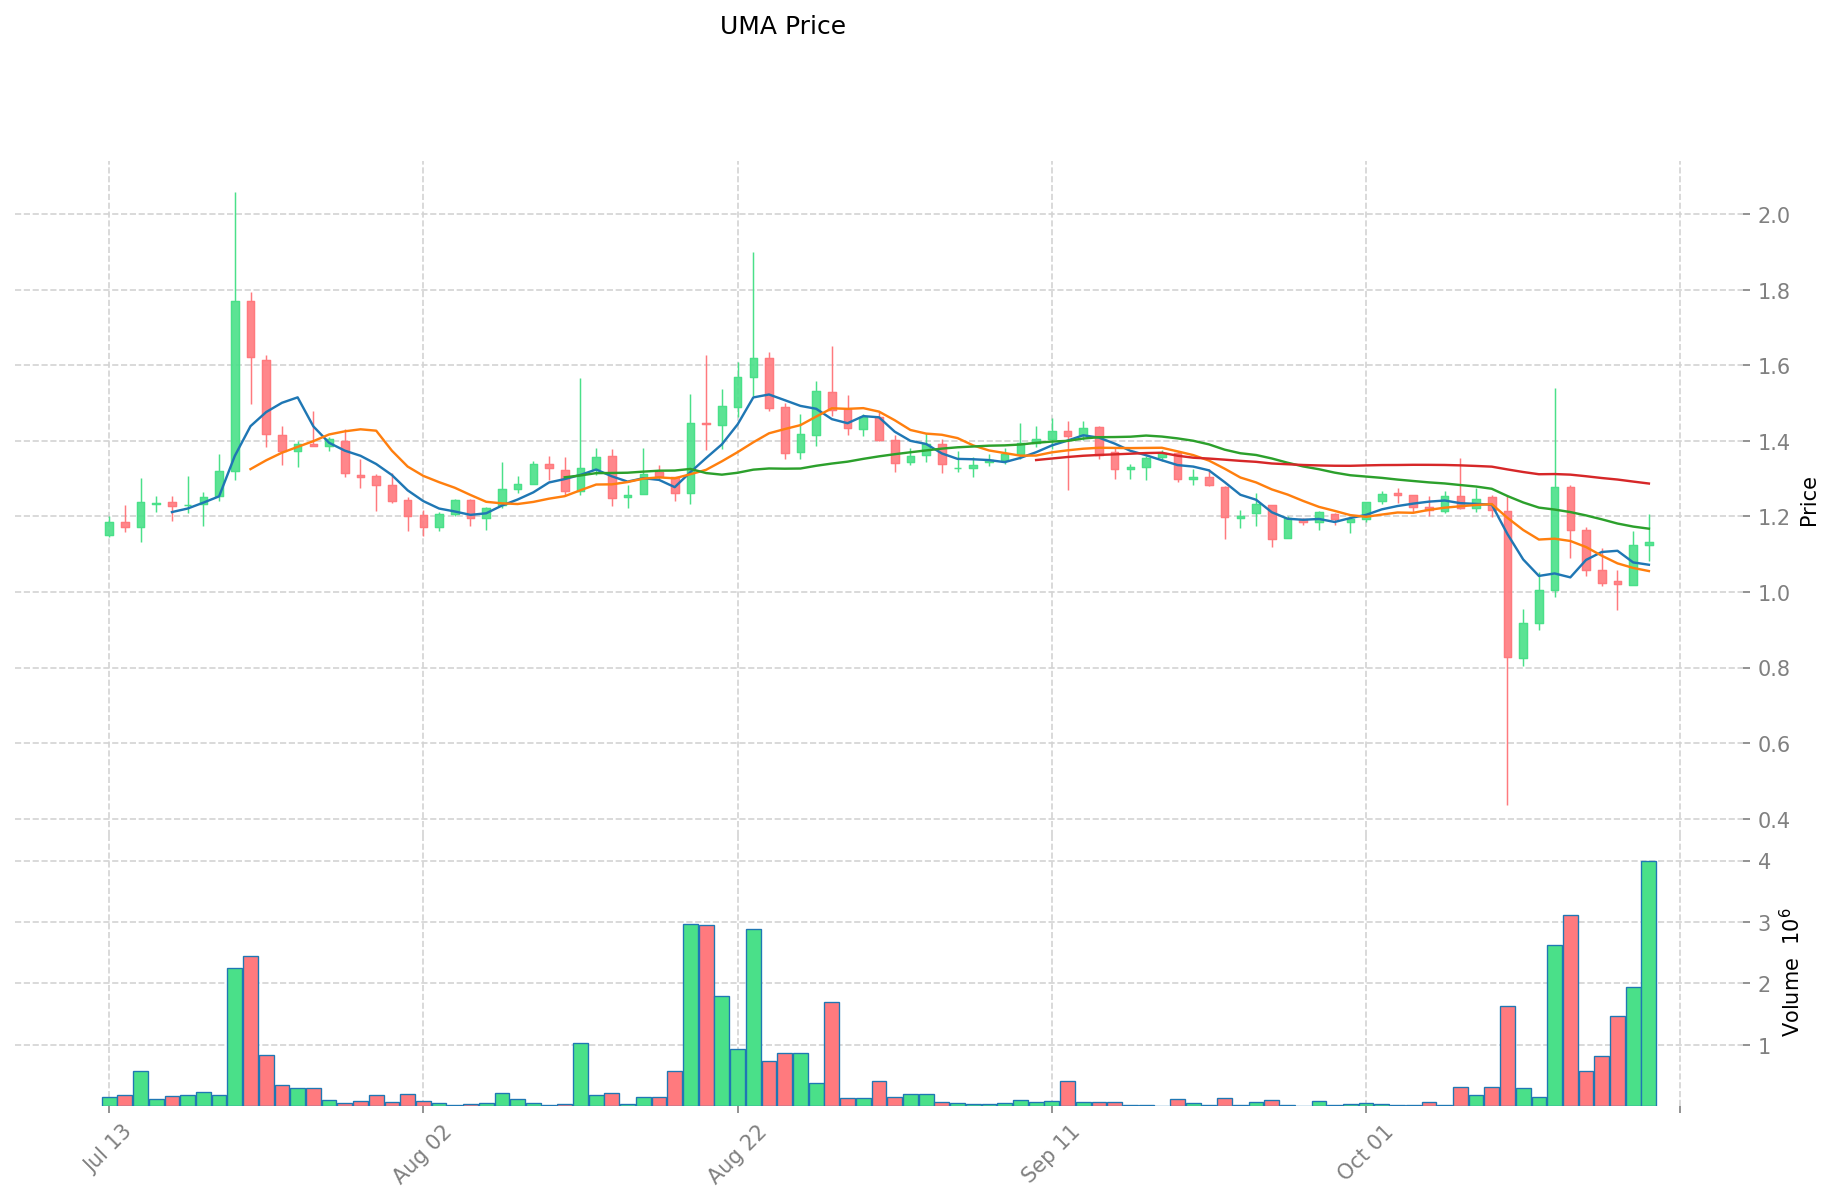
- 2021: UMA reached its all-time high of $41.56 on February 4, 2021.
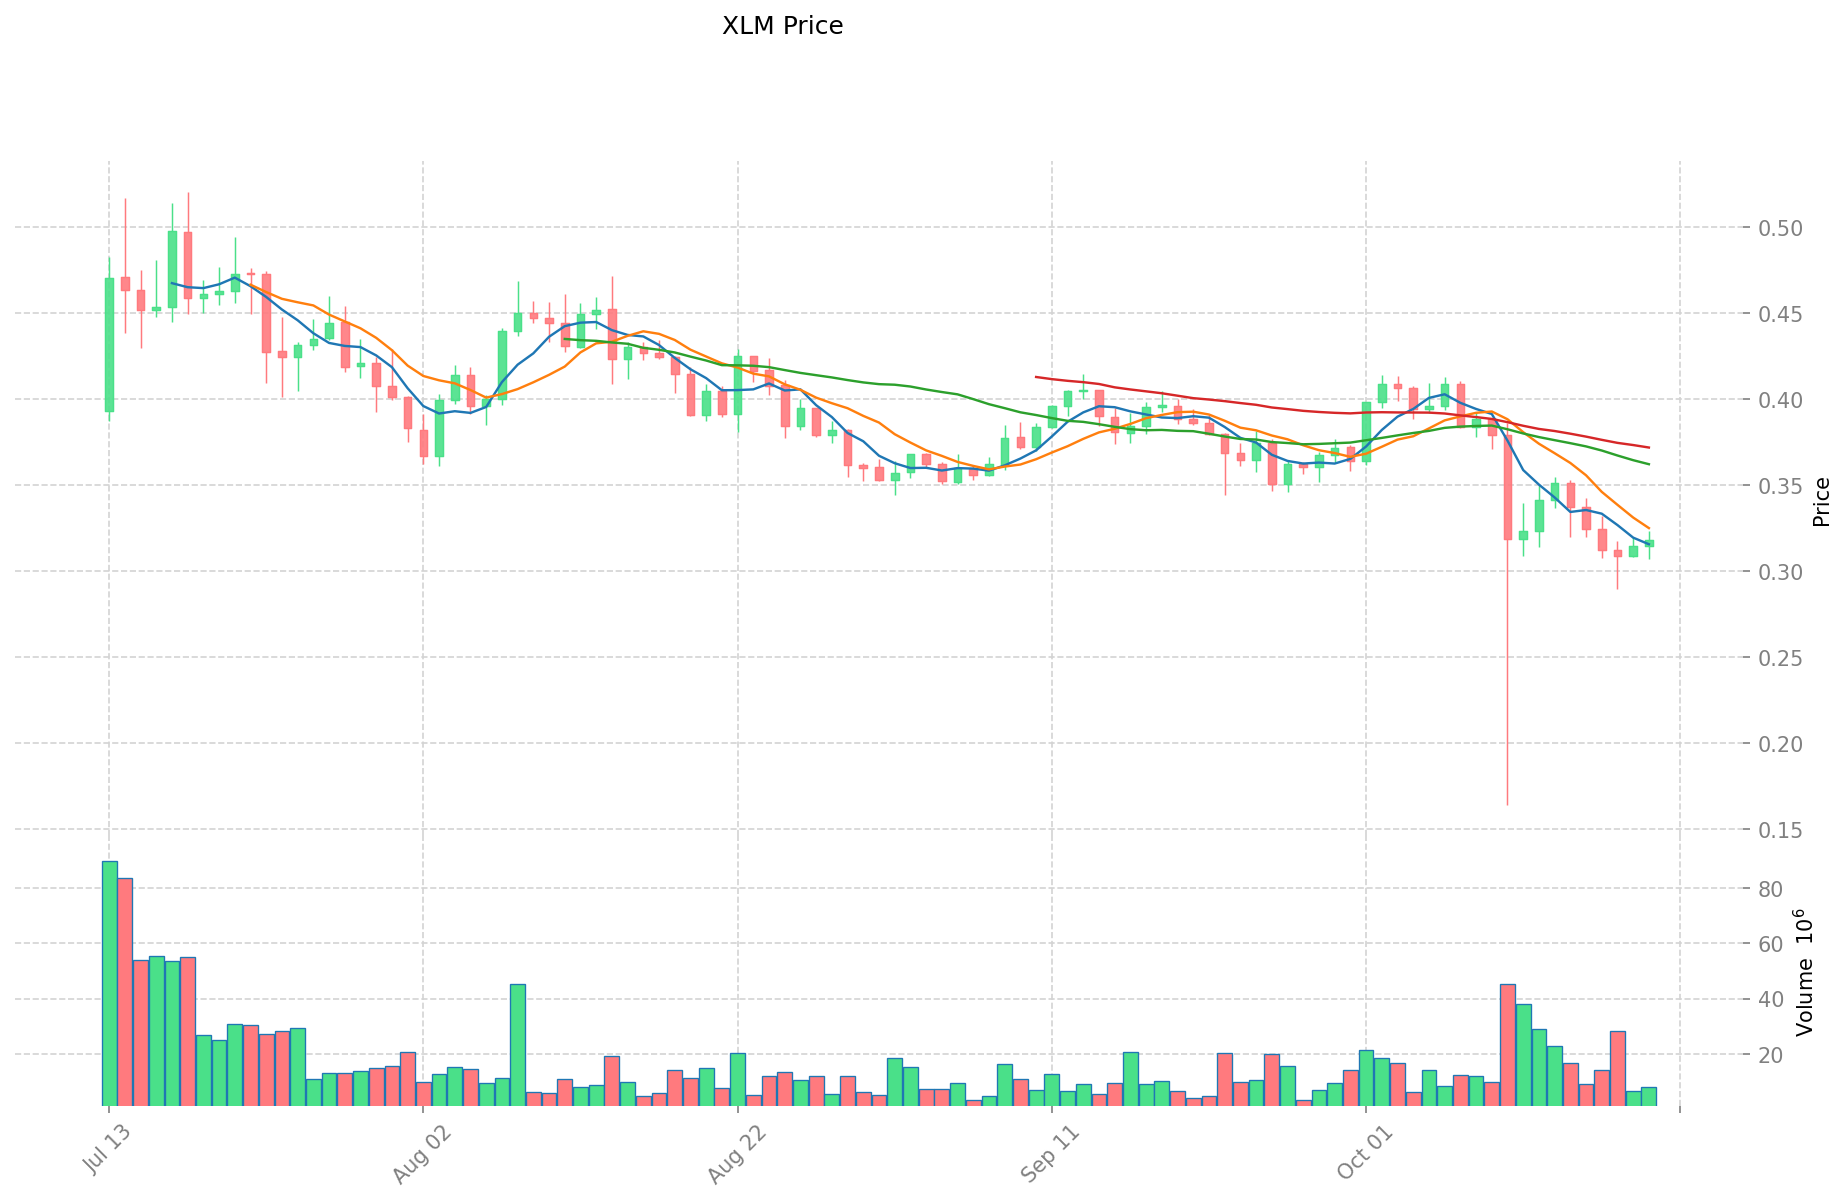
- 2018: XLM hit its all-time high of $0.875563 on January 3, 2018.
- Comparative analysis: UMA has experienced a significant decline from its all-time high, currently trading at $1.13. XLM has also seen a substantial drop from its peak, now trading at $0.31426.
Current Market Situation (2025-10-20)
- UMA current price: $1.13
- XLM current price: $0.31426
- 24-hour trading volume: UMA $4,617,213.73 vs XLM $2,506,555.24
- Market Sentiment Index (Fear & Greed Index): 29 (Fear)
Click to view real-time prices:
- Check UMA's current price Market Price
- Check XLM's current price Market Price
II. Key Factors Affecting Investment Value of UMA vs XLM
Supply Mechanism Comparison (Tokenomics)
- UMA: Maximum supply capped at 101,172,570 UMA tokens with a burning mechanism for inefficient oracle disputes
- XLM: Fixed initial supply of 100 billion XLM, with 50% distributed through airdrops and partnerships, while the Stellar Development Foundation manages the remaining portion
- 📌 Historical Pattern: UMA's capped supply and burning mechanism theoretically create more scarcity over time, while XLM's fixed supply with controlled distribution focuses on ecosystem development rather than artificial scarcity.
Institutional Adoption and Market Applications
- Institutional Holdings: XLM has gained more institutional traction through partnerships with IBM, MoneyGram, and various financial institutions focused on cross-border payments
- Enterprise Adoption: XLM excels in cross-border payments and settlements with its focus on financial inclusion, while UMA's optimistic oracle system serves more specialized DeFi applications
- Regulatory Attitudes: XLM generally enjoys more favorable regulatory perception as Stellar works closely with traditional financial institutions, while UMA faces the broader regulatory scrutiny common to DeFi protocols
Technical Development and Ecosystem Building
- UMA Technical Upgrades: Focuses on optimistic oracle infrastructure and economic guarantees for derivatives and synthetic assets
- XLM Technical Development: Continuous improvements to the Stellar Consensus Protocol (SCP) and transaction efficiency for global payments
- Ecosystem Comparison: UMA specializes in DeFi applications requiring trustless price feeds and derivatives, while XLM has broader adoption in payment applications, remittances, and stablecoin infrastructure
Macroeconomic Factors and Market Cycles
- Inflation Environment Performance: UMA's limited supply potentially offers better inflation resistance, while XLM's value proposition lies in efficiency rather than scarcity
- Macroeconomic Monetary Policy: Both are affected by interest rate changes and dollar strength, with XLM potentially more sensitive to changes in cross-border payment flows
- Geopolitical Factors: XLM benefits from increasing demand for alternative cross-border payment rails, while UMA's value depends more on DeFi adoption and regulatory clarity for decentralized derivatives
III. 2025-2030 Price Prediction: UMA vs XLM
Short-term Prediction (2025)
- UMA: Conservative $1.09-$1.14 | Optimistic $1.14-$1.50
- XLM: Conservative $0.30-$0.31 | Optimistic $0.31-$0.33
Mid-term Prediction (2027)
- UMA may enter a growth phase, with expected price range of $1.17-$2.07
- XLM may enter a moderate growth phase, with expected price range of $0.20-$0.52
- Key drivers: Institutional fund inflows, ETFs, ecosystem development
Long-term Prediction (2030)
- UMA: Base scenario $1.98-$2.12 | Optimistic scenario $2.12-$3.08
- XLM: Base scenario $0.38-$0.55 | Optimistic scenario $0.55-$0.69
Disclaimer
UMA:
| 年份 | 预测最高价 | 预测平均价格 | 预测最低价 | 涨跌幅 |
|---|---|---|---|---|
| 2025 | 1.49952 | 1.136 | 1.09056 | 0 |
| 2026 | 1.5417792 | 1.31776 | 1.1464512 | 16 |
| 2027 | 2.07316592 | 1.4297696 | 1.172411072 | 26 |
| 2028 | 2.276908088 | 1.75146776 | 1.6814090496 | 54 |
| 2029 | 2.23574859564 | 2.014187924 | 1.18837087516 | 78 |
| 2030 | 3.081203976739 | 2.12496825982 | 1.9762204816326 | 88 |
XLM:
| 年份 | 预测最高价 | 预测平均价格 | 预测最低价 | 涨跌幅 |
|---|---|---|---|---|
| 2025 | 0.3328294 | 0.31399 | 0.2982905 | 0 |
| 2026 | 0.456007677 | 0.3234097 | 0.294302827 | 2 |
| 2027 | 0.52220964259 | 0.3897086885 | 0.198751431135 | 24 |
| 2028 | 0.58818732355305 | 0.455959165545 | 0.3191714158815 | 45 |
| 2029 | 0.574280569003927 | 0.522073244549025 | 0.308023214283924 | 66 |
| 2030 | 0.69070290253836 | 0.548176906776476 | 0.383723834743533 | 74 |
IV. Investment Strategy Comparison: UMA vs XLM
Long-term vs Short-term Investment Strategies
- UMA: Suitable for investors focused on DeFi innovation and derivative markets
- XLM: Suitable for investors interested in cross-border payment solutions and financial inclusion
Risk Management and Asset Allocation
- Conservative investors: UMA: 30% vs XLM: 70%
- Aggressive investors: UMA: 60% vs XLM: 40%
- Hedging tools: Stablecoin allocation, options, cross-currency portfolios
V. Potential Risk Comparison
Market Risk
- UMA: Higher volatility due to smaller market cap and DeFi sector fluctuations
- XLM: Exposed to competition in the cross-border payment industry
Technical Risk
- UMA: Scalability, network stability
- XLM: Network congestion during high-volume periods, potential vulnerabilities in the consensus mechanism
Regulatory Risk
- Global regulatory policies may have differing impacts on both assets, with XLM potentially facing less scrutiny due to its focus on traditional finance integration
VI. Conclusion: Which Is the Better Buy?
📌 Investment Value Summary:
- UMA advantages: Innovative DeFi applications, limited supply with burning mechanism
- XLM advantages: Established partnerships, focus on real-world payment solutions
✅ Investment Advice:
- New investors: Consider a higher allocation to XLM due to its more established ecosystem and partnerships
- Experienced investors: Balanced portfolio with both UMA and XLM to capture DeFi and payment sector growth
- Institutional investors: XLM may be more attractive due to its regulatory-friendly approach and institutional partnerships
⚠️ Risk warning: The cryptocurrency market is highly volatile, and this article does not constitute investment advice. None
VII. FAQ
Q1: What are the main differences between UMA and XLM? A: UMA is a decentralized financial contract platform focusing on DeFi applications, while XLM is a decentralized gateway for transmitting digital and fiat currencies, facilitating rapid and low-cost transfers between banks, payment institutions, and individuals.
Q2: Which cryptocurrency has performed better historically? A: UMA reached its all-time high of $41.56 in February 2021, while XLM hit its all-time high of $0.875563 in January 2018. Both have experienced significant declines since their peaks, with UMA currently trading at $1.13 and XLM at $0.31426.
Q3: How do the supply mechanisms of UMA and XLM differ? A: UMA has a maximum supply capped at 101,172,570 tokens with a burning mechanism, while XLM has a fixed initial supply of 100 billion tokens with 50% distributed through airdrops and partnerships.
Q4: Which cryptocurrency has greater institutional adoption? A: XLM has gained more institutional traction through partnerships with IBM, MoneyGram, and various financial institutions focused on cross-border payments.
Q5: What are the long-term price predictions for UMA and XLM? A: By 2030, UMA is predicted to reach $1.98-$3.08 in optimistic scenarios, while XLM is expected to reach $0.38-$0.69.
Q6: How should investors allocate their portfolios between UMA and XLM? A: Conservative investors might consider allocating 30% to UMA and 70% to XLM, while aggressive investors might opt for 60% UMA and 40% XLM.
Q7: What are the main risks associated with investing in UMA and XLM? A: UMA faces higher volatility due to its smaller market cap and DeFi sector fluctuations, while XLM is exposed to competition in the cross-border payment industry. Both face technical and regulatory risks, with XLM potentially facing less regulatory scrutiny.
Share
Content