OSMO vs AAVE: A Comparative Analysis of Two Leading DeFi Protocols
Introduction: OSMO vs AAVE Investment Comparison
In the cryptocurrency market, the comparison between Osmosis (OSMO) and AAVE (AAVE) has been an unavoidable topic for investors. The two not only show significant differences in market cap ranking, application scenarios, and price performance, but also represent different positions in the crypto asset landscape.
Osmosis (OSMO): Launched in 2021, it has gained market recognition for its advanced AMM protocol built on the Cosmos SDK.
AAVE (AAVE): Since its introduction in 2020, it has been hailed as a leading decentralized lending protocol, becoming one of the most traded and highest market cap cryptocurrencies globally.
This article will comprehensively analyze the investment value comparison between OSMO and AAVE, focusing on historical price trends, supply mechanisms, institutional adoption, technological ecosystems, and future predictions, attempting to answer the question investors are most concerned about:
"Which is the better buy right now?"
I. Price History Comparison and Current Market Status
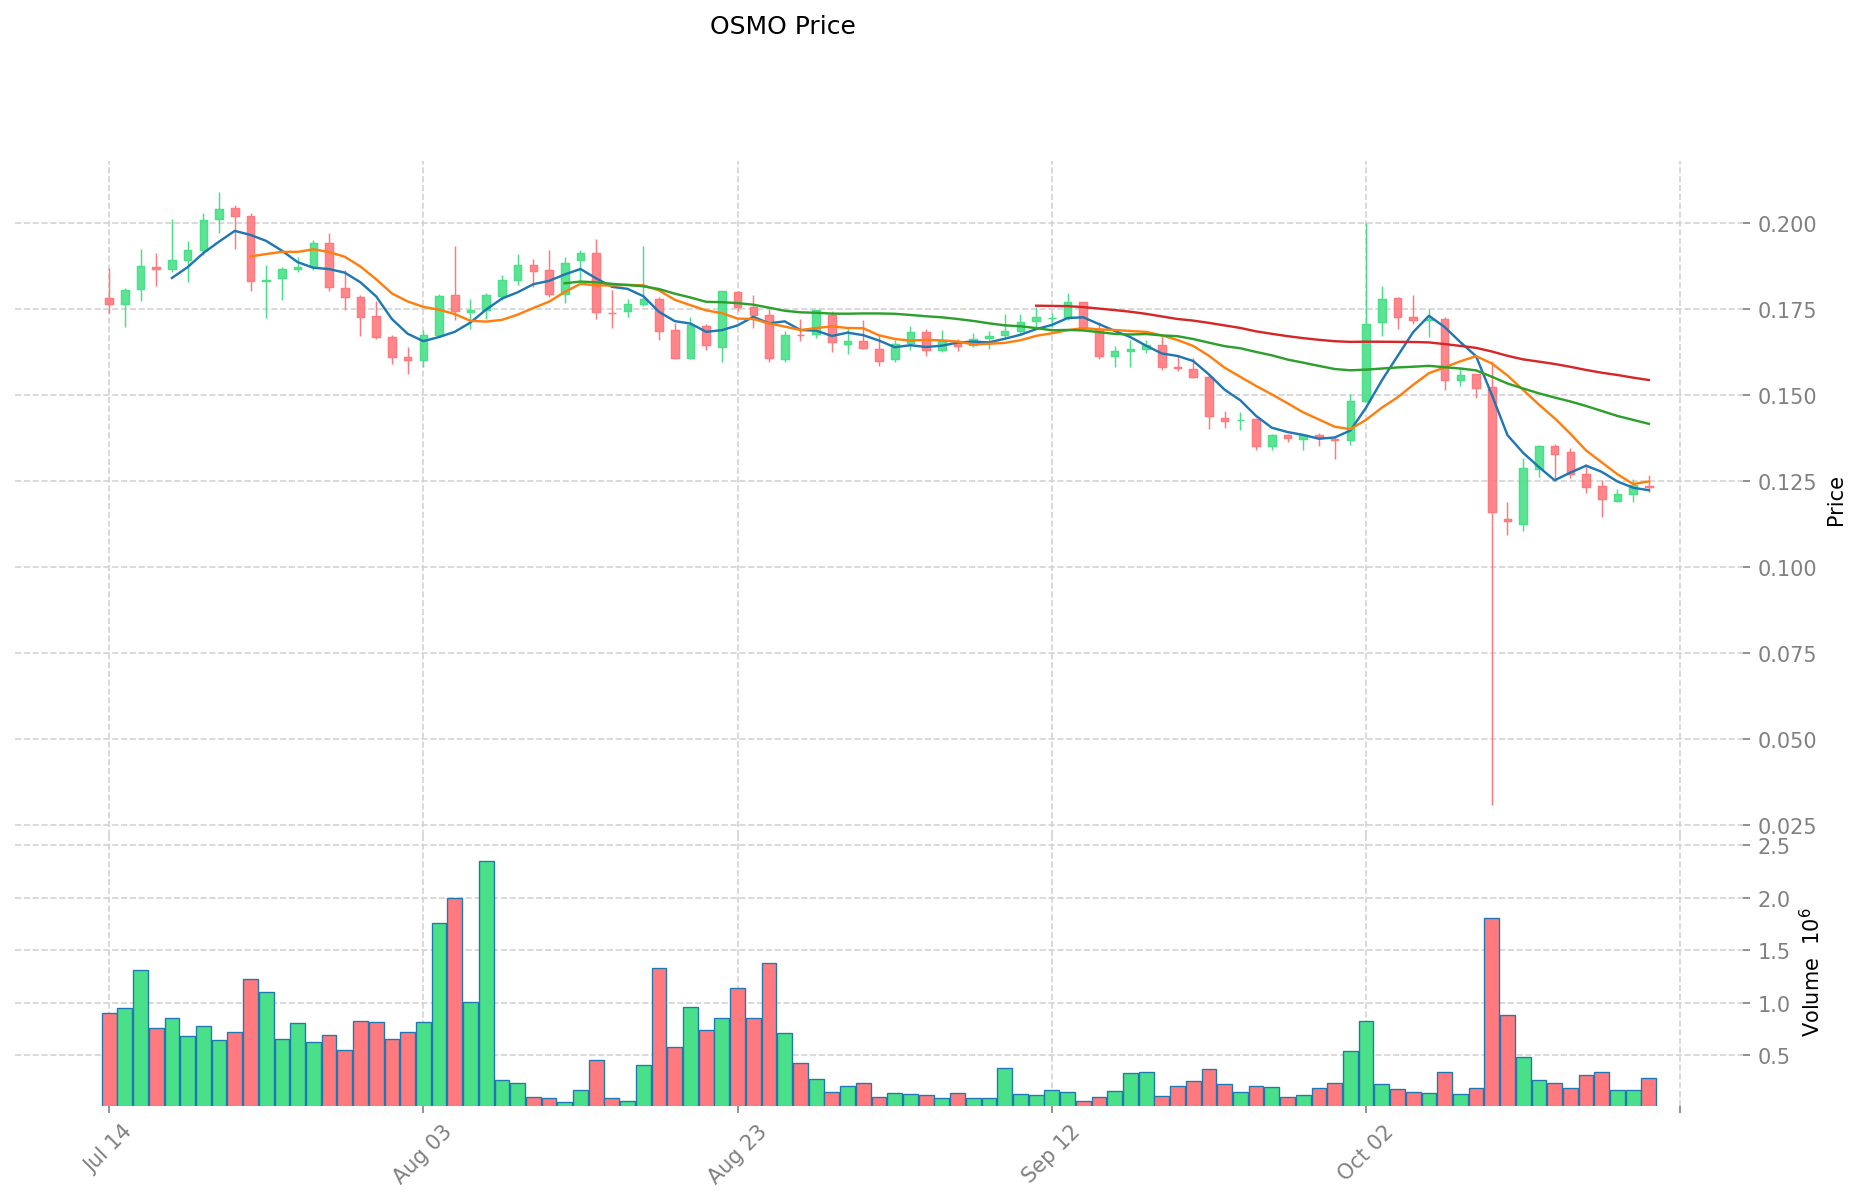
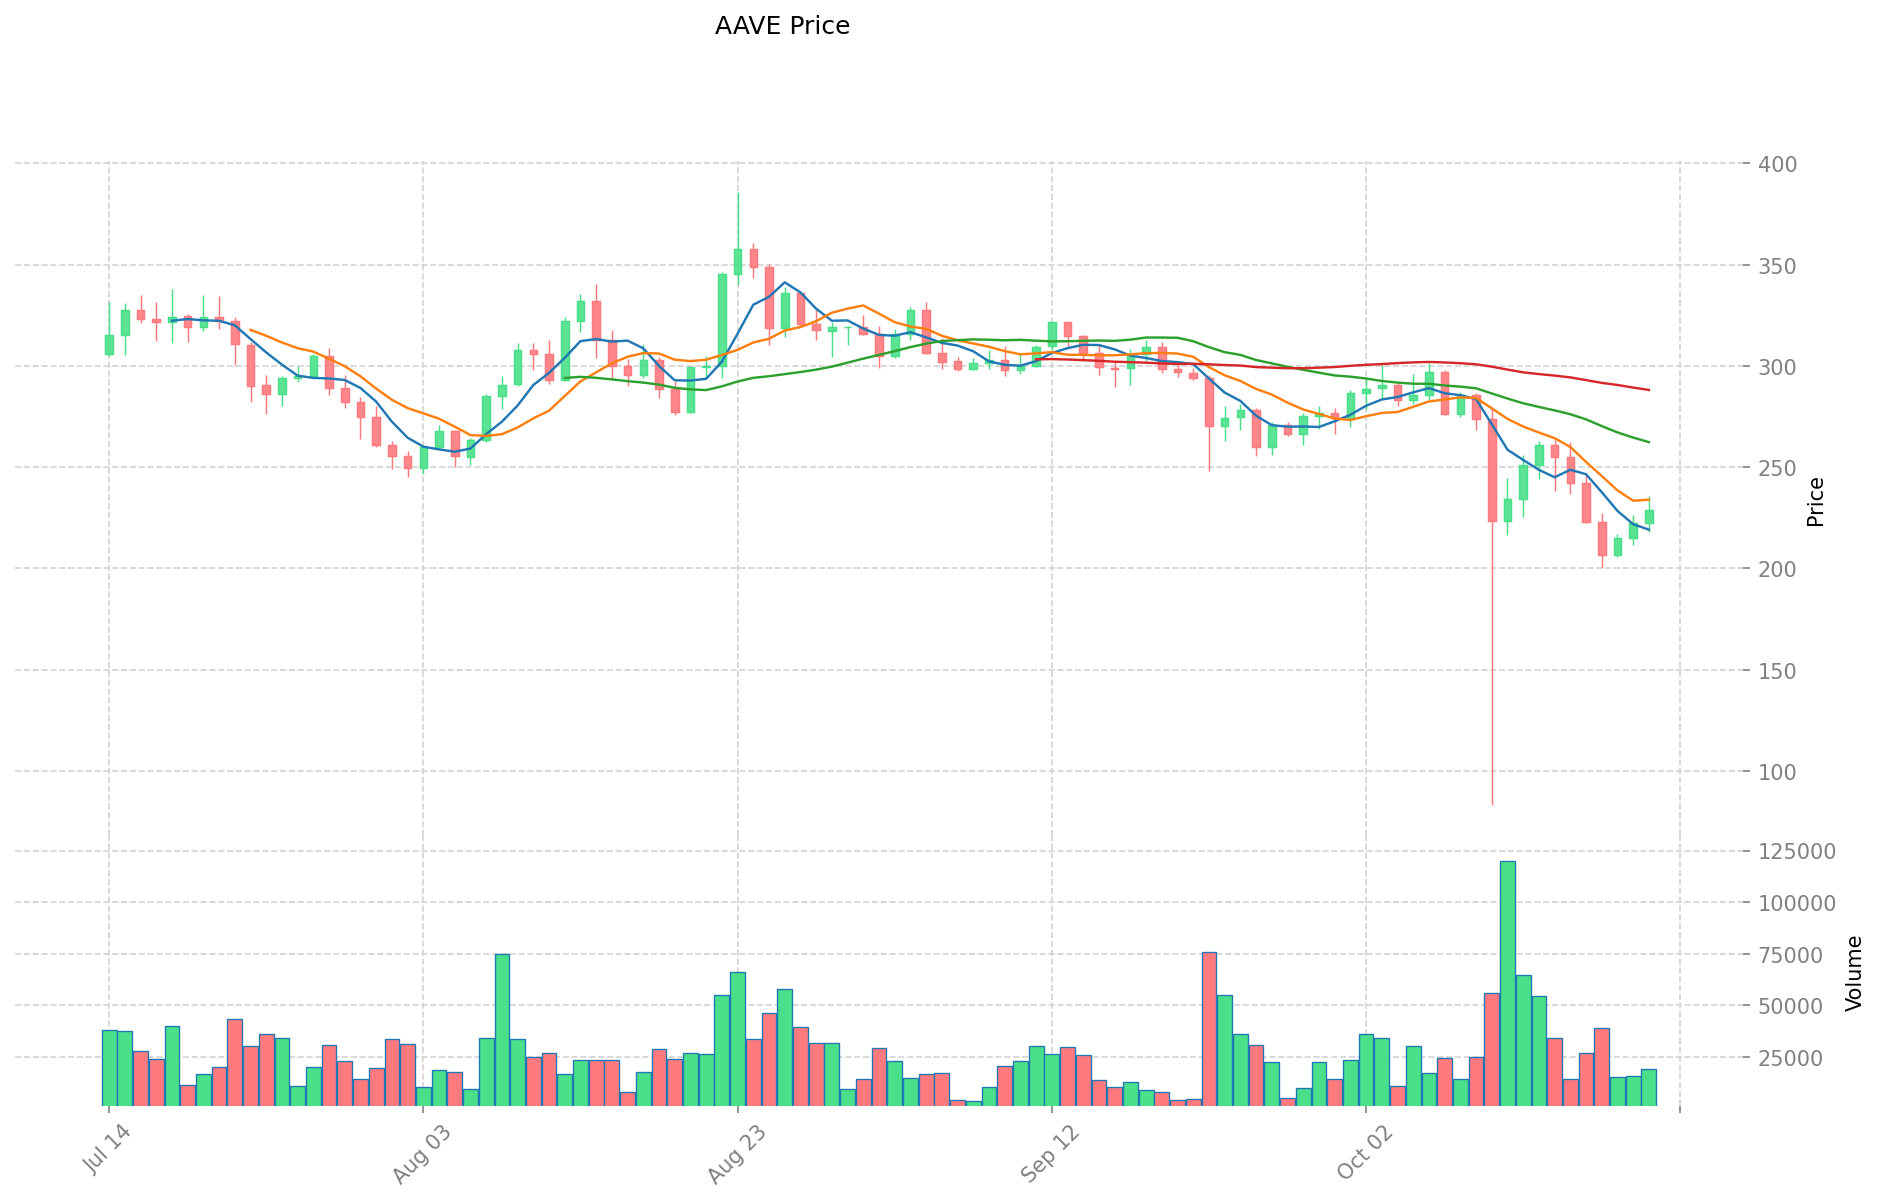
OSMO and AAVE Historical Price Trends
- 2021: OSMO launched and saw significant price growth due to the rising popularity of DeFi platforms.
- 2021: AAVE reached its all-time high of $661.69 on May 18, driven by the DeFi boom.
- Comparative analysis: During the 2022 crypto market downturn, OSMO dropped from its high of $11.25 to a low of $0.108039, while AAVE showed more resilience, maintaining a higher price level.
Current Market Situation (2025-10-21)
- OSMO current price: $0.1233
- AAVE current price: $228.85
- 24-hour trading volume: OSMO $35,167.78 vs AAVE $4,401,369.71
- Market sentiment index (Fear & Greed Index): 29 (Fear)
Click to view real-time prices:
- Check OSMO current price Market Price
- Check AAVE current price Market Price
II. Core Factors Affecting OSMO vs AAVE Investment Value
Supply Mechanisms Comparison (Tokenomics)
- OSMO: Tied to the Cosmos ecosystem with high dependence on ATOM for liquidity
- AAVE: Operates within the DeFi lending platform framework
- 📌 Historical Pattern: Supply mechanisms in both tokens drive price cycles based on their respective ecosystem activities.
Institutional Adoption and Market Applications
- Institutional Holdings: Information not available in the reference material
- Enterprise Adoption: OSMO relies on Cosmos ecosystem integration while AAVE depends on DeFi lending platform adoption
- Regulatory Attitudes: Information not available in the reference material
Technical Development and Ecosystem Building
- OSMO Technical Upgrades: Focused on enhancing the Cosmos DeFi landscape
- AAVE Technical Development: Centered on improving DeFi lending capabilities
- Ecosystem Comparison: OSMO is more integrated within the Cosmos ecosystem with concentration in its native asset, while AAVE serves the broader DeFi lending market
Macroeconomic Factors and Market Cycles
- Performance in Inflationary Environments: Information not available in the reference material
- Macroeconomic Monetary Policy: Information not available in the reference material
- Geopolitical Factors: Information not available in the reference material
III. 2025-2030 Price Prediction: OSMO vs AAVE
Short-term Prediction (2025)
- OSMO: Conservative $0.071 - $0.123 | Optimistic $0.123 - $0.158
- AAVE: Conservative $185.21 - $228.66 | Optimistic $228.66 - $324.70
Mid-term Prediction (2027)
- OSMO may enter a growth phase, with prices expected in the range of $0.154 - $0.216
- AAVE may enter a bullish market, with prices expected in the range of $272.00 - $456.46
- Key drivers: Institutional capital inflow, ETF, ecosystem development
Long-term Prediction (2030)
- OSMO: Base scenario $0.224 - $0.252 | Optimistic scenario $0.252 - $0.322
- AAVE: Base scenario $435.27 - $558.04 | Optimistic scenario $558.04 - $703.13
Disclaimer: This analysis is based on historical data and market projections. Cryptocurrency markets are highly volatile and unpredictable. This information should not be considered as financial advice. Always conduct your own research before making any investment decisions.
OSMO:
| 年份 | 预测最高价 | 预测平均价格 | 预测最低价 | 涨跌幅 |
|---|---|---|---|---|
| 2025 | 0.157824 | 0.1233 | 0.071514 | 0 |
| 2026 | 0.20522052 | 0.140562 | 0.07449786 | 14 |
| 2027 | 0.216114075 | 0.17289126 | 0.1538732214 | 40 |
| 2028 | 0.219788014275 | 0.1945026675 | 0.11281154715 | 57 |
| 2029 | 0.296217837469125 | 0.2071453408875 | 0.1408588318035 | 68 |
| 2030 | 0.32215243414824 | 0.251681589178312 | 0.223996614368698 | 104 |
AAVE:
| 年份 | 预测最高价 | 预测平均价格 | 预测最低价 | 涨跌幅 |
|---|---|---|---|---|
| 2025 | 324.6972 | 228.66 | 185.2146 | 0 |
| 2026 | 348.615036 | 276.6786 | 260.077884 | 20 |
| 2027 | 456.46435428 | 312.646818 | 272.00273166 | 36 |
| 2028 | 565.2967116258 | 384.55558614 | 326.872248219 | 68 |
| 2029 | 641.150300991915 | 474.9261488829 | 242.212335930279 | 107 |
| 2030 | 703.12816342113345 | 558.0382249374075 | 435.26981545117785 | 143 |
IV. Investment Strategy Comparison: OSMO vs AAVE
Long-term vs Short-term Investment Strategy
- OSMO: Suitable for investors focused on Cosmos ecosystem growth and DeFi potential
- AAVE: Suitable for investors seeking established DeFi lending platforms and broader market exposure
Risk Management and Asset Allocation
- Conservative investors: OSMO: 20% vs AAVE: 80%
- Aggressive investors: OSMO: 40% vs AAVE: 60%
- Hedging tools: Stablecoin allocation, options, cross-token portfolio
V. Potential Risk Comparison
Market Risk
- OSMO: Higher volatility due to smaller market cap and ecosystem dependency
- AAVE: Exposure to overall DeFi market fluctuations
Technical Risk
- OSMO: Scalability, network stability within Cosmos ecosystem
- AAVE: Smart contract vulnerabilities, platform security
Regulatory Risk
- Global regulatory policies may impact both tokens differently, with DeFi platforms potentially facing more scrutiny
VI. Conclusion: Which Is the Better Buy?
📌 Investment Value Summary:
- OSMO advantages: Strong potential within Cosmos ecosystem, lower entry point
- AAVE advantages: Established DeFi lending platform, higher market cap and liquidity
✅ Investment Advice:
- New investors: Consider a small allocation to AAVE for exposure to established DeFi platforms
- Experienced investors: Balanced portfolio with both OSMO and AAVE, adjusting based on risk tolerance
- Institutional investors: Focus on AAVE for its higher liquidity and established market position
⚠️ Risk Warning: The cryptocurrency market is highly volatile. This article does not constitute investment advice. None
VII. FAQ
Q1: What are the main differences between OSMO and AAVE? A: OSMO is part of the Cosmos ecosystem focusing on AMM protocols, while AAVE is a leading decentralized lending platform. OSMO has a smaller market cap and is more volatile, whereas AAVE is more established with higher liquidity.
Q2: Which token has shown better price performance historically? A: AAVE has demonstrated more resilience during market downturns. During the 2022 crypto market crash, AAVE maintained a higher price level compared to OSMO, which experienced a more significant drop from its all-time high.
Q3: How do the supply mechanisms differ between OSMO and AAVE? A: OSMO's supply is tied to the Cosmos ecosystem and highly dependent on ATOM for liquidity. AAVE's supply mechanism operates within the framework of its DeFi lending platform.
Q4: What are the price predictions for OSMO and AAVE by 2030? A: By 2030, OSMO is predicted to reach $0.224 - $0.322 in an optimistic scenario, while AAVE is expected to reach $558.04 - $703.13 in an optimistic scenario.
Q5: How should investors allocate their portfolio between OSMO and AAVE? A: Conservative investors might consider allocating 20% to OSMO and 80% to AAVE, while more aggressive investors could opt for 40% OSMO and 60% AAVE. The exact allocation should be based on individual risk tolerance and investment goals.
Q6: What are the main risks associated with investing in OSMO and AAVE? A: OSMO faces higher volatility due to its smaller market cap and ecosystem dependency. AAVE is exposed to overall DeFi market fluctuations. Both tokens may face regulatory risks, with DeFi platforms potentially facing more scrutiny.
Q7: Which token is better suited for different types of investors? A: New investors might consider AAVE for exposure to established DeFi platforms. Experienced investors could balance their portfolio with both OSMO and AAVE. Institutional investors may focus on AAVE due to its higher liquidity and established market position.
Share
Content