ONE ve NEAR: Ölçeklenebilir DApp geliştirme için iki blockchain platformunun karşılaştırılması


Giriş: ONE ve NEAR Yatırım Karşılaştırması
Kripto para piyasasında Harmony (ONE) ile NEAR (NEAR) karşılaştırması, yatırımcıların göz ardı edemeyeceği bir başlık olarak öne çıkıyor. İki varlık, hem piyasa değeri sıralaması, kullanım alanları ve fiyat performansı bakımından belirgin farklılıklar gösteriyor hem de kripto para varlıklarının konumlandırılması açısından farklı yaklaşımlar sunuyor.
Harmony (ONE): 2019 yılındaki çıkışından bu yana, parçalama teknolojisine dayalı yüksek ölçeklenebilirliği ve güvenliğiyle piyasada kabul görmüştür.
NEAR (NEAR): 2020’de piyasaya sürülen NEAR, mobil cihazlarda DApp işlemlerine hızlı destek sunan, yüksek ölçeklenebilirliğe sahip bir temel protokol olarak değer kazanmıştır.
Bu makalede, Harmony ve NEAR yatırım değerleri karşılaştırmalı olarak; tarihsel fiyat hareketleri, arz mekanizmaları, kurumsal benimsenme, teknolojik ekosistemler ve gelecek öngörüleri üzerinden kapsamlı biçimde analiz edilerek, yatırımcıların en çok merak ettiği şu soruya yanıt aranmaktadır:
"Şu anda hangisi daha iyi bir alım?"
I. Fiyat Geçmişi Karşılaştırması ve Mevcut Piyasa Durumu
ONE (Coin A) ve NEAR (Coin B) Tarihsel Fiyat Eğilimleri
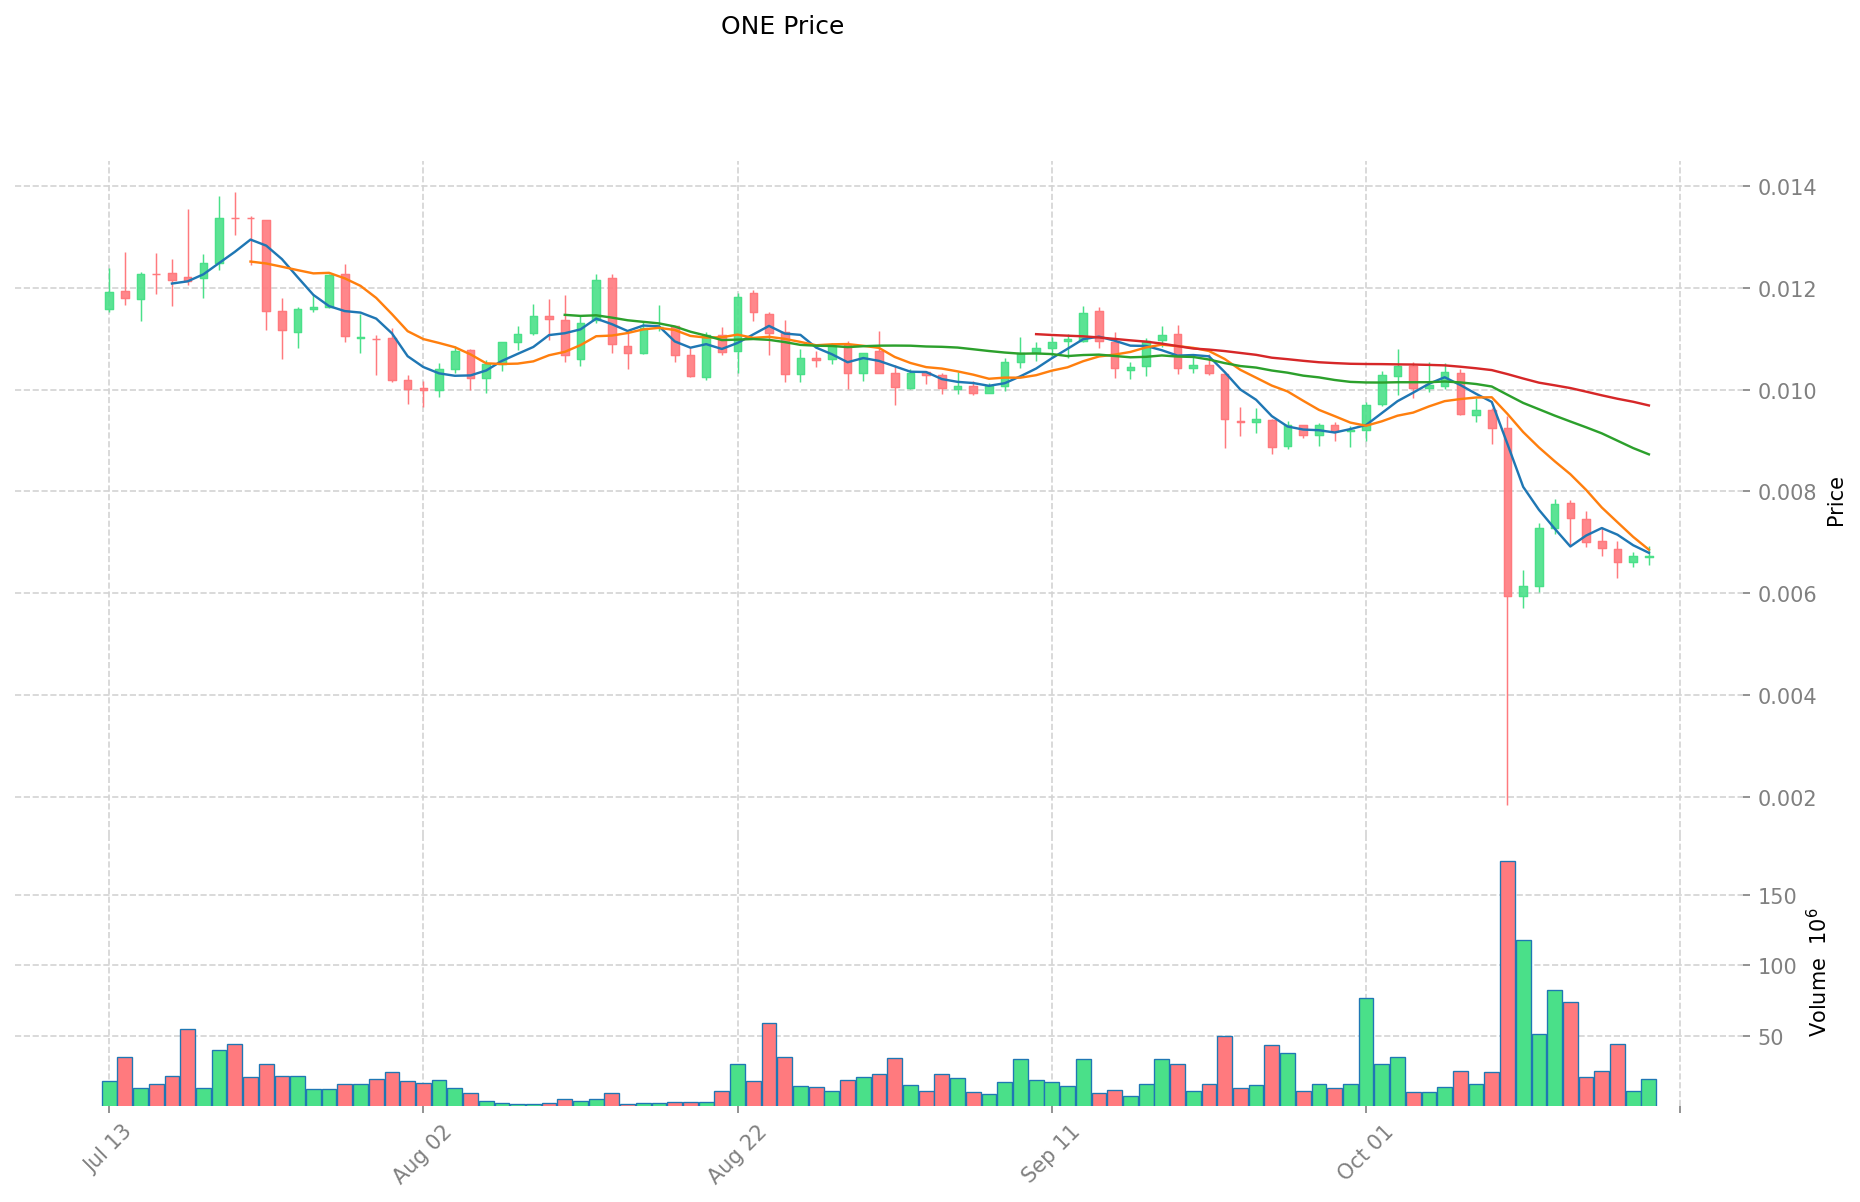
- 2021: ONE, 26 Ekim 2021’de 0,37902 $ ile tüm zamanların en yüksek seviyesine ulaştı.
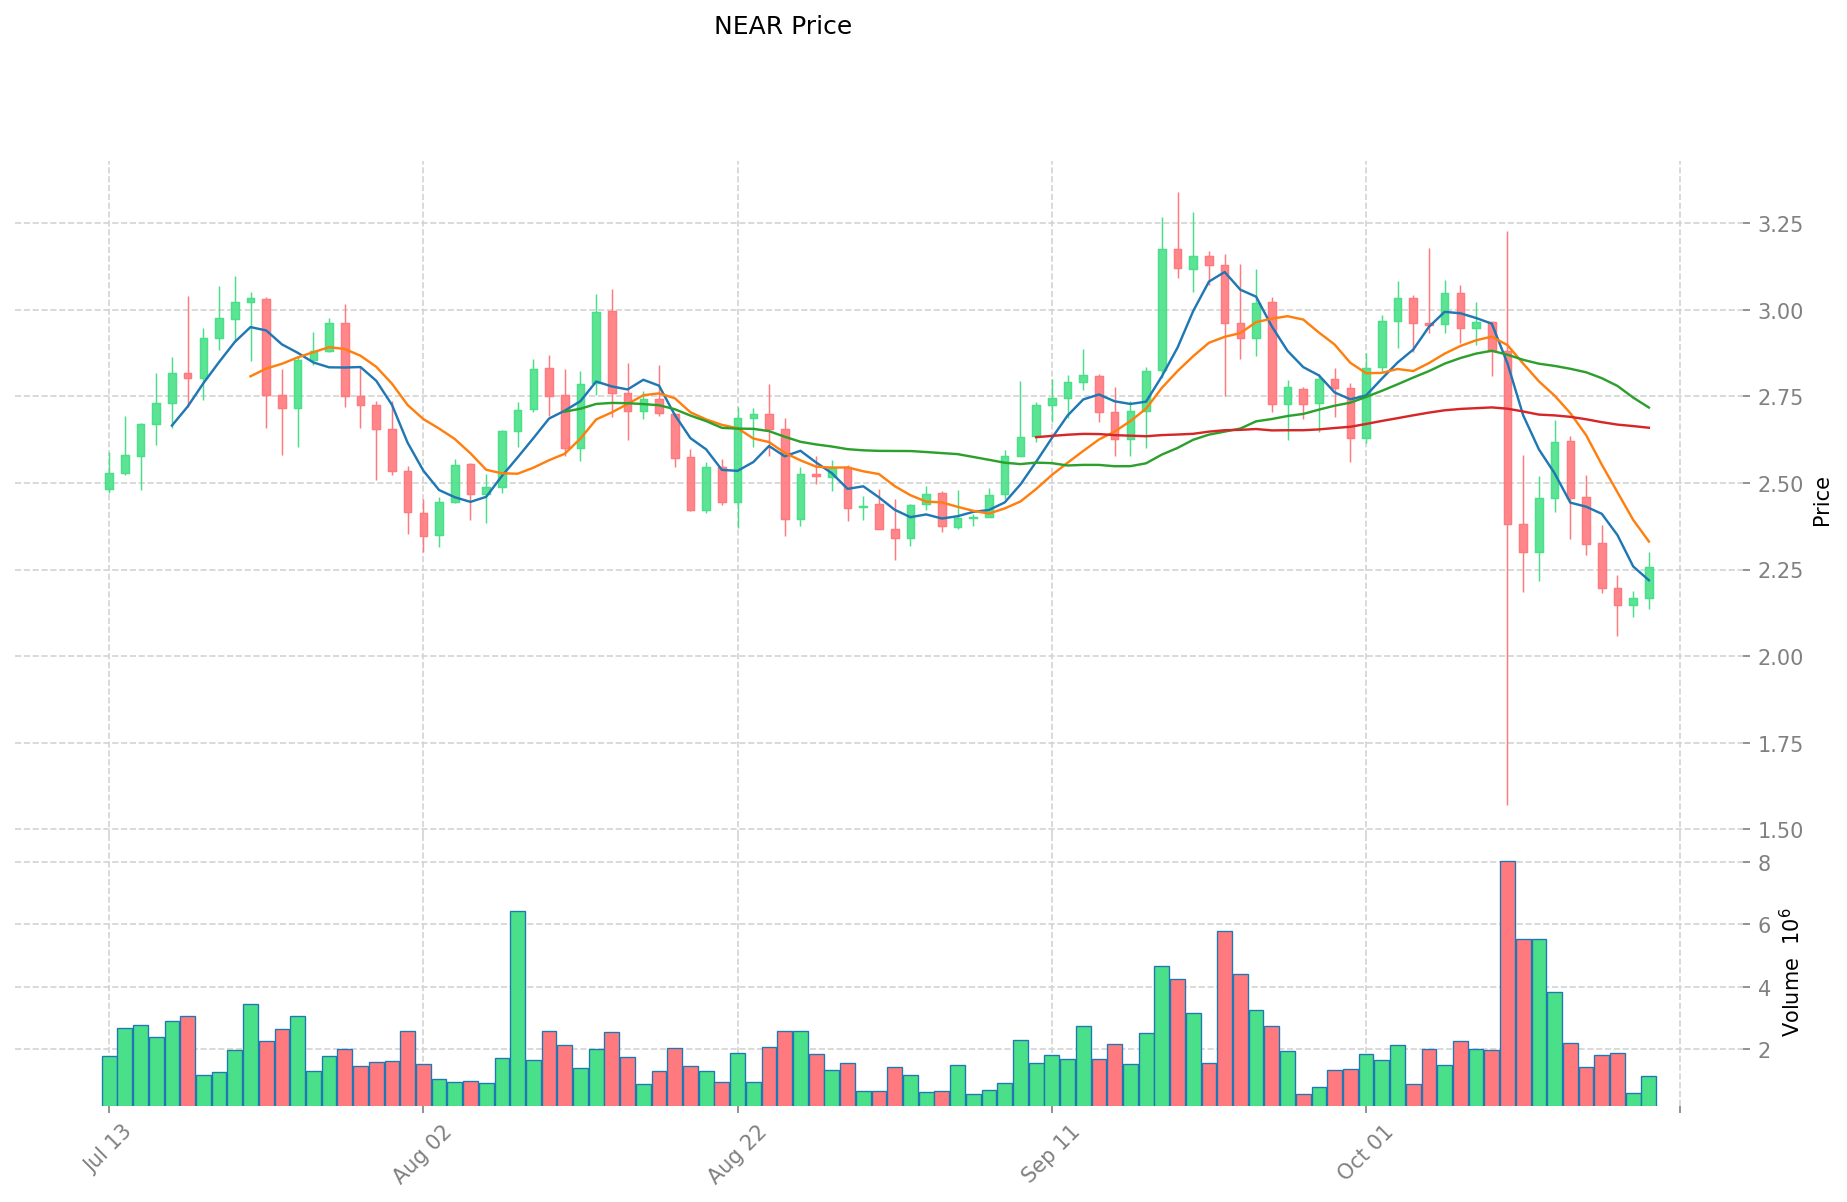
- 2022: NEAR, 17 Ocak 2022’de 20,44 $ ile rekor seviyesini gördü.
- Karşılaştırmalı analiz: Son piyasa döngüsünde ONE, 0,37902 $’dan 0,006604 $’a gerilerken; NEAR ise 20,44 $’dan 2,224 $’a düştü.
Mevcut Piyasa Durumu (20 Ekim 2025)
- ONE güncel fiyatı: 0,006604 $
- NEAR güncel fiyatı: 2,224 $
- 24 saatlik işlem hacmi: 130.198,32 $ (ONE) ile 2.478.947,07 $ (NEAR)
- Piyasa Duyarlılık Endeksi (Korku & Açgözlülük Endeksi): 29 (Korku)
Anlık fiyatları görmek için tıklayın:
- ONE güncel fiyatı için Piyasa Fiyatı
- NEAR güncel fiyatı için Piyasa Fiyatı
II. ONE ve NEAR Yatırım Değerini Etkileyen Temel Faktörler
Arz Mekanizmaları Karşılaştırması (Tokenomics)
- ONE: Harmony ONE, 13,156 milyar token ile maksimum arz sınırına sahiptir. 2019’da ilk ihraç edilen miktar 12,6 milyar token olup, staking ödülleriyle ek dağıtımlar yapılmıştır. ONE şu anda yaklaşık %3 yıllık enflasyon oranıyla işlem görmektedir.
- NEAR: NEAR Protocol tokenomikleri kapsamında deflasyonist bir model uygular. İlk arz 1 milyar token, yıllık enflasyon oranı ise %5’tir. Ancak işlemlerden alınan ücretlerin %70’i yakılarak, ağ aktif olduğunda enflasyonu dengeleyen deflasyonist etki oluşur.
- 📌 Tarihsel örüntü: Deflasyonist veya arzı sınırlı tokenlar, boğa dönemlerinde genellikle daha iyi performans gösterir. NEAR’ın kısmi yakım mekanizması, ağ kullanımının yüksek olduğu zamanlarda güçlü tokenomik yapı sunar.
Kurumsal Benimsenme ve Piyasa Uygulamaları
- Kurumsal sahiplik: NEAR, Andreessen Horowitz (a16z), Pantera Capital ve Electric Capital gibi önemli yatırımcıların desteğiyle daha fazla kurumsal sermaye çekmiştir. ONE’ın ise büyük kurumsal destekçileri daha azdır.
- Kurumsal kullanım: NEAR, Aurora (Ethereum uyumluluk katmanı) ve Pagoda (geliştirme platformu) gibi güçlü kurumsal iş birlikleri kurmuştur. ONE’ın çapraz zincir köprüleri, NEAR’ın ekosistemine kıyasla daha sınırlı kurumsal benimsenme görmüştür.
- Regülasyon yaklaşımı: Her iki token benzer regülasyon ortamlarında faaliyet gösteriyor. Hiçbirinin piyasa pozisyonunu güçlü şekilde ayıracak özel regülasyon sorunu bulunmamaktadır.
Teknik Gelişim ve Ekosistem Oluşturma
- ONE teknik geliştirmeleri: Harmony, ölçeklenebilirlik için parçalama teknolojisi ve güvene dayalı olmayan Ethereum köprüsü geliştirdi; ancak 2022’den sonra gelişim ivmesi yavaşladı.
- NEAR teknik gelişimi: NEAR, Nightshade parçalama çözümü, hızlı kesinlik ve Aurora EVM uyumluluk katmanı ile teknik olarak istikrarlı ilerleme gösteriyor.
- Ekosistem karşılaştırması: NEAR’ın ekosistemi, platformda 1.000’in üzerinde proje, önemli DeFi protokolleri ve NFT pazarlarını kapsayan güçlü gelişim göstergelerine sahip. ONE’ın ekosisteminde ise daha az aktif geliştirici ve proje bulunuyor.
Makroekonomik Faktörler ve Piyasa Döngüleri
- Enflasyonist ortamlarda performans: NEAR’ın işlem ücreti yakım mekanizması, ONE’ın sabit ihraç modeline göre teorik olarak enflasyona karşı daha iyi koruma sağlar.
- Makroekonomik para politikası: Her iki token, faiz oranlarındaki değişiklikler ve USD gücüne bağlı olarak genel kripto piyasasıyla korelasyon gösterir.
- Jeopolitik faktörler: NEAR, farklı bölgelerde daha geniş küresel benimsenme ile bölgesel regülasyon değişimlerine karşı daha dayanıklı olabilir.
III. 2025-2030 Fiyat Tahmini: ONE vs NEAR
Kısa Vadeli Tahmin (2025)
- ONE: Muhafazakâr 0,00453813 $ - 0,006577 $ | İyimser 0,006577 $ - 0,0072347 $
- NEAR: Muhafazakâr 1,64428 $ - 2,222 $ | İyimser 2,222 $ - 2,57752 $
Orta Vadeli Tahmin (2027)
- ONE, büyüme evresine geçebilir; tahmini fiyat aralığı: 0,0043392908475 $ - 0,0084579397875 $
- NEAR, boğa piyasasına girebilir; tahmini fiyat aralığı: 2,370722904 $ - 3,835776384 $
- Başlıca itici güçler: Kurumsal sermaye girişi, ETF’ler, ekosistem geliştirme
Uzun Vadeli Tahmin (2030)
- ONE: Temel senaryo 0,005853712087019 $ - 0,01064311288549 $ | İyimser senaryo 0,01064311288549 $ - 0,01564537594167 $
- NEAR: Temel senaryo 3,590230197634344 $ - 4,1267013765912 $ | İyimser senaryo 4,1267013765912 $ - 6,107518037354976 $
Yasal Uyarı
ONE:
| Yıl | Tahmini En Yüksek Fiyat | Tahmini Ortalama Fiyat | Tahmini En Düşük Fiyat | Değişim Oranı |
|---|---|---|---|---|
| 2025 | 0,0072347 | 0,006577 | 0,00453813 | 0 |
| 2026 | 0,0078036105 | 0,00690585 | 0,004557861 | 4 |
| 2027 | 0,0084579397875 | 0,00735473025 | 0,0043392908475 | 11 |
| 2028 | 0,011622312477562 | 0,00790633501875 | 0,006483194715375 | 19 |
| 2029 | 0,011521902022824 | 0,009764323748156 | 0,006151523961338 | 47 |
| 2030 | 0,01564537594167 | 0,01064311288549 | 0,005853712087019 | 61 |
NEAR:
| Yıl | Tahmini En Yüksek Fiyat | Tahmini Ortalama Fiyat | Tahmini En Düşük Fiyat | Değişim Oranı |
|---|---|---|---|---|
| 2025 | 2,57752 | 2,222 | 1,64428 | 0 |
| 2026 | 2,9277072 | 2,39976 | 1,6078392 | 7 |
| 2027 | 3,835776384 | 2,6637336 | 2,370722904 | 19 |
| 2028 | 3,83471089056 | 3,249754992 | 2,1123407448 | 46 |
| 2029 | 4,7111698119024 | 3,54223294128 | 3,2588543059776 | 59 |
| 2030 | 6,107518037354976 | 4,1267013765912 | 3,590230197634344 | 85 |
IV. Yatırım Stratejisi Karşılaştırması: ONE vs NEAR
Uzun Vadeli ve Kısa Vadeli Yatırım Stratejileri
- ONE: Çapraz zincir birlikte çalışabilirliğine ve potansiyel ekosistem büyümesine odaklanan yatırımcılar için uygundur
- NEAR: Daha oturmuş bir ekosistem ve deflasyonist tokenomik beklentisi olan yatırımcılar için uygundur
Risk Yönetimi ve Varlık Dağılımı
- Temkinli yatırımcılar: ONE %20, NEAR %80
- Agresif yatırımcılar: ONE %40, NEAR %60
- Koruma araçları: Stablecoin dağılımı, opsiyon, çapraz para portföyleri
V. Potansiyel Risk Karşılaştırması
Piyasa Riskleri
- ONE: NEAR’a kıyasla daha yüksek oynaklık ve düşük likidite
- NEAR: Layer 1 alanında artan rekabet riski
Teknik Riskler
- ONE: Ölçeklenebilirlik sorunları, ağ istikrarı problemleri
- NEAR: Merkezileşme riski, parçalama uygulamasında güvenlik açıkları
Regülasyon Riskleri
- Küresel regülasyon politikaları, her iki token üzerinde farklı etkiler yaratabilir; NEAR, daha büyük piyasa hacmi nedeniyle daha fazla denetime maruz kalabilir
VI. Sonuç: Hangisi Daha İyi Bir Alım?
📌 Yatırım Değeri Özeti:
- ONE avantajları: Düşük piyasa değeri ile yüksek büyüme potansiyeli, çapraz zincir odaklı yapı
- NEAR avantajları: Güçlü ekosistem gelişimi, kurumsal destek, deflasyonist tokenomik
✅ Yatırım Tavsiyesi:
- Yeni yatırımcılar: NEAR’ın daha oturmuş ekosistemi ve güçlü piyasa konumu nedeniyle daha yüksek oranda NEAR ayırmayı düşünün
- Deneyimli yatırımcılar: NEAR’a hafif ağırlık veren dengeli bir portföy tercih edin, ONE’ın potansiyel getirilerini de takip edin
- Kurumsal yatırımcılar: Güçlü temel göstergeler ve ekosistem büyümesi nedeniyle NEAR’a odaklanın, çeşitlendirme için ONE’a daha küçük bir oran ayırın
⚠️ Risk Uyarısı: Kripto para piyasası son derece oynak olup, bu makaledeki bilgiler yatırım tavsiyesi niteliği taşımamaktadır. None
VII. SSS
S1: ONE ve NEAR’ın piyasa performansı açısından ana farkları nelerdir? C: ONE, Ekim 2021’de 0,37902 $ ile zirveye ulaşırken, NEAR Ocak 2022’de 20,44 $ ile zirve yaptı. Şu anda ONE 0,006604 $, NEAR ise 2,224 $ seviyesinden işlem görüyor; son 24 saatte NEAR’ın işlem hacmi 2.478.947,07 $ ile ONE’ın 130.198,32 $’lık hacminin oldukça üzerinde.
S2: ONE ve NEAR’ın tokenomikleri nasıl karşılaştırılır? C: ONE, 13,156 milyar token maksimum arz ve yaklaşık %3 yıllık enflasyon oranına sahip. NEAR, 1 milyar token ile başladı, %5 enflasyon oranı ve işlem ücretlerinin %70’inin yakılması sayesinde ağ aktivitesi yüksek olduğunda deflasyonist etki oluşturuyor.
S3: Hangi token daha fazla kurumsal yatırım çekti? C: NEAR, Andreessen Horowitz (a16z), Pantera Capital ve Electric Capital gibi önde gelen yatırımcıların desteğiyle daha fazla kurumsal yatırım aldı. ONE’ın büyük kurumsal destekçileri daha az.
S4: ONE ve NEAR ekosistemleri nasıl karşılaştırılır? C: NEAR ekosistemi, 1.000’den fazla proje, büyük DeFi protokolleri ve NFT pazarları ile güçlü gelişim göstergelerine sahip. ONE ekosistemi ise daha az aktif geliştirici ve projeyle zorluk yaşıyor.
S5: 2030 için ONE ve NEAR’ın uzun vadeli fiyat tahminleri nelerdir? C: ONE için temel senaryo 0,005853712087019 $ - 0,01064311288549 $, iyimser senaryo ise 0,01564537594167 $’a kadar. NEAR için temel senaryo 3,590230197634344 $ - 4,1267013765912 $, iyimser senaryo ise 6,107518037354976 $’a kadar.
S6: ONE ve NEAR için yatırım stratejileri nasıl farklılık gösterir? C: ONE, çapraz zincir birlikte çalışabilirliğine ve ekosistem büyümesine odaklananlar; NEAR ise oturmuş ekosistem ve deflasyonist tokenomik isteyenler için uygundur. Temkinli yatırımcılar ONE’a %20, NEAR’a %80; agresif yatırımcılar ise ONE’a %40, NEAR’a %60 ayırabilir.
S7: ONE ve NEAR yatırımlarında başlıca riskler nelerdir? C: ONE, yüksek oynaklık, düşük likidite, ölçeklenebilirlik ve ağ istikrarı sorunlarıyla karşılaşabilir. NEAR ise Layer 1 alanında rekabet, merkezileşme riski ve parçalama uygulamasında güvenlik endişeleriyle karşı karşıya. Her iki token da küresel regülasyon politikalarından farklı şekillerde etkilenebilir.
Share
Content
Giriş: ONE ve NEAR Yatırım Karşılaştırması
I. Fiyat Geçmişi Karşılaştırması ve Mevcut Piyasa Durumu
II. ONE ve NEAR Yatırım Değerini Etkileyen Temel Faktörler
III. 2025-2030 Fiyat Tahmini: ONE vs NEAR
IV. Yatırım Stratejisi Karşılaştırması: ONE vs NEAR
V. Potansiyel Risk Karşılaştırması
VI. Sonuç: Hangisi Daha İyi Bir Alım?
VII. SSS
How to Buy Cryptocurrency


Trending Cryptocurrencies


2025 HYPE Fiyat Tahmini: Piyasa Trendleri ve Bir Sonraki Kripto Atılımının Büyüme Potansiyelinin Analizi

DFND vs OP: Dijital Çağda Siber Güvenlik Devlerinin Mücadelesi
Gate Square Spark Program 2025: Web3 Yenilikçi Yetiştirme Blockchain Girişimciliğini Desteklemek İçin

2025 SUI Fiyat Tahmini: Blockchain’in Yeni Gözdesinin Gelecekteki Gelişimi ve Yatırım Değeri Analizi

2025 NEAR Fiyat Tahmini: NEAR Protocol Ekosisteminde Bir Sonraki Boğa Koşusunu Belirleyecek Faktörlerin Kapsamlı Analizi

2025 INJ Fiyat Tahmini: Injective Protocol’un Piyasa Trendleri ve Büyüme Potansiyelinin Kapsamlı Analizi
Monero (XMR), gizlilik odaklı kripto para piyasasında Zcash ve Dash ile nasıl kıyaslanır?

Brezilya’daki Finansal Platformlar için Kart Limitleri ve Ücretleri