2025 RED Price Prediction: Analyzing Market Trends and Potential Growth Factors for RED Token
Introduction: RED's Market Position and Investment Value
RedStone (RED), as the fastest-growing oracle and a leader in yield-bearing assets, has made significant strides since its inception. As of 2025, RedStone's market capitalization has reached $99,008,000, with a circulating supply of approximately 280,000,000 tokens, and a price hovering around $0.3536. This asset, known as the "innovative oracle solution," is playing an increasingly crucial role in decentralized finance and yield-bearing assets.
This article will comprehensively analyze RedStone's price trends from 2025 to 2030, combining historical patterns, market supply and demand, ecosystem development, and macroeconomic factors to provide investors with professional price predictions and practical investment strategies.
I. RED Price History Review and Current Market Status
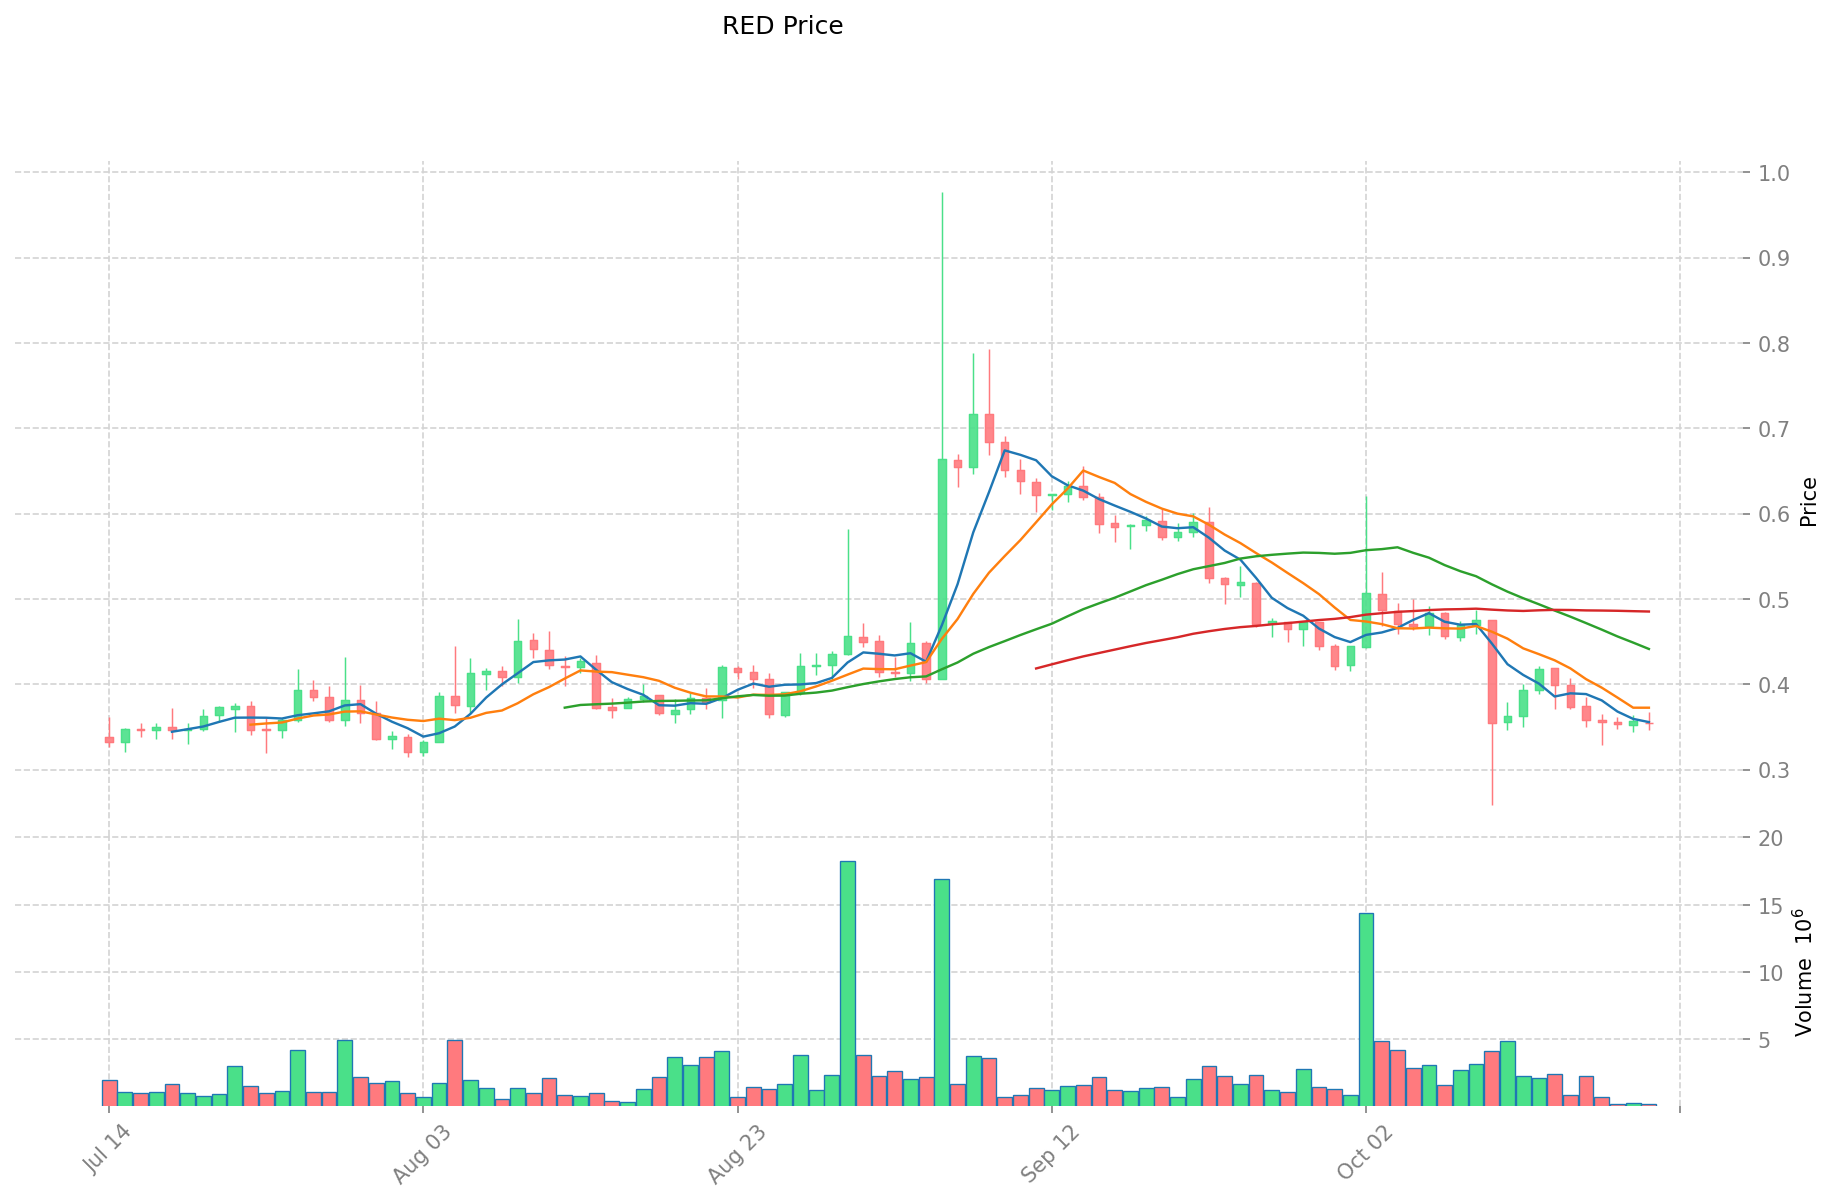
RED Historical Price Evolution
- 2025: Launch and initial trading, price fluctuated around $0.7525
- September 2025: Reached all-time high of $0.9771
- October 2025: Market correction, price declined to current levels
RED Current Market Situation
As of October 21, 2025, RED is trading at $0.3536, with a 24-hour trading volume of $74,986.50. The token has experienced a slight increase of 0.22% in the last 24 hours. However, RED has seen significant declines over longer periods, with a 14.46% decrease in the past week and a 38.75% drop over the last month. The current market capitalization stands at $99,008,000, ranking RED at 416th in the global cryptocurrency market. With a circulating supply of 280,000,000 RED tokens, representing 28% of the total supply, the fully diluted market cap is $353,600,000. The token is currently trading 63.81% below its all-time high of $0.9771, reached on September 5, 2025.
Click to view the current RED market price
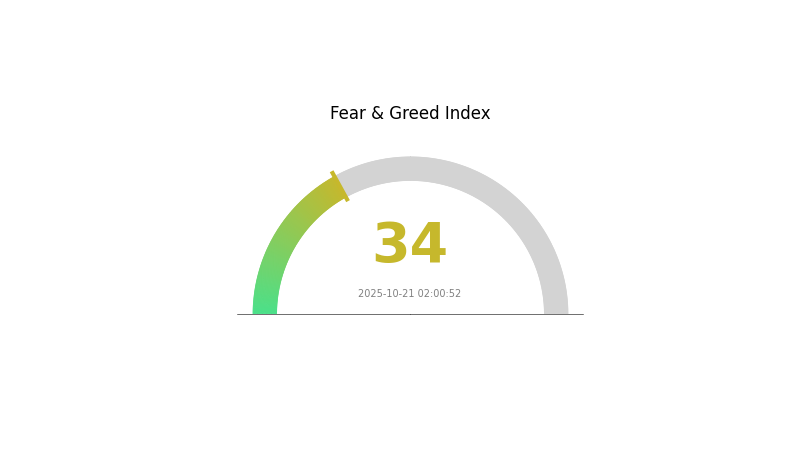
RED Market Sentiment Indicator
2025-10-21 Fear and Greed Index: 34 (Fear)
Click to view the current Fear & Greed Index
The crypto market sentiment remains cautious, with the Fear and Greed Index at 34, indicating a fearful atmosphere. This suggests investors are hesitant and risk-averse, potentially creating buying opportunities for contrarian traders. However, it's crucial to remember that market sentiment can shift rapidly. Savvy investors should stay informed, diversify their portfolios, and consider using Gate.com's advanced trading tools to navigate these uncertain waters.
RED Holding Distribution
The address holding distribution data provides crucial insights into the concentration of RED tokens across different wallets. Analysis of the provided data reveals a notable level of centralization in RED's token distribution. The top five addresses collectively hold approximately 50.79% of the total RED supply, with the largest holder possessing 13.85% of tokens.
This concentration pattern raises concerns about potential market manipulation and price volatility. With such a significant portion of tokens held by a small number of addresses, large-scale transactions by these holders could significantly impact RED's market price and liquidity. Furthermore, this distribution structure may impact the project's decentralization efforts, as a small group of holders could potentially exert disproportionate influence over governance decisions.
However, it's worth noting that nearly half (49.21%) of RED tokens are distributed among other addresses, suggesting some level of broader market participation. This distribution pattern indicates a mixed market structure, combining elements of centralization with a degree of wider token dispersion. Monitoring changes in this distribution over time will be crucial for assessing RED's long-term market stability and decentralization progress.
Click to view the current RED holding distribution
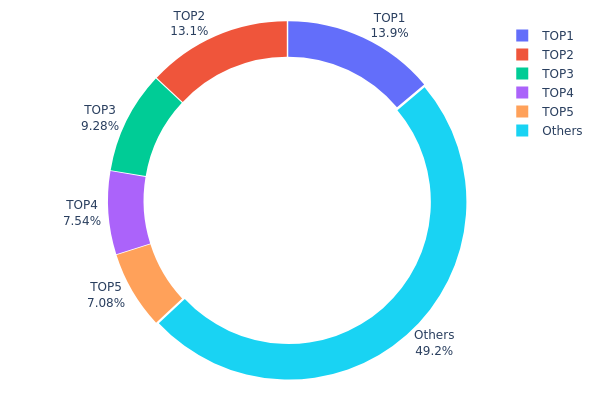
| Top | Address | Holding Qty | Holding (%) |
|---|---|---|---|
| 1 | 0xa77e...d51b2e | 82727.28K | 13.85% |
| 2 | 0xb286...d3a654 | 78000.00K | 13.06% |
| 3 | 0xf39e...892dec | 55374.95K | 9.27% |
| 4 | 0xba54...031ff7 | 45000.00K | 7.53% |
| 5 | 0x7ab8...415a5b | 42278.17K | 7.08% |
| - | Others | 293619.60K | 49.21% |
II. Key Factors Affecting RED's Future Price
Supply Mechanism
- Initial Supply: Based on the available information, 10% of the total supply (100 million RED tokens) was sold for $22 million, resulting in an initial price of approximately $0.22 per RED token.
Institutional and Major Holder Dynamics
- Corporate Adoption: Some financial institutions may adopt RED for cross-border payments and settlement, which could directly impact its price.
Macroeconomic Environment
- Geopolitical Factors: Geopolitical risks continue to be a core driver for RED as a potential safe-haven asset.
Technical Development and Ecosystem Building
- Technology Advancements: The development of RED's technology, particularly in cross-border payments and settlement systems, may influence its price.
- Ecosystem Applications: The adoption of RED by financial institutions for its primary use case in cross-border payments and clearing could significantly impact its value.
III. RED Price Prediction for 2025-2030
2025 Outlook
- Conservative prediction: $0.29274 - $0.3527
- Neutral prediction: $0.3527 - $0.40853
- Optimistic prediction: $0.40853 - $0.50436 (requires strong market recovery and increased adoption)
2027-2028 Outlook
- Market stage expectation: Potential growth phase with increasing adoption
- Price range forecast:
- 2027: $0.35172 - $0.67719
- 2028: $0.53495 - $0.72128
- Key catalysts: Technological advancements, wider cryptocurrency acceptance, and potential regulatory clarity
2030 Long-term Outlook
- Base scenario: $0.66878 - $0.7868 (assuming steady market growth and adoption)
- Optimistic scenario: $0.7868 - $0.85761 (assuming accelerated adoption and favorable market conditions)
- Transformative scenario: $0.85761 - $0.91242 (assuming breakthrough use cases and mainstream integration)
- 2030-12-31: RED $0.7868 (122% increase from 2025 levels)
| 年份 | 预测最高价 | 预测平均价格 | 预测最低价 | 涨跌幅 |
|---|---|---|---|---|
| 2025 | 0.50436 | 0.3527 | 0.29274 | 0 |
| 2026 | 0.62137 | 0.42853 | 0.25712 | 21 |
| 2027 | 0.67719 | 0.52495 | 0.35172 | 48 |
| 2028 | 0.72128 | 0.60107 | 0.53495 | 69 |
| 2029 | 0.91242 | 0.66117 | 0.3967 | 86 |
| 2030 | 0.85761 | 0.7868 | 0.66878 | 122 |
IV. Professional Investment Strategies and Risk Management for RED
RED Investment Methodology
(1) Long-term Holding Strategy
- Suitable for: Risk-tolerant investors with a long-term perspective
- Operation suggestions:
- Accumulate RED tokens during market dips
- Set price targets for partial profit-taking
- Store tokens in secure hardware wallets or reputable custodial services
(2) Active Trading Strategy
- Technical analysis tools:
- Moving Averages: Use to identify trends and potential reversal points
- Relative Strength Index (RSI): Helps determine overbought or oversold conditions
- Key points for swing trading:
- Monitor oracle adoption rates and partnerships
- Stay informed about RedStone's technological advancements
RED Risk Management Framework
(1) Asset Allocation Principles
- Conservative investors: 1-3% of crypto portfolio
- Moderate investors: 3-7% of crypto portfolio
- Aggressive investors: 7-15% of crypto portfolio
(2) Risk Hedging Solutions
- Diversification: Spread investments across multiple oracle projects
- Stop-loss orders: Implement to limit potential losses
(3) Secure Storage Solutions
- Hot wallet recommendation: Gate Web3 Wallet
- Cold storage solution: Use hardware wallets for long-term holding
- Security precautions: Enable two-factor authentication, use unique passwords
V. Potential Risks and Challenges for RED
RED Market Risks
- Volatility: Significant price fluctuations common in the crypto market
- Competition: Increased competition from established oracle providers
- Market sentiment: Susceptibility to broader crypto market trends
RED Regulatory Risks
- Unclear regulations: Potential for regulatory changes affecting oracle services
- Cross-border operations: Varying legal frameworks in different jurisdictions
- Data privacy concerns: Potential regulatory scrutiny on data handling practices
RED Technical Risks
- Smart contract vulnerabilities: Potential for exploits or bugs in the protocol
- Scalability challenges: Possible limitations in handling increased network load
- Oracle attack vectors: Risk of manipulated data affecting RedStone's services
VI. Conclusion and Action Recommendations
RED Investment Value Assessment
RedStone (RED) presents a promising long-term value proposition as a fast-growing oracle with unique features like Actively Validated Services and Restaking. However, short-term volatility and market risks should be carefully considered.
RED Investment Recommendations
✅ Newcomers: Start with small, regular investments to understand the market dynamics ✅ Experienced investors: Consider a balanced approach, combining long-term holding with strategic trading ✅ Institutional investors: Explore partnerships or integration opportunities with RedStone's oracle services
RED Trading Participation Methods
- Spot trading: Buy and sell RED tokens on Gate.com
- Staking: Participate in staking programs if available to earn passive income
- DeFi integration: Utilize RED tokens in decentralized finance protocols that support RedStone oracles
Cryptocurrency investments carry extremely high risks, and this article does not constitute investment advice. Investors should make decisions carefully based on their own risk tolerance and are advised to consult professional financial advisors. Never invest more than you can afford to lose.
FAQ
What is the forecast for red crypto?
The forecast for RED crypto is bearish. Predictions suggest the price may drop to $0.00 by 2026, with a further decline to $0.00 by 2030.
Is RedStone a good long-term investment?
RedStone shows potential for long-term growth. Its price could reach $0.250 by 2030, up from $0.065-$0.070 in 2025. This suggests good investment prospects if market trends and adoption continue positively.
What is the future potential of Red Coin?
Red Coin shows strong potential, with projections reaching $3.80 by 2025. This forecast suggests promising growth for long-term investors, supported by current market trends.
What is RedStone Coin's potential future value?
RedStone Coin's value is expected to rise slightly, with a forecasted price range of $0.2520 to $0.3601 by the end of next year, representing a modest 0.19% increase.
Share
Content