2025 RED Price Prediction: Analyzing Market Trends and Potential Growth Factors
Introduction: RED's Market Position and Investment Value
RedStone (RED), as the fastest-growing oracle and a leader in yield-bearing assets, has established itself as a key player in the decentralized finance sector since its inception. As of 2025, RedStone's market capitalization has reached $98,392,000, with a circulating supply of approximately 280,000,000 tokens, and a price hovering around $0.3514. This asset, known as the "Actively Validated Oracle," is playing an increasingly crucial role in providing reliable data for DeFi protocols and yield-bearing assets.
This article will comprehensively analyze RedStone's price trends from 2025 to 2030, considering historical patterns, market supply and demand, ecosystem development, and macroeconomic conditions to provide investors with professional price predictions and practical investment strategies.
I. RED Price History Review and Current Market Status
RED Historical Price Evolution
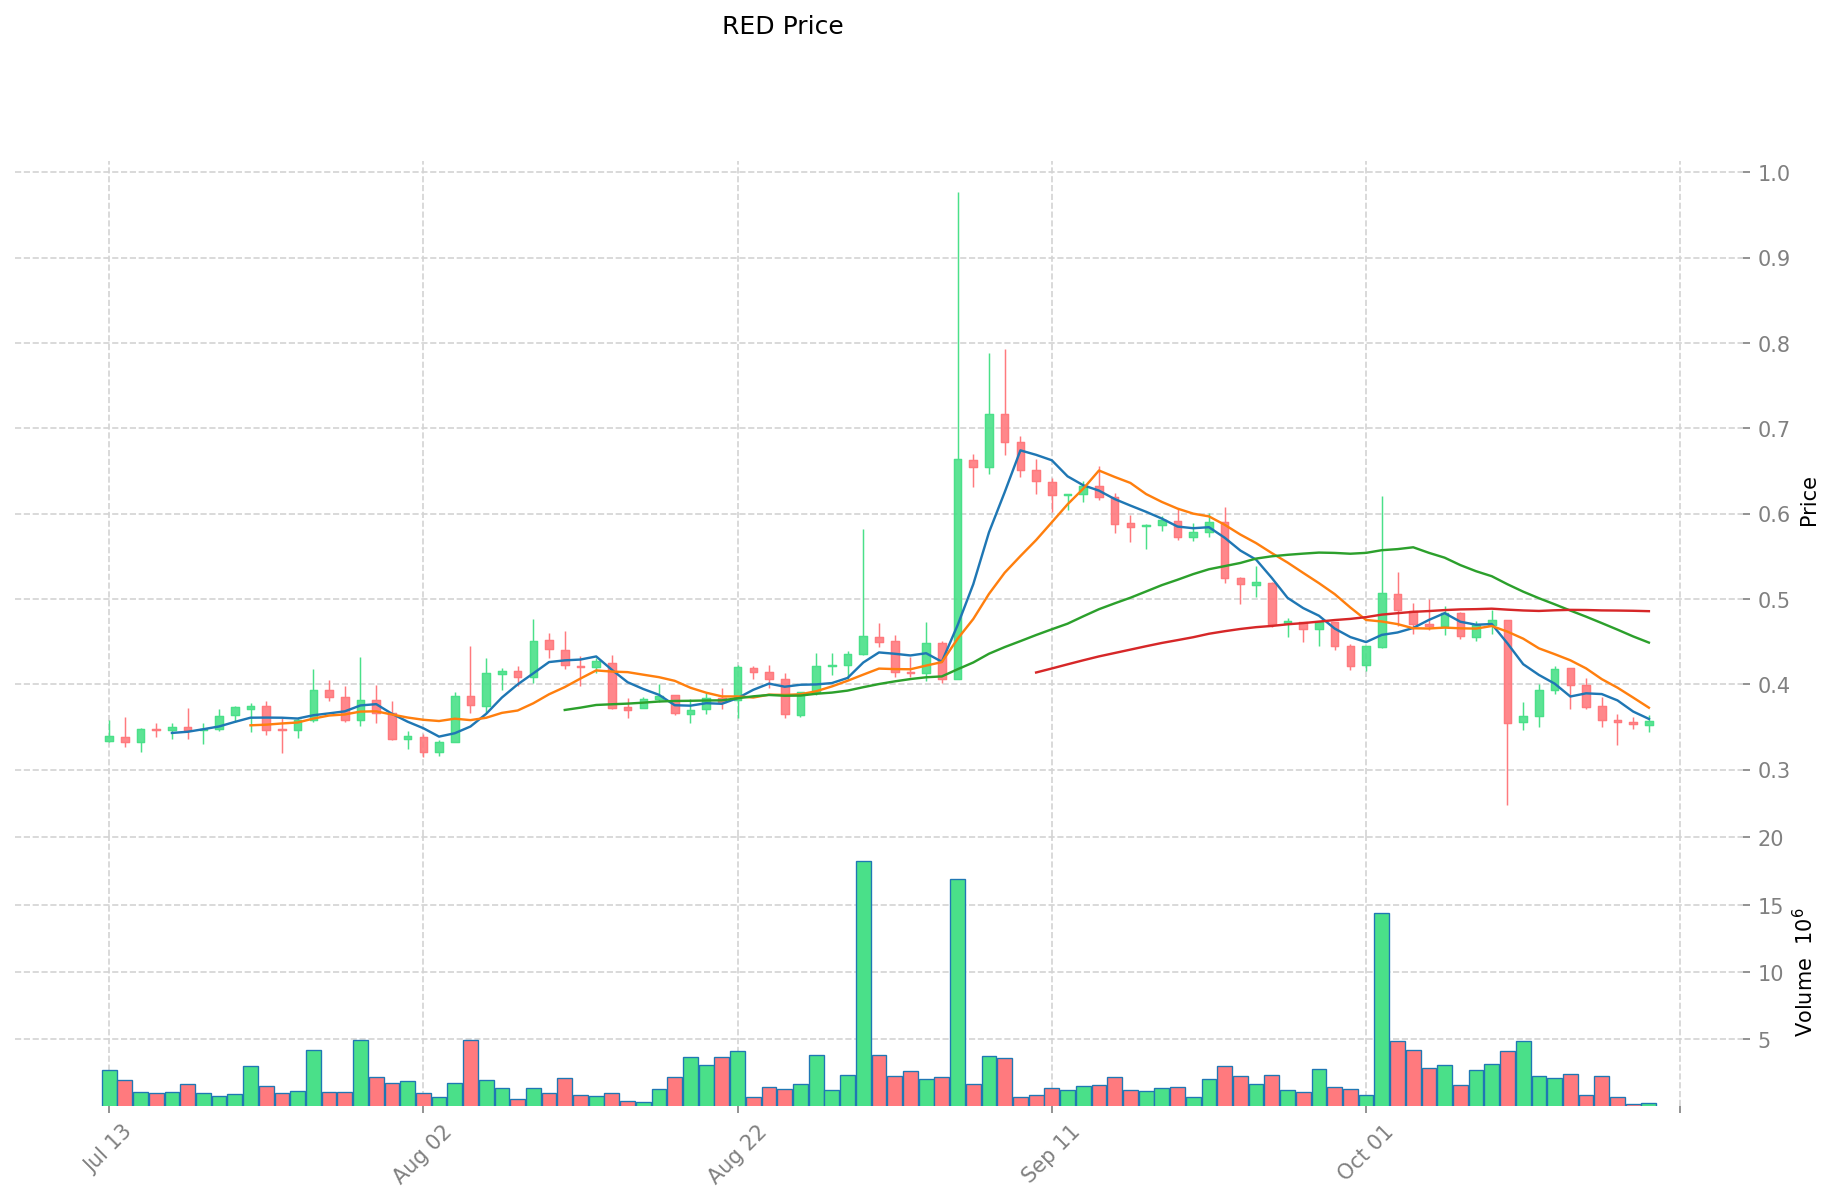
- 2025: Launch and initial market entry, price fluctuated around $0.7525
- 2025 June 22: RED reached its all-time low of $0.2316
- 2025 September 5: RED hit its all-time high of $0.9771
RED Current Market Situation
As of October 20, 2025, RED is trading at $0.3514. The token has experienced a slight decrease of 0.81% in the last 24 hours. The current price represents a significant drop from its all-time high, indicating a bearish trend in the short term. RED's market capitalization stands at $98,392,000, ranking it 412th in the overall cryptocurrency market.
The trading volume in the past 24 hours is $98,555.27, suggesting moderate market activity. RED's circulating supply is 280,000,000 tokens, which is 28% of its total supply of 1,000,000,000. This relatively low circulation ratio may indicate potential for future price volatility as more tokens enter the market.
RED has shown negative performance across various timeframes, with a 10.87% decrease over the past week and a substantial 38.17% decline over the last 30 days. This downward trend suggests that RED is currently facing selling pressure in the market.
Click to view the current RED market price
RED Market Sentiment Indicator
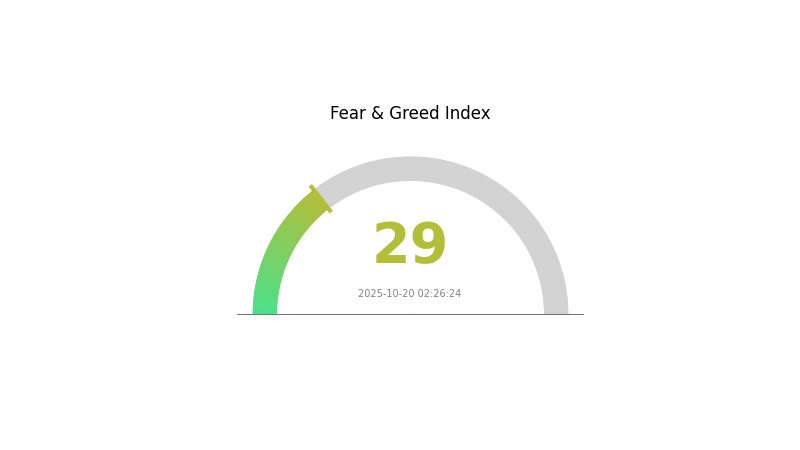
2025-10-20 Fear and Greed Index: 29 (Fear)
Click to view the current Fear & Greed Index
The crypto market sentiment remains cautious as the Fear and Greed Index hovers at 29, indicating a state of fear. This suggests investors are wary and potentially looking for buying opportunities. During such periods, it's crucial to stay informed and make rational decisions. Gate.com offers comprehensive market data and analysis tools to help traders navigate these uncertain times. Remember, market cycles are natural, and fear often precedes recovery. Stay vigilant and consider your risk tolerance when making investment choices.
RED Holdings Distribution
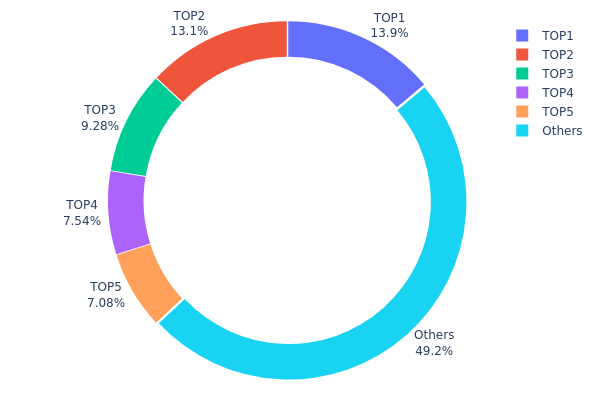
The address holdings distribution data provides insight into the concentration of RED tokens among different wallet addresses. Analyzing this data reveals a significant concentration of RED tokens among the top holders. The top five addresses collectively control 50.79% of the total supply, with the largest holder possessing 13.85% of all tokens.
This level of concentration raises concerns about potential market manipulation and price volatility. With such a large portion of tokens held by a small number of addresses, any significant movement or liquidation by these top holders could have a substantial impact on RED's market price and overall stability. The fact that nearly half (49.21%) of the tokens are distributed among other addresses suggests some level of decentralization, but the influence of the top holders remains significant.
The current distribution structure indicates a moderate level of centralization in RED's ecosystem. While this concentration could provide some stability if the top holders are long-term investors, it also poses risks to the token's market dynamics and could potentially hinder wider adoption and more equitable distribution in the long term.
Click to view the current RED holdings distribution
| Top | Address | Holding Qty | Holding (%) |
|---|---|---|---|
| 1 | 0xa77e...d51b2e | 82727.28K | 13.85% |
| 2 | 0xb286...d3a654 | 78000.00K | 13.06% |
| 3 | 0xf39e...892dec | 55374.95K | 9.27% |
| 4 | 0xba54...031ff7 | 45000.00K | 7.53% |
| 5 | 0x7ab8...415a5b | 42278.17K | 7.08% |
| - | Others | 293619.60K | 49.21% |
II. Key Factors Affecting RED's Future Price
Supply Mechanism
- Burning Mechanism: RED implements a token burning mechanism to reduce the total supply over time.
- Historical Pattern: Previous token burns have generally led to temporary price increases due to reduced supply.
- Current Impact: The ongoing burning mechanism is expected to create upward pressure on RED's price as the circulating supply decreases.
Institutional and Whale Dynamics
- Institutional Holdings: Several major crypto investment firms have recently increased their RED holdings, signaling growing institutional interest.
Macroeconomic Environment
- Monetary Policy Impact: Central banks' potential shift towards tighter monetary policies may affect RED's price as investors reassess risk assets.
- Inflation Hedging Properties: RED has shown some correlation with inflation rates, potentially attracting investors seeking to hedge against currency devaluation.
Technical Development and Ecosystem Building
- Layer 2 Integration: RED is planning to integrate with Layer 2 solutions to improve scalability and reduce transaction costs.
- Cross-chain Interoperability: Upcoming updates aim to enhance RED's cross-chain capabilities, potentially expanding its use cases and adoption.
- Ecosystem Applications: Several DeFi protocols and NFT marketplaces are being developed on the RED network, which could drive increased utility and demand for the token.
III. RED Price Prediction for 2025-2030
2025 Outlook
- Conservative forecast: $0.26107 - $0.3528
- Neutral forecast: $0.3528 - $0.45
- Optimistic forecast: $0.45 - $0.50803 (requires favorable market conditions and increased adoption)
2027-2028 Outlook
- Market phase expectation: Potential consolidation followed by gradual growth
- Price range forecast:
- 2027: $0.47393 - $0.59372
- 2028: $0.51268 - $0.5907
- Key catalysts: Technology upgrades, expanding use cases, and broader market trends
2029-2030 Long-term Outlook
- Base scenario: $0.57398 - $0.68016 (assuming steady market growth and adoption)
- Optimistic scenario: $0.68016 - $0.78635 (with accelerated adoption and favorable regulatory environment)
- Transformative scenario: $0.78635 - $0.85 (with breakthrough technological advancements and mainstream integration)
- 2030-12-31: RED $0.70737 (potential year-end target based on average projections)
| 年份 | 预测最高价 | 预测平均价格 | 预测最低价 | 涨跌幅 |
|---|---|---|---|---|
| 2025 | 0.50803 | 0.3528 | 0.26107 | 0 |
| 2026 | 0.61119 | 0.43042 | 0.37446 | 22 |
| 2027 | 0.59372 | 0.5208 | 0.47393 | 48 |
| 2028 | 0.5907 | 0.55726 | 0.51268 | 58 |
| 2029 | 0.78635 | 0.57398 | 0.38456 | 63 |
| 2030 | 0.70737 | 0.68016 | 0.4013 | 93 |
IV. Professional Investment Strategies and Risk Management for RED
RED Investment Methodology
(1) Long-term Holding Strategy
- Suitable for: Long-term investors with high risk tolerance
- Operation suggestions:
- Accumulate RED tokens during market dips
- Hold for at least 1-2 years to ride out market volatility
- Store tokens in a secure hardware wallet
(2) Active Trading Strategy
- Technical analysis tools:
- Moving Averages: Use to identify trend directions and potential reversals
- Relative Strength Index (RSI): Helps determine overbought or oversold conditions
- Key points for swing trading:
- Set clear entry and exit points based on technical indicators
- Use stop-loss orders to limit potential losses
RED Risk Management Framework
(1) Asset Allocation Principles
- Conservative investors: 1-3% of crypto portfolio
- Aggressive investors: 5-10% of crypto portfolio
- Professional investors: Up to 15% of crypto portfolio
(2) Risk Hedging Solutions
- Diversification: Spread investments across multiple crypto assets
- Stop-loss orders: Use to limit potential losses on trades
(3) Secure Storage Solutions
- Hot wallet recommendation: Gate Web3 Wallet
- Cold storage solution: Use a hardware wallet for long-term storage
- Security precautions: Enable two-factor authentication, use strong passwords, and keep private keys offline
V. Potential Risks and Challenges for RED
RED Market Risks
- Volatility: Cryptocurrency markets are highly volatile, leading to significant price swings
- Competition: Other oracle projects may gain market share, impacting RED's value
- Market sentiment: Changes in overall crypto market sentiment can affect RED's price
RED Regulatory Risks
- Regulatory uncertainty: Changing regulations in different jurisdictions may impact RED's operations
- Compliance challenges: Ensuring compliance with evolving global regulations
- Legal status: Potential classification as a security in some jurisdictions
RED Technical Risks
- Smart contract vulnerabilities: Potential bugs or exploits in the underlying code
- Oracle failures: Inaccurate or manipulated data could compromise the system
- Scalability issues: Potential limitations in handling increased network demand
VI. Conclusion and Action Recommendations
RED Investment Value Assessment
RED shows potential as a fast-growing oracle project with unique features like actively validated services and restaking. However, it faces significant competition and regulatory uncertainties in the short term.
RED Investment Recommendations
✅ Beginners: Consider small, long-term investments after thorough research ✅ Experienced investors: Implement a dollar-cost averaging strategy with strict risk management ✅ Institutional investors: Conduct in-depth due diligence and consider RED as part of a diversified crypto portfolio
RED Trading Participation Methods
- Spot trading: Buy and sell RED tokens on Gate.com
- Staking: Participate in staking programs if available to earn passive income
- DeFi integration: Explore DeFi protocols that utilize RED's oracle services
Cryptocurrency investments carry extremely high risks, and this article does not constitute investment advice. Investors should make decisions carefully based on their own risk tolerance and are advised to consult professional financial advisors. Never invest more than you can afford to lose.
FAQ
What is the forecast for red crypto?
RED crypto is expected to see moderate growth by 2025, with potential price increases driven by market trends and adoption in the Web3 ecosystem.
Is RedStone a good long-term investment?
Yes, RedStone shows potential for long-term growth. Its innovative oracle solutions and partnerships in the DeFi space position it well for future success in the evolving crypto market.
How much will 1 bitcoin be worth in 2030?
Based on current trends and expert predictions, 1 bitcoin could potentially be worth around $500,000 to $1,000,000 by 2030. However, this is speculative and subject to market volatility.
What is RedStone Coin's potential future value?
RedStone Coin's potential future value could reach $10 by 2026, driven by increased adoption and market expansion in the Web3 ecosystem.
Share
Content