2025 OPEN Price Prediction: Analyzing Market Trends and Potential Growth Factors
Introduction: OPEN's Market Position and Investment Value
OpenLedger (OPEN), as a pioneering AI blockchain platform, has made significant strides in unlocking liquidity for data, models, apps, and agents since its inception. As of 2025, OpenLedger's market capitalization has reached $84,950,100, with a circulating supply of approximately 215,500,000 tokens, and a price hovering around $0.3942. This asset, hailed as the "AI blockchain solution," is playing an increasingly crucial role in addressing the $500 billion data problem and advancing AI towards transparency and decentralization.
This article will provide a comprehensive analysis of OpenLedger's price trends from 2025 to 2030, combining historical patterns, market supply and demand, ecosystem development, and macroeconomic factors to offer professional price predictions and practical investment strategies for investors.
I. OPEN Price History Review and Current Market Status
OPEN Historical Price Evolution
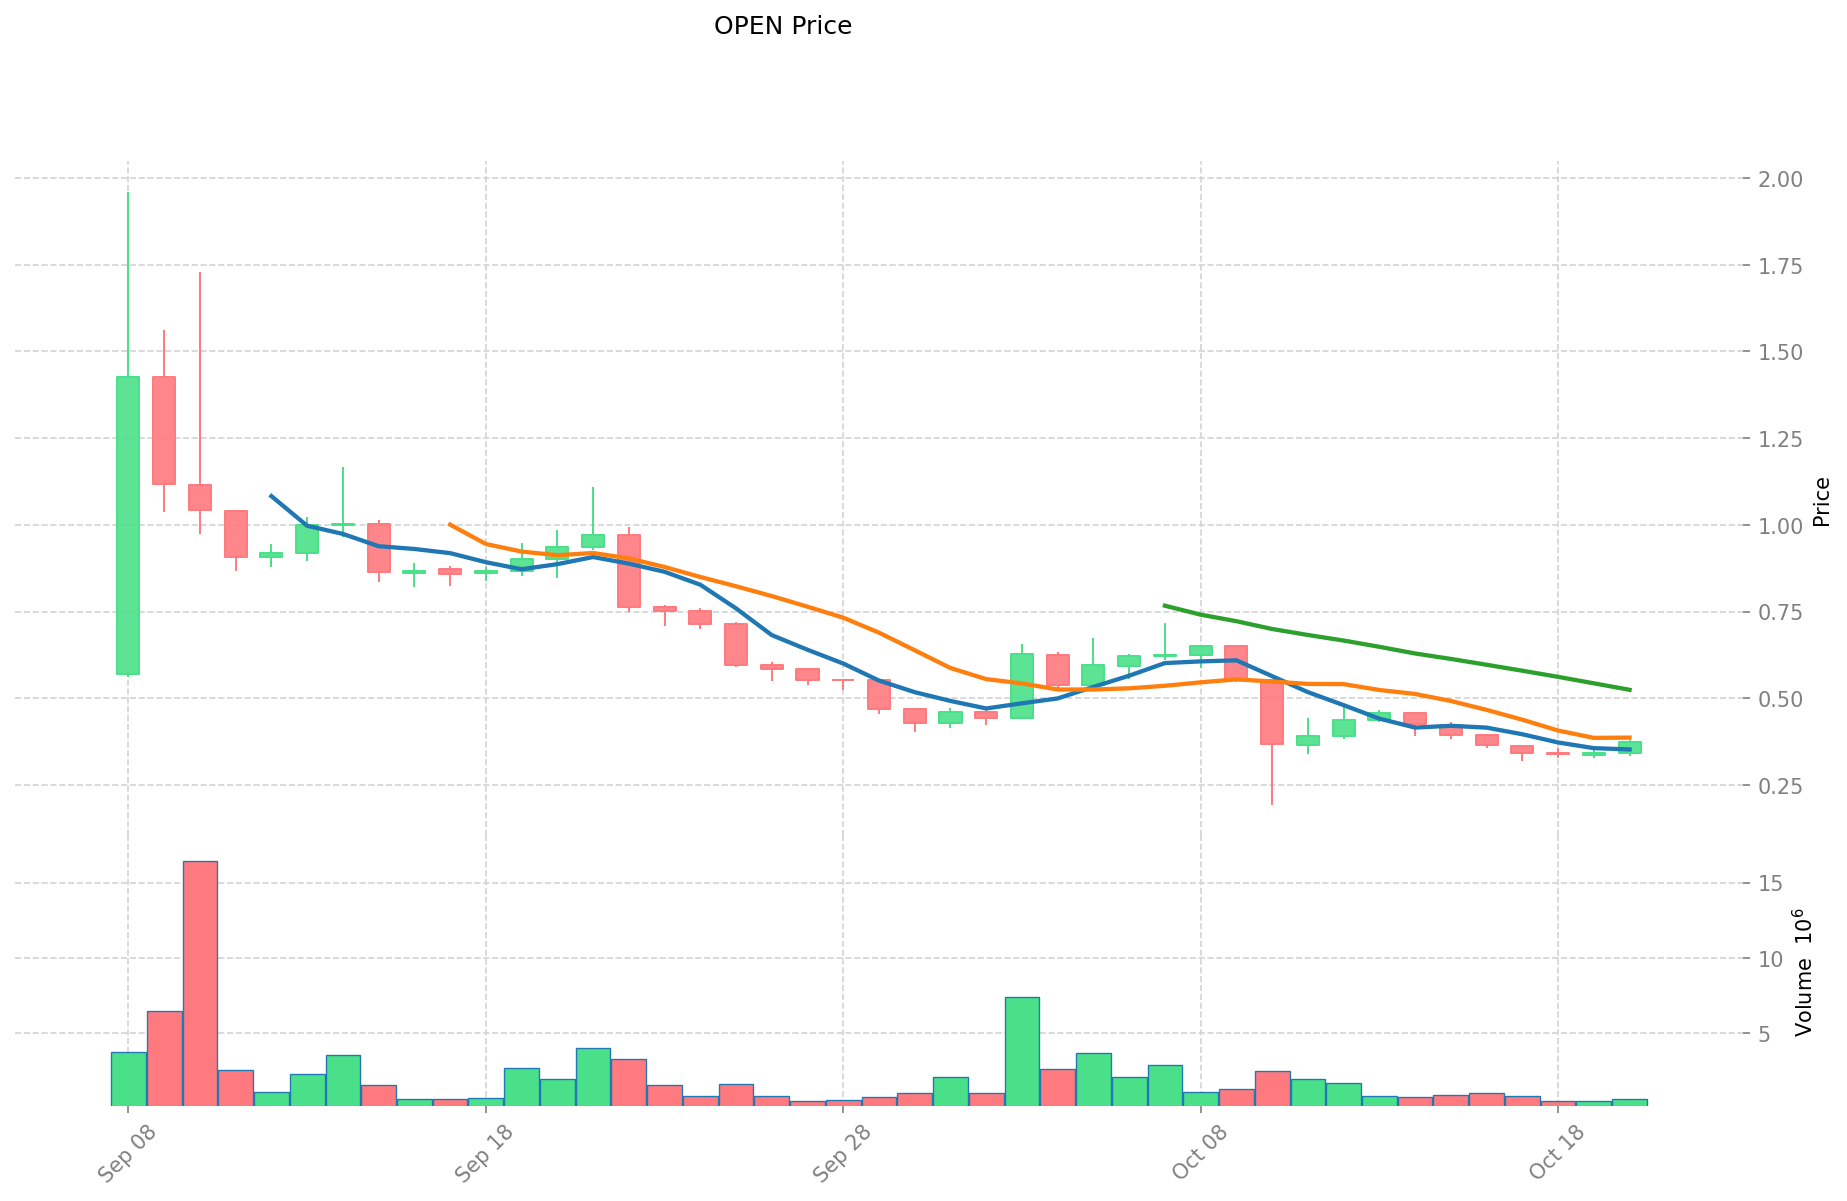
- 2025 September 8: OPEN reached its all-time high of $1.96
- 2025 October 10: OPEN hit its all-time low of $0.1911
- 2025 October 21: OPEN is experiencing a recovery, with the price at $0.3942
OPEN Current Market Situation
As of October 21, 2025, OPEN is trading at $0.3942, showing a significant 20.15% increase in the last 24 hours. The token has seen a substantial 7.35% gain in the past hour, indicating strong short-term momentum. However, the weekly performance shows an 8.38% decline, suggesting recent volatility.
The token's market capitalization stands at $84,950,100, with a circulating supply of 215,500,000 OPEN. The 24-hour trading volume is $294,135.70, reflecting moderate market activity. OPEN's fully diluted valuation is $394,200,000, with a total supply of 1,000,000,000 tokens.
OPEN is currently ranked 451st in the cryptocurrency market, with a market dominance of 0.010%. The circulating supply represents 21.55% of the total supply, indicating potential for future token releases.
Despite the recent positive momentum, OPEN is still down 59.54% over the past 30 days and 58.030% over the year, highlighting the challenges faced by the project in maintaining long-term price stability.
Click to view the current OPEN market price
OPEN Market Sentiment Indicator
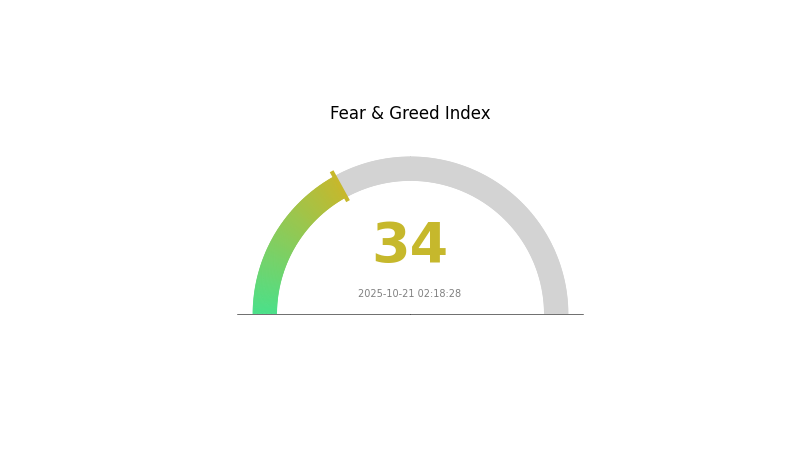
2025-10-21 Fear and Greed Index: 34 (Fear)
Click to view the current Fear & Greed Index
The crypto market sentiment remains cautious, with the Fear and Greed Index registering at 34, indicating a state of fear. This suggests investors are hesitant and potentially looking for buying opportunities. During such periods, it's crucial to stay informed and make rational decisions. Remember, market cycles are natural, and times of fear often precede periods of growth. Consider using Gate.com's advanced tools to navigate these market conditions and make informed investment choices.
OPEN Holdings Distribution
The address holdings distribution data for OPEN reveals a highly concentrated ownership structure. The top address holds a substantial 44.21% of the total supply, while the top five addresses collectively control 85.33% of OPEN tokens. This concentration level raises concerns about the token's decentralization and potential market vulnerabilities.
Such a concentrated distribution could have significant implications for OPEN's market dynamics. With a small number of addresses controlling the majority of tokens, there's an increased risk of price manipulation and volatility. Large holders, often referred to as "whales," have the potential to significantly impact the market through their trading activities. This concentration also suggests that the token's governance and decision-making processes may be dominated by a small group of stakeholders.
From a market structure perspective, this high concentration indicates a relatively low level of decentralization for OPEN. It may also point to limited circulation among retail investors, potentially affecting liquidity and trading volumes. Investors and analysts should closely monitor any changes in this distribution, as shifts in large holdings could signal important market movements or changes in the project's fundamentals.
Click to view the current OPEN Holdings Distribution
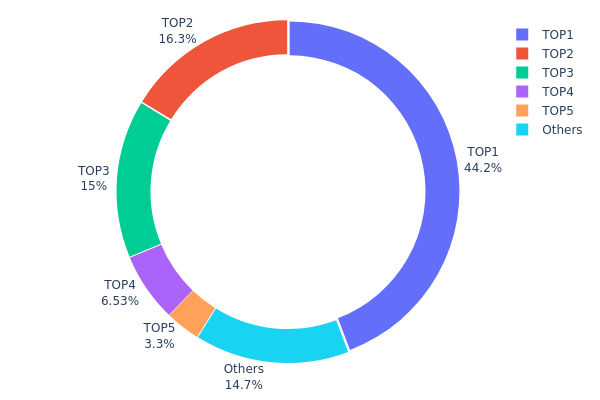
| Top | Address | Holding Qty | Holding (%) |
|---|---|---|---|
| 1 | 0xdcb5...dbb7fa | 442179.06K | 44.21% |
| 2 | 0x3755...41d9f3 | 162911.72K | 16.29% |
| 3 | 0x373c...6dba39 | 150000.00K | 15.00% |
| 4 | 0xb548...8cf679 | 65339.76K | 6.53% |
| 5 | 0x4532...fb9780 | 33000.09K | 3.30% |
| - | Others | 146569.37K | 14.67% |
II. Core Factors Affecting OPEN's Future Price
Supply Mechanism
- Halving: The periodic reduction in new token issuance could potentially lead to price increases if demand remains constant or grows.
- Historical Pattern: Previous halvings have generally been followed by significant price rallies in the medium term.
- Current Impact: The next halving event is anticipated to reduce supply inflation, potentially supporting price appreciation if demand sustains.
Institutional and Whale Dynamics
- Institutional Holdings: Major technology firms like Microsoft have established strategic partnerships with OPEN, potentially increasing institutional adoption and demand.
- Corporate Adoption: Collaborations with industry leaders such as Microsoft for AI infrastructure development could drive enterprise use and value.
- National Policies: Regulatory developments in AI governance may impact OPEN's operational landscape and market perception.
Macroeconomic Environment
- Monetary Policy Impact: Expected interest rate reductions by major central banks could increase investment appetite for high-growth assets like OPEN.
- Inflation Hedging Properties: In periods of high inflation, OPEN may be viewed as a store of value, potentially driving demand.
- Geopolitical Factors: Ongoing global tensions and trade disputes may influence risk appetite and capital flows into the AI sector.
Technological Development and Ecosystem Building
- AI Model Advancements: Continuous improvements in OPEN's AI models, such as enhanced memory and reasoning capabilities, could drive user adoption and market value.
- Infrastructure Expansion: Large-scale projects like the "Stargate Project" for AI infrastructure could significantly boost OPEN's capabilities and market position.
- Ecosystem Applications: The development of AI-powered tools and applications built on OPEN's platform may expand its utility and attract more users and developers.
III. OPEN Price Prediction for 2025-2030
2025 Outlook
- Conservative forecast: $0.39159 - $0.4351
- Neutral forecast: $0.4351 - $0.50
- Optimistic forecast: $0.50 - $0.56998 (requires significant market adoption)
2027-2028 Outlook
- Market phase expectation: Potential growth and consolidation
- Price range prediction:
- 2027: $0.5251 - $0.81819
- 2028: $0.57151 - $0.77154
- Key catalysts: Increased utility, market penetration, and technological advancements
2029-2030 Long-term Outlook
- Base scenario: $0.74296 - $0.80240 (assuming steady market growth)
- Optimistic scenario: $0.80240 - $0.86659 (assuming accelerated adoption)
- Transformative scenario: Above $0.86659 (extremely favorable market conditions)
- 2030-12-31: OPEN $0.8024 (potential 103% increase from current levels)
| 年份 | 预测最高价 | 预测平均价格 | 预测最低价 | 涨跌幅 |
|---|---|---|---|---|
| 2025 | 0.56998 | 0.4351 | 0.39159 | 10 |
| 2026 | 0.71863 | 0.50254 | 0.48244 | 27 |
| 2027 | 0.81819 | 0.61059 | 0.5251 | 54 |
| 2028 | 0.77154 | 0.71439 | 0.57151 | 81 |
| 2029 | 0.86184 | 0.74296 | 0.53493 | 88 |
| 2030 | 0.86659 | 0.8024 | 0.75425 | 103 |
IV. Professional Investment Strategies and Risk Management for OPEN
OPEN Investment Methodology
(1) Long-term Holding Strategy
- Suitable for: Long-term investors with a high risk tolerance
- Operation suggestions:
- Accumulate OPEN tokens during market dips
- Set price targets and regularly reassess investment thesis
- Store tokens in a secure hardware wallet
(2) Active Trading Strategy
- Technical analysis tools:
- Moving Averages: Use to identify trends and potential entry/exit points
- Relative Strength Index (RSI): Gauge overbought/oversold conditions
- Key points for swing trading:
- Monitor AI industry news and developments
- Set stop-loss orders to manage downside risk
OPEN Risk Management Framework
(1) Asset Allocation Principles
- Conservative investors: 1-3% of crypto portfolio
- Aggressive investors: 5-10% of crypto portfolio
- Professional investors: Up to 15% of crypto portfolio
(2) Risk Hedging Solutions
- Diversification: Spread investments across multiple AI and blockchain projects
- Options strategies: Consider using options to protect against downside risk
(3) Secure Storage Solutions
- Hardware wallet recommendation: Gate Web3 Wallet
- Cold storage solution: Offline storage of private keys
- Security precautions: Enable two-factor authentication, use strong passwords
V. Potential Risks and Challenges for OPEN
OPEN Market Risks
- Volatility: AI and crypto markets can experience extreme price swings
- Competition: Emerging AI blockchain projects may impact OPEN's market share
- Liquidity: Limited trading volumes could lead to slippage during large trades
OPEN Regulatory Risks
- AI regulation: Evolving AI regulations may impact OPEN's operations
- Cryptocurrency policies: Changes in global crypto regulations could affect adoption
- Data privacy laws: Stricter data protection measures may challenge OPEN's model
OPEN Technical Risks
- Smart contract vulnerabilities: Potential for exploits in OPEN's blockchain code
- Scalability issues: Possible network congestion as user base grows
- AI model limitations: Unforeseen challenges in AI model development and deployment
VI. Conclusion and Action Recommendations
OPEN Investment Value Assessment
OPEN presents a unique value proposition in the AI blockchain space, with potential for long-term growth. However, short-term volatility and regulatory uncertainties pose significant risks.
OPEN Investment Recommendations
✅ Beginners: Start with small positions, focus on education and understanding the technology ✅ Experienced investors: Consider a moderate allocation, actively manage positions ✅ Institutional investors: Conduct thorough due diligence, potentially engage in strategic partnerships
OPEN Trading Participation Methods
- Spot trading: Purchase OPEN tokens on Gate.com
- Staking: Participate in OPEN staking programs if available
- DeFi integration: Explore OPEN-based DeFi applications as they develop
Cryptocurrency investments carry extremely high risks, and this article does not constitute investment advice. Investors should make decisions carefully based on their own risk tolerance and are advised to consult professional financial advisors. Never invest more than you can afford to lose.
FAQ
Is OPEN a good stock to buy?
OPEN is a risky investment due to current unprofitability and market challenges. Despite recent gains, its declining revenue and low trading multiples make it difficult to recommend as a good buy.
Will OPEN stock keep going up?
OPEN's future is uncertain. Its recent rally is driven more by hype than fundamentals. Long-term performance depends on market conditions and company execution.
What is the price target of OPEN?
The price target for OPEN is $0.93, with estimates ranging from $0.68 to $1.30, based on analyst forecasts.
What is the future of Opendoor?
Opendoor aims to expand revenue through agents and adjacent seller services, focusing on providing a seamless moving experience and driving innovation in the real estate industry.
Share
Content