2025 OM Price Prediction: Analyzing Market Trends and Potential Growth Factors
Introduction: OM's Market Position and Investment Value
MANTRA (OM), as a security-first RWA Layer 1 blockchain, has been making significant strides since its inception in 2020. As of 2025, MANTRA's market cap has reached $130,526,528, with a circulating supply of approximately 1,091,358,933 tokens, and a price hovering around $0.1196. This asset, often referred to as a "regulatory-compliant blockchain solution," is playing an increasingly crucial role in the realm of institutional-grade blockchain applications.
This article will provide a comprehensive analysis of MANTRA's price trends from 2025 to 2030, considering historical patterns, market supply and demand, ecosystem development, and macroeconomic factors, offering professional price predictions and practical investment strategies for investors.
I. OM Price History Review and Current Market Status
OM Historical Price Evolution
- 2020: Initial launch, price started at $0.2
- 2023: Market downturn, price reached an all-time low of $0.01726188
- 2025: Bull market, price reached an all-time high of $8.99
OM Current Market Situation
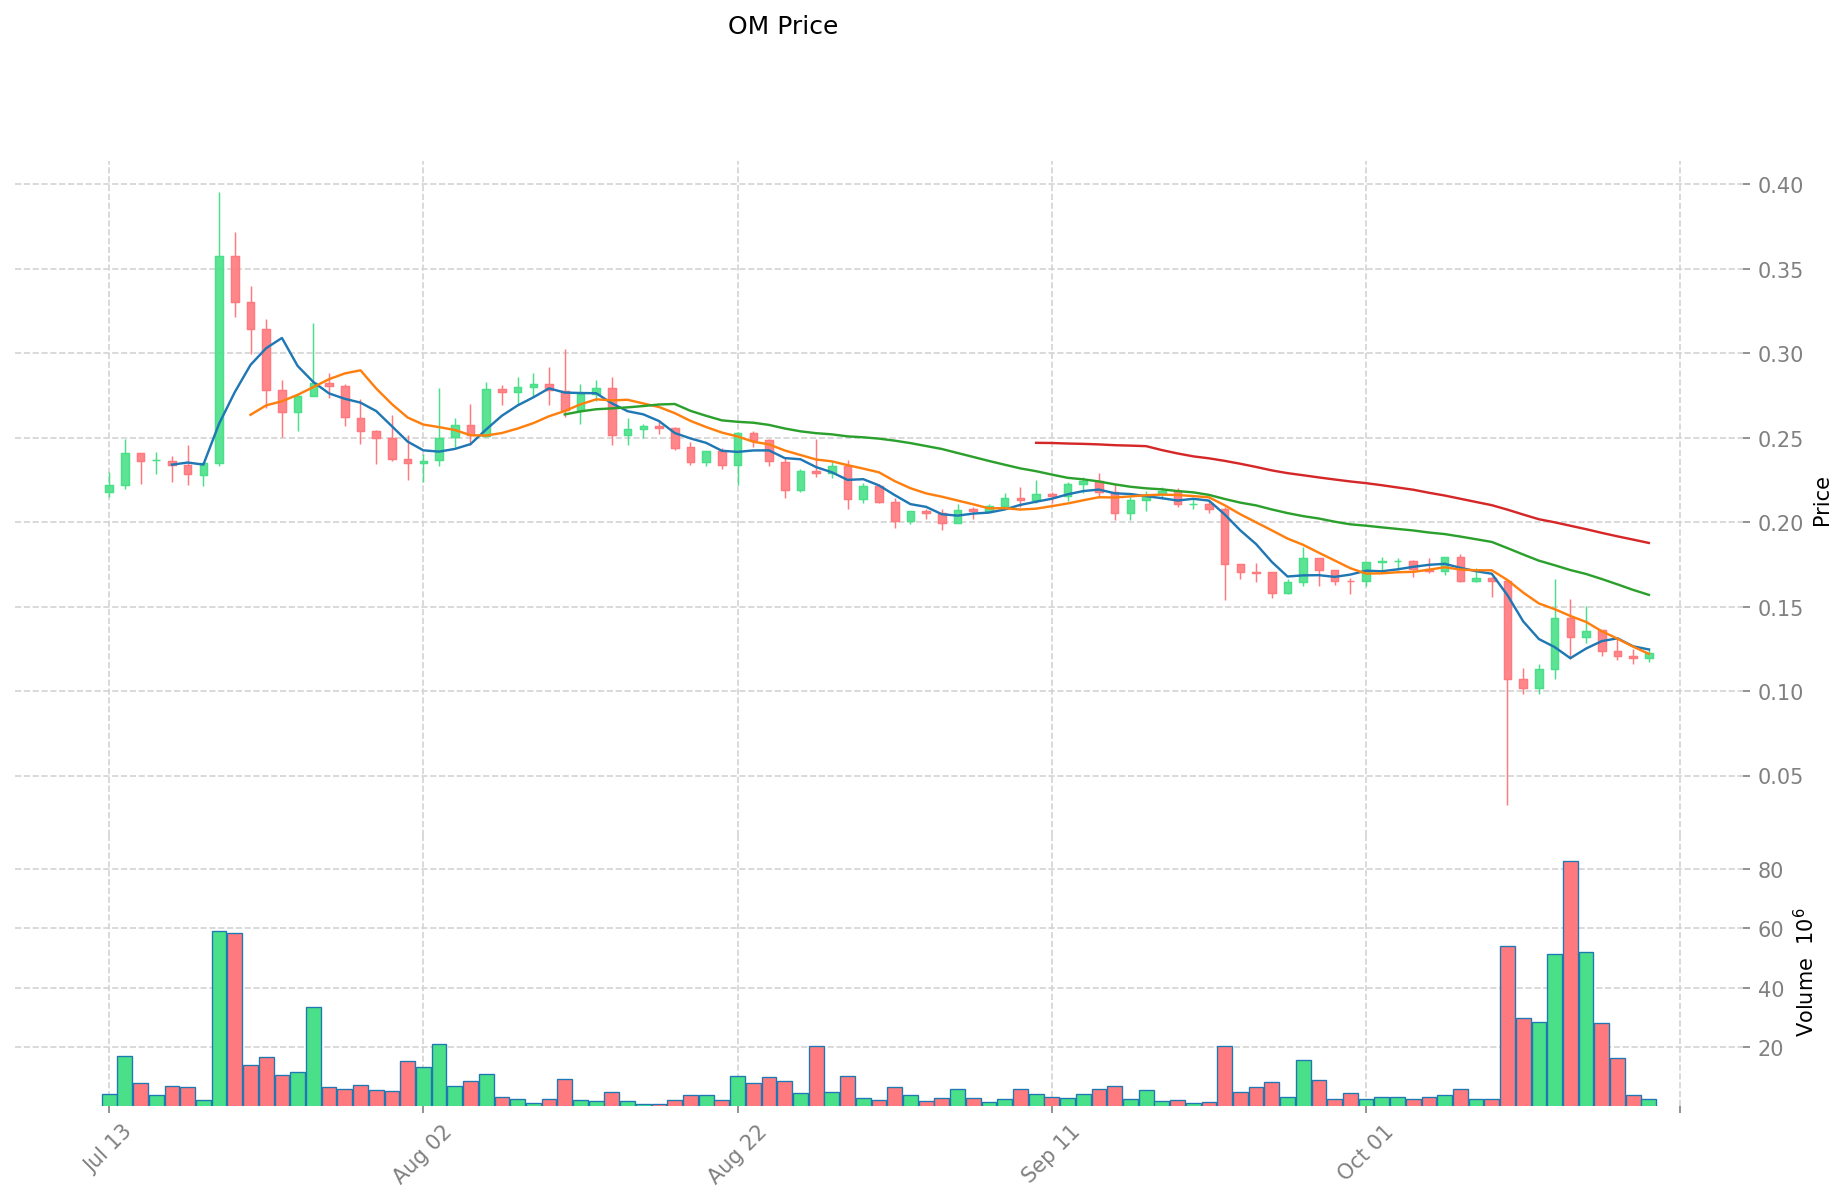
As of October 20, 2025, OM is trading at $0.1196, with a 24-hour trading volume of $346,121.85. The token has experienced a slight increase of 0.08% in the past 24 hours. OM's market capitalization currently stands at $130,526,528, ranking it 358th in the overall cryptocurrency market.
The token's price has shown mixed performance across different timeframes. While it has seen a 7.58% increase over the past week, it has experienced significant declines of 43.56% and 92.06% over the past month and year, respectively. This suggests a recent short-term recovery amid a longer-term downtrend.
OM's current price is significantly below its all-time high of $8.99, achieved on February 23, 2025, indicating a substantial correction from its peak. The market sentiment, as reflected by the VIX index of 29, suggests a state of fear among investors.
Click to view the current OM market price
OM Market Sentiment Indicator
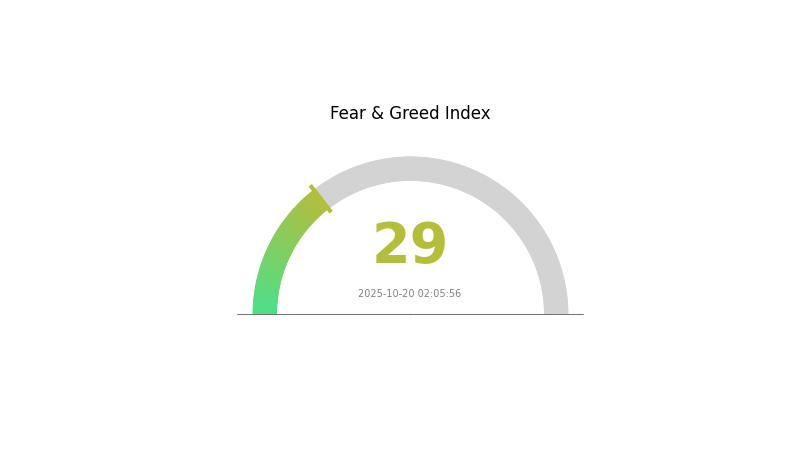
2025-10-20 Fear and Greed Index: 29 (Fear)
Click to view the current Fear & Greed Index
The crypto market is currently in a state of fear, with the Fear and Greed Index registering at 29. This indicates a cautious sentiment among investors, potentially signaling a buying opportunity for those who follow contrarian strategies. However, it's crucial to remember that market conditions can change rapidly. Investors should conduct thorough research and consider their risk tolerance before making any decisions. As always, diversification and a long-term perspective are key to navigating volatile markets.
OM Holdings Distribution
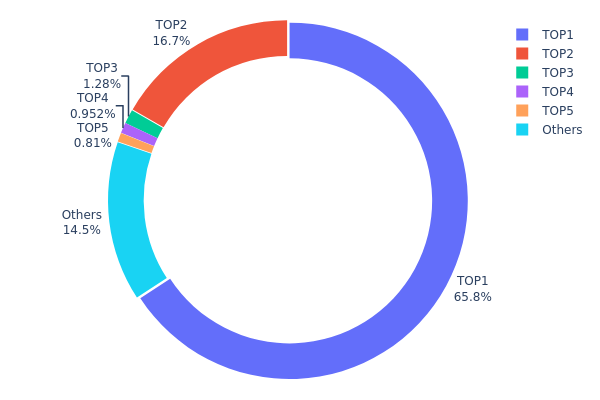
The address holdings distribution data provides crucial insights into the concentration of OM tokens across various addresses. Analysis of this data reveals a highly concentrated distribution pattern. The top address, likely a burn address (0x0000...00dead), holds a significant 65.80% of the total supply, effectively removing these tokens from circulation. The second-largest holder possesses 16.68% of the supply, indicating substantial control over the token's liquidity.
This concentration raises concerns about market stability and potential price manipulation. With over 82% of tokens held by just two addresses, the OM market structure appears vulnerable to large-scale movements that could trigger significant price volatility. The remaining top holders control relatively small percentages, with the third-largest address holding only 1.27% of the supply. This imbalance suggests a centralized token distribution, which may impact the project's perceived decentralization and governance structure.
The current distribution pattern reflects a market with limited on-chain diversity and potentially compromised stability. While the large burn address positively reduces circulating supply, the concentration in the second-largest address may pose risks to market dynamics and could influence investor confidence in the token's long-term prospects.
Click to view the current OM holdings distribution
| Top | Address | Holding Qty | Holding (%) |
|---|---|---|---|
| 1 | 0x0000...00dead | 584923.94K | 65.80% |
| 2 | 0x073f...113ad7 | 148307.31K | 16.68% |
| 3 | 0xa312...4ab647 | 11376.08K | 1.27% |
| 4 | 0x91d4...c8debe | 8458.56K | 0.95% |
| 5 | 0x9e15...feba93 | 7204.21K | 0.81% |
| - | Others | 128618.79K | 14.49% |
II. Core Factors Influencing OM's Future Price
Supply Mechanism
- Staking Rewards: OM token holders can stake their tokens to earn rewards, potentially reducing circulating supply.
- Current Impact: The staking mechanism may create temporary supply constraints, potentially supporting price stability.
Macroeconomic Environment
- Inflation Hedging Properties: As a cryptocurrency, OM may be viewed as a potential hedge against inflation, similar to other digital assets.
Technical Development and Ecosystem Building
- MANTRA DAO Platform: The development and adoption of the MANTRA DAO platform could drive demand for OM tokens.
- Ecosystem Applications: DeFi services offered through MANTRA DAO, including lending, borrowing, and staking, may increase utility and demand for OM tokens.
III. OM Price Prediction for 2025-2030
2025 Outlook
- Conservative prediction: $0.07841 - $0.1188
- Neutral prediction: $0.1188 - $0.13781
- Optimistic prediction: $0.13781 - $0.15 (requires strong market recovery and increased adoption)
2027-2028 Outlook
- Market phase expectation: Potential consolidation and growth phase
- Price range forecast:
- 2027: $0.105 - $0.20046
- 2028: $0.16 - $0.21574
- Key catalysts: Technological advancements, broader market trends, and potential partnerships
2029-2030 Long-term Outlook
- Base scenario: $0.19776 - $0.24423 (assuming steady market growth and adoption)
- Optimistic scenario: $0.24423 - $0.30773 (with accelerated adoption and favorable market conditions)
- Transformative scenario: $0.30773 - $0.35 (with breakthrough use cases and mainstream integration)
- 2030-12-31: OM $0.24423 (projected average price for 2030)
| 年份 | 预测最高价 | 预测平均价格 | 预测最低价 | 涨跌幅 |
|---|---|---|---|---|
| 2025 | 0.13781 | 0.1188 | 0.07841 | 0 |
| 2026 | 0.18989 | 0.1283 | 0.09751 | 7 |
| 2027 | 0.20046 | 0.1591 | 0.105 | 33 |
| 2028 | 0.21574 | 0.17978 | 0.16 | 50 |
| 2029 | 0.2907 | 0.19776 | 0.17996 | 65 |
| 2030 | 0.30773 | 0.24423 | 0.14165 | 104 |
IV. Professional Investment Strategies and Risk Management for OM
OM Investment Methodology
(1) Long-term Holding Strategy
- Suitable for: Investors with high risk tolerance and belief in MANTRA's long-term potential
- Operation suggestions:
- Accumulate OM tokens during market dips
- Set price targets for partial profit-taking
- Store tokens in secure hardware wallets or reputable custodial services
(2) Active Trading Strategy
- Technical analysis tools:
- Moving Averages: Use to identify trends and potential reversal points
- Relative Strength Index (RSI): Helps in identifying overbought or oversold conditions
- Key points for swing trading:
- Monitor MANTRA's development progress and partnerships
- Set stop-loss orders to limit potential losses
OM Risk Management Framework
(1) Asset Allocation Principles
- Conservative investors: 1-3% of crypto portfolio
- Aggressive investors: 5-10% of crypto portfolio
- Professional investors: Up to 15% of crypto portfolio, depending on risk appetite
(2) Risk Hedging Solutions
- Diversification: Spread investments across multiple cryptocurrencies and traditional assets
- Use of stop-loss orders: Implement to limit potential losses
(3) Secure Storage Solutions
- Hot wallet recommendation: Gate Web3 wallet
- Cold storage solution: Hardware wallets for long-term holdings
- Security precautions: Enable two-factor authentication, use strong passwords, and be cautious of phishing attempts
V. Potential Risks and Challenges for OM
OM Market Risks
- High volatility: OM price can experience significant fluctuations
- Competition: Other RWA and Layer 1 blockchain projects may impact MANTRA's market share
- Market sentiment: General crypto market trends can affect OM's price regardless of project fundamentals
OM Regulatory Risks
- Changing regulations: New laws or regulations could impact MANTRA's operations or token utility
- Cross-border compliance: Ensuring compliance across multiple jurisdictions may be challenging
- Institutional adoption: Regulatory uncertainty may slow down institutional uptake
OM Technical Risks
- Smart contract vulnerabilities: Potential bugs or exploits in the blockchain code
- Scalability challenges: Possible network congestion as adoption increases
- Interoperability issues: Difficulties in integrating with other blockchain networks or traditional systems
VI. Conclusion and Action Recommendations
OM Investment Value Assessment
MANTRA (OM) presents a unique value proposition as a security-focused RWA Layer 1 blockchain. While it offers potential for long-term growth, particularly in the institutional and regulatory-compliant blockchain space, short-term volatility and market risks should be carefully considered.
OM Investment Recommendations
✅ Beginners: Start with small positions, focus on education about MANTRA's technology and use cases ✅ Experienced investors: Consider a balanced approach, combining long-term holding with tactical trading around key events or market movements ✅ Institutional investors: Evaluate MANTRA's regulatory compliance features and potential for integration with existing systems
OM Trading Participation Methods
- Spot trading: Buy and hold OM tokens on Gate.com
- Staking: Participate in staking programs if available to earn passive income
- DeFi participation: Explore decentralized finance opportunities within the MANTRA ecosystem, if applicable
Cryptocurrency investments carry extremely high risks, and this article does not constitute investment advice. Investors should make decisions based on their own risk tolerance and are advised to consult professional financial advisors. Never invest more than you can afford to lose.
FAQ
What is the future of OM coin?
OM coin's future looks promising, with potential for significant growth. As Web3 adoption increases, OM's role in decentralized finance may expand, possibly leading to higher demand and value by 2025.
How high can an Om coin go?
Om coin could potentially reach $10 by 2026, driven by increased adoption and market demand. However, cryptocurrency prices are highly volatile and unpredictable.
What is the price prediction for Om Mantra in 2030?
Based on market trends and potential growth, Om Mantra's price could reach $5 to $7 by 2030, reflecting a significant increase from its current value.
Is Om Mantra a buy or sell?
Based on current market trends, Om Mantra appears to be a buy. Its innovative blockchain solutions and growing adoption suggest potential for price appreciation in the near future.
Share
Content