2025 NBOT Price Prediction: Analyzing Market Trends and Potential Growth Factors for the Emerging Cryptocurrency
Introduction: NBOT's Market Position and Investment Value
NBOT (NBOT), as a token on the Naka chain launched by the Bodhi team, has made significant strides since its inception in 2019. As of 2025, NBOT's market capitalization has reached $192,525, with a circulating supply of approximately 21,332,428 tokens, and a price hovering around $0.009025. This asset, known for its role in DeFi ecosystems, is playing an increasingly crucial role in prediction markets and synthetic asset trading.
This article will comprehensively analyze NBOT's price trends from 2025 to 2030, combining historical patterns, market supply and demand, ecosystem development, and macroeconomic factors to provide investors with professional price predictions and practical investment strategies.
I. NBOT Price History Review and Current Market Status
NBOT Historical Price Evolution
- 2019: NBOT launched, reaching an all-time high of $0.076389 on June 24
- 2020: Market downturn, price dropped to an all-time low of $0.00190929 on March 13
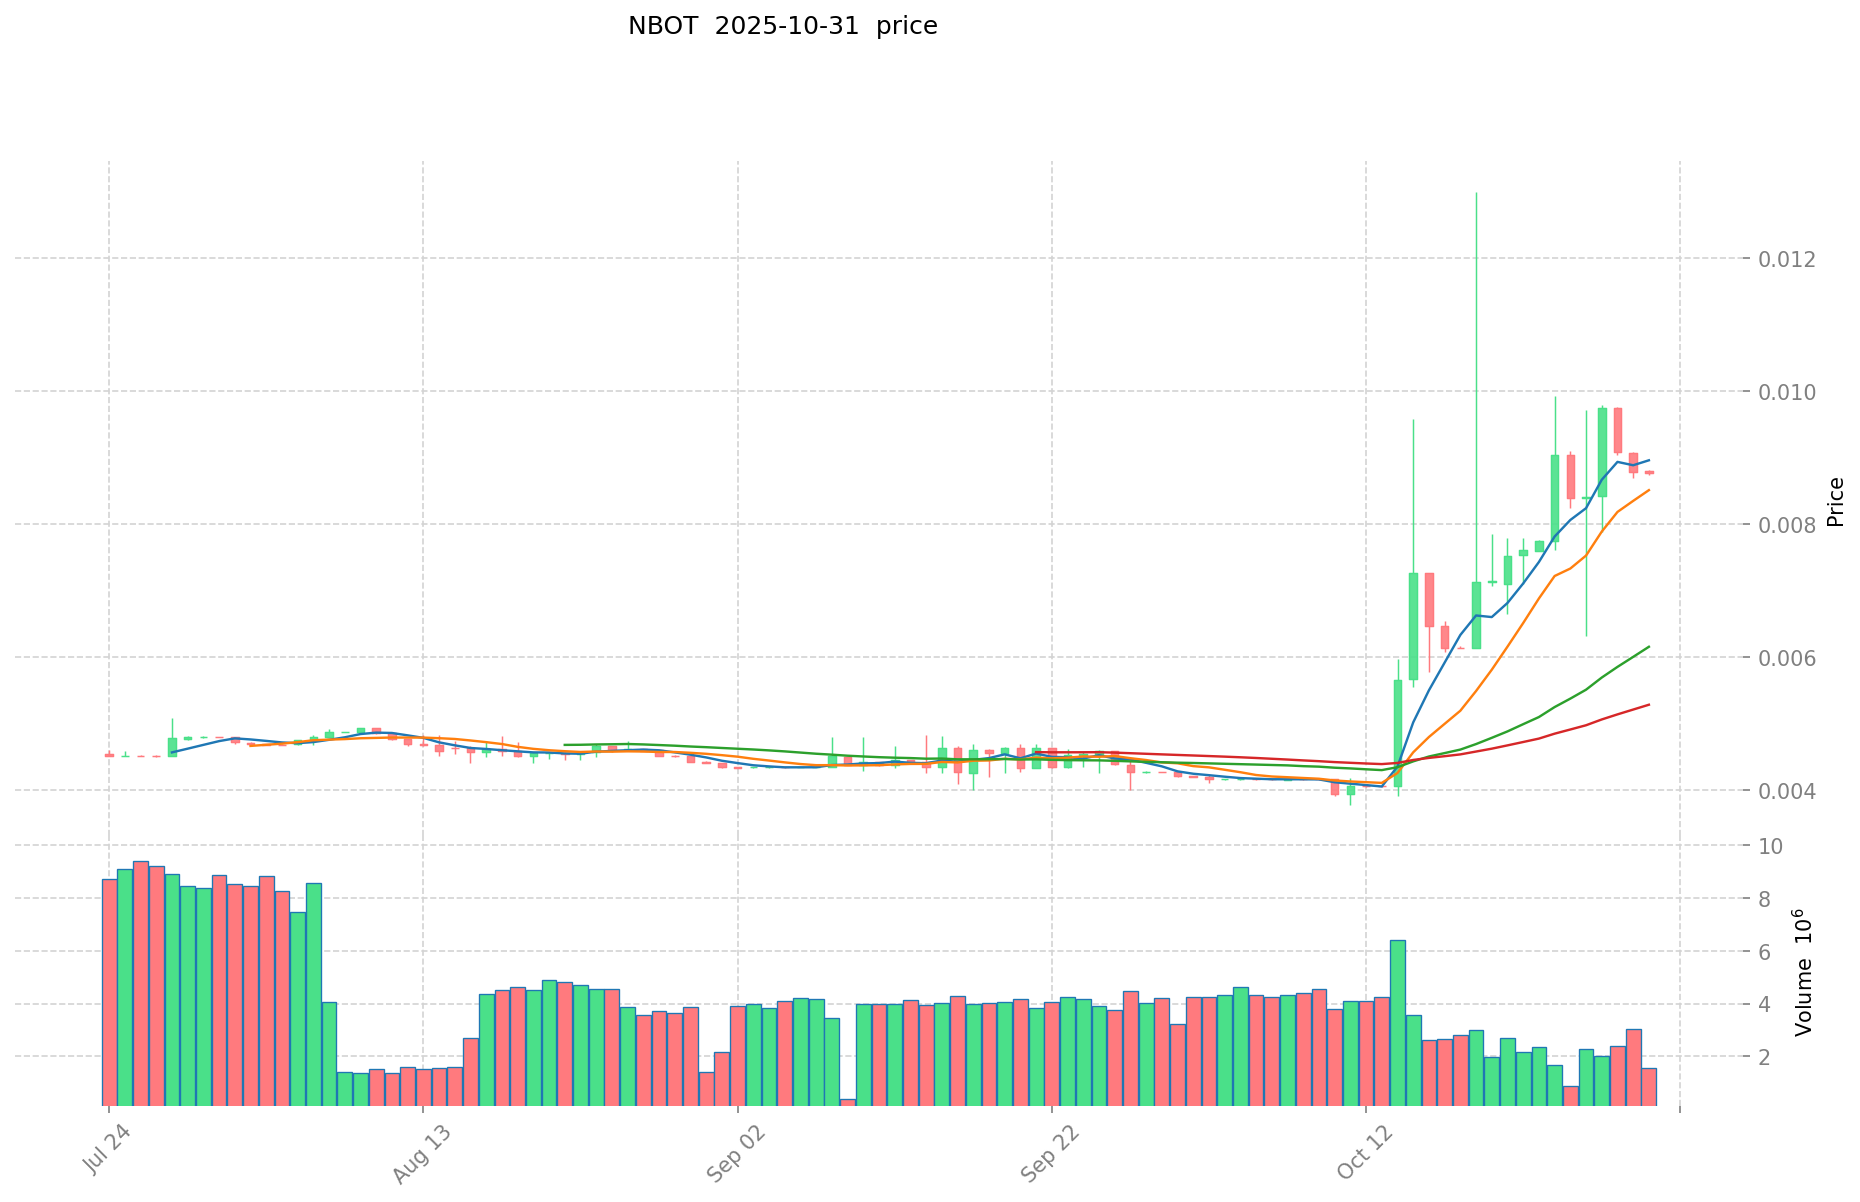
- 2025: Significant recovery, price surged by 127.77% over the past year
NBOT Current Market Situation
As of November 1, 2025, NBOT is trading at $0.009025. The token has shown remarkable growth over the past month, with a 113.65% increase in price. In the last 24 hours, NBOT has experienced a positive momentum, gaining 2.15%. However, the short-term trend appears mixed, with a slight decline of 0.52% over the past week and a minor decrease of 0.31% in the last hour.
NBOT's market capitalization currently stands at $192,525, ranking it 4380th in the overall cryptocurrency market. The token has a circulating supply of 21,332,428 NBOT, which represents 21.33% of its total supply of 100,000,000 tokens. The fully diluted valuation of NBOT is $902,500.
Trading volume in the last 24 hours reached $9,650, indicating moderate market activity. The token is currently held by 786 addresses, suggesting a relatively small but potentially dedicated community of supporters.
Click to view the current NBOT market price
NBOT Market Sentiment Indicator
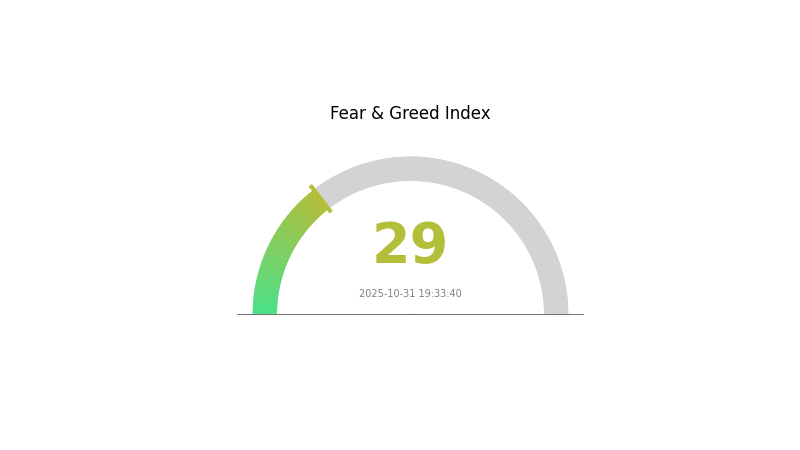
2025-10-31 Fear and Greed Index: 29 (Fear)
Click to view the current Fear & Greed Index
The crypto market sentiment remains cautious as the Fear and Greed Index hovers at 29, indicating a fearful atmosphere. This suggests investors are hesitant and potentially looking for safer options. However, for contrarian traders, periods of fear often present buying opportunities. It's crucial to remember that market sentiment can shift rapidly, and investors should always conduct thorough research before making decisions. Stay informed and trade wisely on Gate.com, where you can access a wide range of crypto assets and trading tools.
NBOT Holdings Distribution
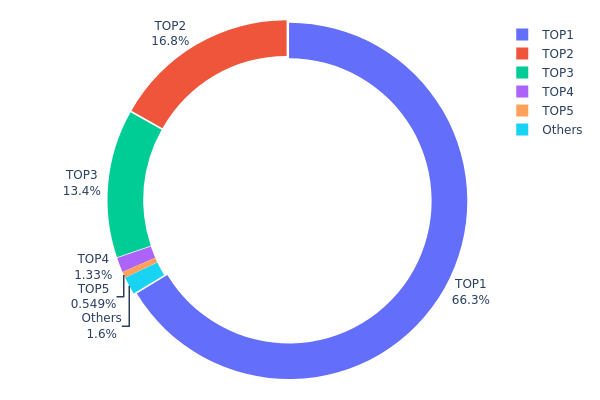
The address holdings distribution data provides crucial insights into the concentration of NBOT tokens among different wallet addresses. Analysis of this data reveals a highly concentrated distribution pattern, with the top address holding a significant 66.29% of the total supply. The top three addresses collectively control 96.5% of NBOT tokens, indicating an extremely centralized ownership structure.
This high concentration of tokens in a few addresses raises concerns about market manipulation risks and potential price volatility. The dominant holders have substantial influence over the token's supply and could significantly impact market dynamics if they decide to buy or sell large quantities. Such concentration also challenges the principle of decentralization, which is often considered a cornerstone of blockchain projects.
From a market perspective, this distribution suggests a relatively illiquid and potentially unstable market structure for NBOT. The limited distribution among retail holders (only 1.63% held by addresses outside the top 5) may result in reduced trading activity and increased susceptibility to price swings based on the actions of major holders.
Click to view the current NBOT Holdings Distribution
| Top | Address | Holding Qty | Holding (%) |
|---|---|---|---|
| 1 | 0xd6a8...e8c960 | 66294.10K | 66.29% |
| 2 | 0x0d07...b492fe | 16816.48K | 16.81% |
| 3 | 0x2b72...cb33cb | 13407.32K | 13.40% |
| 4 | 0xfd4d...2cebc4 | 1333.16K | 1.33% |
| 5 | 0xbc4b...205b9d | 549.35K | 0.54% |
| - | Others | 1599.58K | 1.63% |
II. Key Factors Influencing NBOT's Future Price
Supply Mechanism
- Market Sentiment: The overall cryptocurrency market sentiment, especially the price trends of major cryptocurrencies like Bitcoin (BTC) and Ethereum (ETH), directly impacts the entire crypto market, including NBOT.
Institutional and Whale Dynamics
- Enterprise Adoption: The adoption of NBOT by well-known enterprises could significantly influence its price.
Macroeconomic Environment
- Geopolitical Factors: International situations may impact NBOT's price.
Technological Development and Ecosystem Building
- Ecosystem Applications: The development of main DApps and ecosystem projects related to NBOT could affect its price.
III. NBOT Price Prediction for 2025-2030
2025 Outlook
- Conservative prediction: $0.00767 - $0.00903
- Neutral prediction: $0.00903 - $0.01038
- Optimistic prediction: $0.01038 - $0.01100 (requires significant market adoption)
2027-2028 Outlook
- Market stage expectation: Potential growth phase with increased volatility
- Price range forecast:
- 2027: $0.00948 - $0.01423
- 2028: $0.00669 - $0.01726
- Key catalysts: Technological advancements, wider ecosystem integration
2029-2030 Long-term Outlook
- Base scenario: $0.01000 - $0.01508 (assuming steady market growth)
- Optimistic scenario: $0.01508 - $0.01704 (with strong project developments)
- Transformative scenario: $0.01704 - $0.02000 (with breakthrough innovations and mass adoption)
- 2030-12-31: NBOT $0.01704 (potential peak based on optimistic projections)
| 年份 | 预测最高价 | 预测平均价格 | 预测最低价 | 涨跌幅 |
|---|---|---|---|---|
| 2025 | 0.01038 | 0.00903 | 0.00767 | 0 |
| 2026 | 0.01048 | 0.0097 | 0.00922 | 7 |
| 2027 | 0.01423 | 0.01009 | 0.00948 | 11 |
| 2028 | 0.01726 | 0.01216 | 0.00669 | 34 |
| 2029 | 0.01545 | 0.01471 | 0.01 | 63 |
| 2030 | 0.01704 | 0.01508 | 0.0095 | 67 |
IV. NBOT Professional Investment Strategy and Risk Management
NBOT Investment Methodology
(1) Long-term Holding Strategy
- Suitable for: Risk-tolerant investors with a long-term outlook
- Operation suggestions:
- Accumulate NBOT during market dips
- Set price targets for partial profit-taking
- Store NBOT in a secure wallet with regular backups
(2) Active Trading Strategy
- Technical analysis tools:
- Moving Averages: Use to identify trends and potential reversal points
- RSI: Monitor overbought and oversold conditions
- Key points for swing trading:
- Set clear entry and exit points
- Use stop-loss orders to manage risk
NBOT Risk Management Framework
(1) Asset Allocation Principles
- Conservative investors: 1-3% of crypto portfolio
- Aggressive investors: 5-10% of crypto portfolio
- Professional investors: Up to 15% of crypto portfolio
(2) Risk Hedging Solutions
- Diversification: Spread investments across multiple cryptocurrencies
- Stop-loss orders: Implement to limit potential losses
(3) Secure Storage Solutions
- Hardware wallet recommendation: Gate Web3 Wallet
- Software wallet solution: Use reputable mobile or desktop wallets
- Security precautions: Enable two-factor authentication, use strong passwords
V. Potential Risks and Challenges for NBOT
NBOT Market Risks
- High volatility: NBOT price may experience significant fluctuations
- Limited liquidity: May face challenges in executing large trades
- Market sentiment: Susceptible to broader crypto market trends
NBOT Regulatory Risks
- Regulatory uncertainty: Potential for new regulations affecting NBOT
- Compliance requirements: May need to adapt to evolving legal frameworks
- Cross-border restrictions: Possible limitations on international transactions
NBOT Technical Risks
- Smart contract vulnerabilities: Potential for exploits or bugs
- Network congestion: May experience delays during high-traffic periods
- Technological obsolescence: Risk of being outpaced by newer blockchain projects
VI. Conclusion and Action Recommendations
NBOT Investment Value Assessment
NBOT presents a high-risk, high-potential investment opportunity within the DeFi space. While its innovative approach to prediction markets and synthetic assets trading offers long-term value, investors should be prepared for significant short-term volatility and regulatory uncertainties.
NBOT Investment Recommendations
✅ Beginners: Start with small positions and focus on education
✅ Experienced investors: Consider allocating a portion of high-risk portfolio to NBOT
✅ Institutional investors: Conduct thorough due diligence and consider NBOT as part of a diversified crypto strategy
NBOT Trading Participation Methods
- Spot trading: Buy and sell NBOT on Gate.com
- DeFi participation: Engage with NBOT's ecosystem through deerfi.com
- Liquidity provision: Consider adding liquidity to NBOT pools for potential returns
Cryptocurrency investments carry extremely high risks, and this article does not constitute investment advice. Investors should make decisions carefully based on their own risk tolerance and are advised to consult professional financial advisors. Never invest more than you can afford to lose.
FAQ
Is notcoin worth buying?
Yes, Notcoin is worth buying in 2025. It continues to show a bullish trend and strong growth potential, making it an attractive investment option.
What will Neo be worth in 5 years?
In 5 years, Neo is projected to be worth around $12.25. However, significant price volatility is possible in the crypto market. Predictions can vary widely.
How much is not coin worth in 2026?
Based on current projections, NBOT could be worth around $0.15-$0.20 by 2026, assuming continued growth and adoption in the Web3 ecosystem.
What is the price target for bot?
The price target for BOT is projected to reach $0.77, with potential highs of $2.00 and lows of $0.24 by 2026.
Share
Content
Introduction: NBOT's Market Position and Investment Value
I. NBOT Price History Review and Current Market Status
II. Key Factors Influencing NBOT's Future Price
III. NBOT Price Prediction for 2025-2030
IV. NBOT Professional Investment Strategy and Risk Management
V. Potential Risks and Challenges for NBOT
VI. Conclusion and Action Recommendations
FAQ

