2025 IDPrice Tahmini: Dijital Kimlik Değerlemelerinde Yükselen Eğilimler ve Piyasa Analizi

Giriş: ID'nin Piyasa Konumu ve Yatırım Potansiyeli
Space ID (ID), Web3 kimlikleri için evrensel bir isim hizmeti ağı olarak kurulduğundan bu yana önemli gelişmeler kaydetmiştir. 2025 itibarıyla Space ID'nin piyasa değeri 64.317.616 dolar, dolaşımdaki arzı yaklaşık 430.506.132 token ve fiyatı 0,1494 dolar civarındadır. "Web3 Kimlik Öncüsü" olarak bilinen bu varlık, blokzincir ekosisteminde merkeziyetsiz kimlik ve alan adı çözümleri sunmada giderek daha kritik bir rol üstlenmektedir.
Bu makalede, Space ID'nin 2025-2030 yılları arasındaki fiyat trendleri geçmiş veriler, piyasa arz-talep dengesi, ekosistem gelişimi ve makroekonomik faktörler eşliğinde kapsamlı biçimde analiz edilerek, yatırımcılara profesyonel fiyat öngörüleri ve uygulanabilir yatırım stratejileri sunulacaktır.
I. ID Fiyat Geçmişi ve Güncel Piyasa Durumu
ID Tarihsel Fiyat Seyri
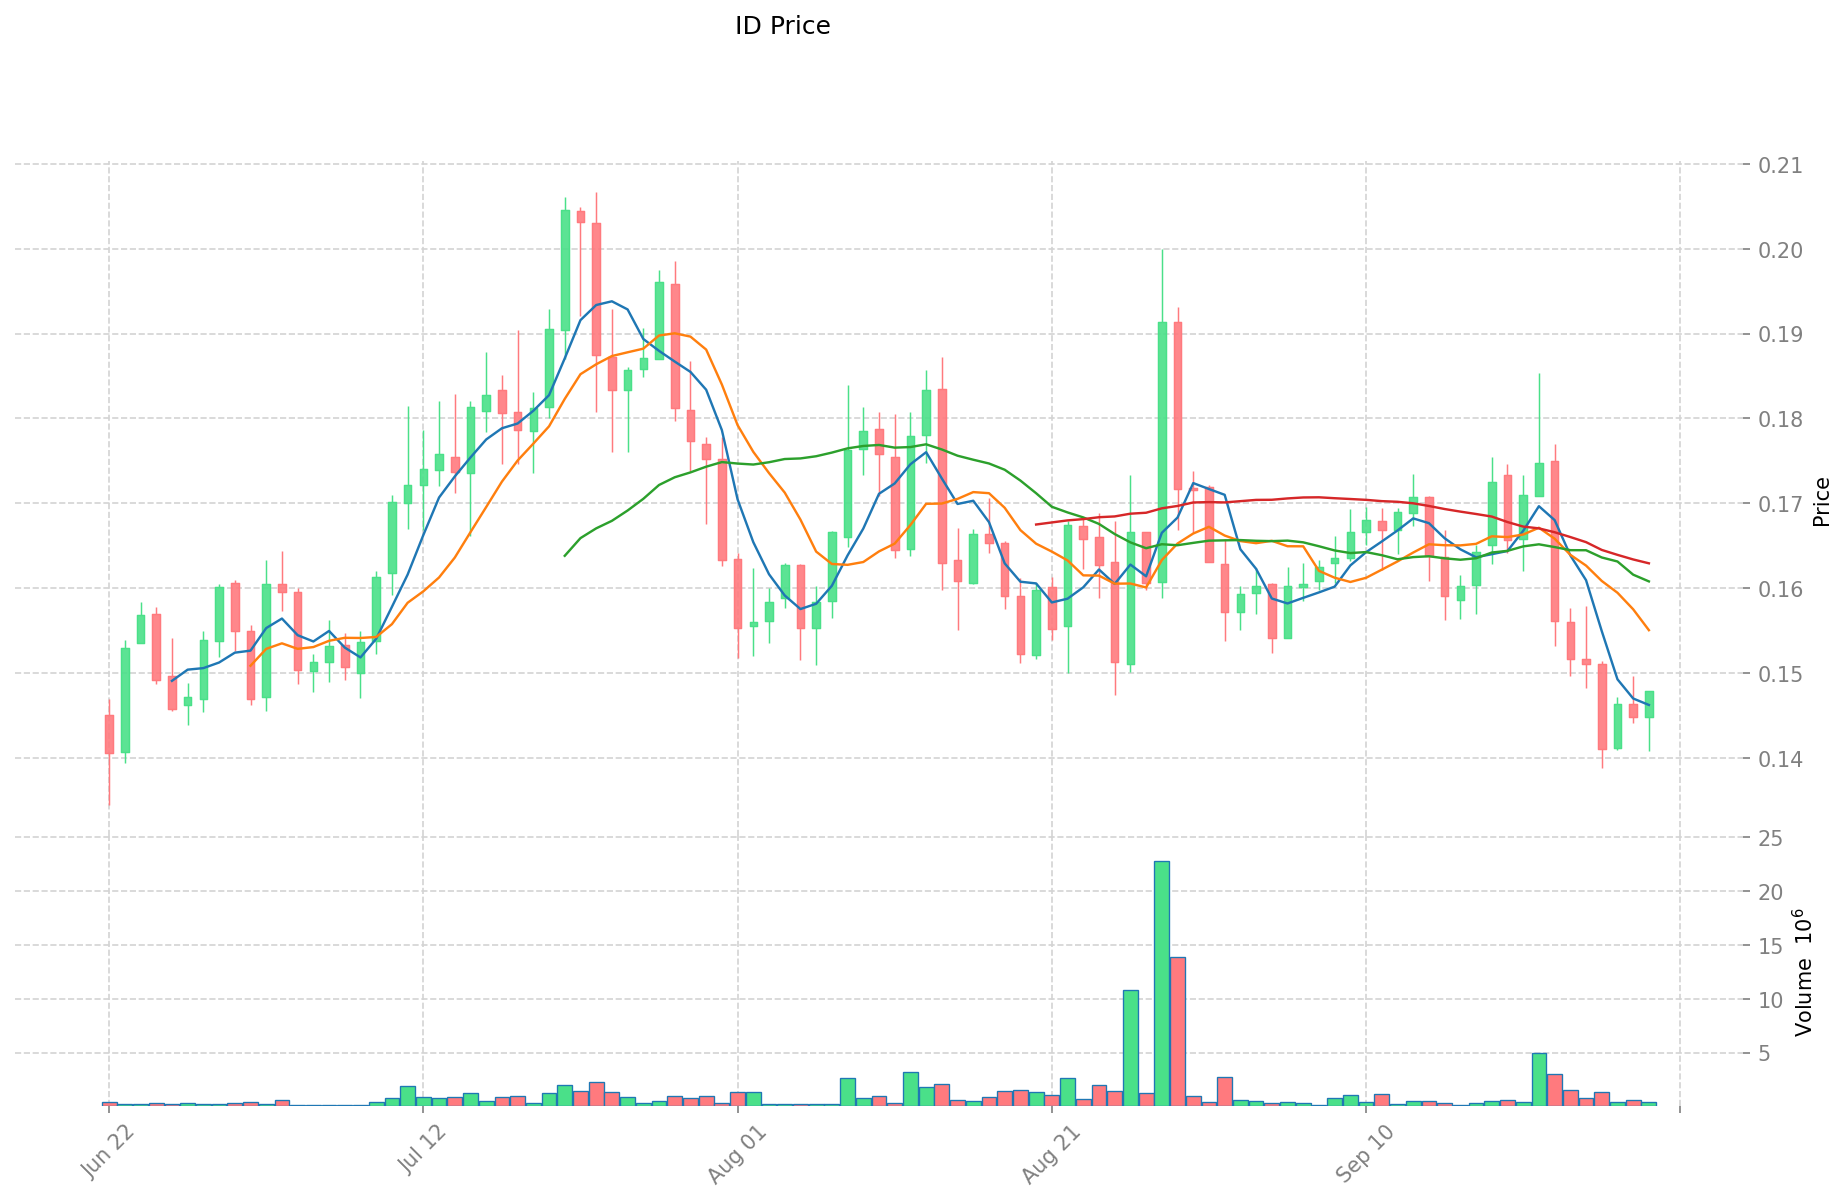
- 2024: 17 Mart'ta tüm zamanların en yüksek seviyesi olan 1,8404 dolara ulaştı
- 2025: 22 Haziran'da tüm zamanların en düşük seviyesi olan 0,1344 dolara indi; ciddi bir fiyat düşüşü yaşandı
ID Güncel Piyasa Görünümü
29 Eylül 2025 itibarıyla ID, 0,1494 dolardan işlem görüyor. Token, son 24 saatte %5,14 artış gösterdi ve işlem hacmi 131.306,72 dolar olarak gerçekleşti. Ancak, ID son bir haftada %5,45 değer kaybetti ve son 30 günde %14,01 oranında daha büyük bir düşüş yaşadı. Güncel piyasa değeri 64.317.616 dolar olup, ID kripto para piyasasında 599. sırada yer alıyor. Kısa vadeli yükselişlere rağmen, ID geçen yılki fiyatına göre %64,33 gerilemiş durumda; bu da uzun vadeli güçlü bir ayı trendini işaret ediyor.
Güncel ID piyasa fiyatını görüntüleyin
ID Piyasa Duyarlılığı Göstergesi
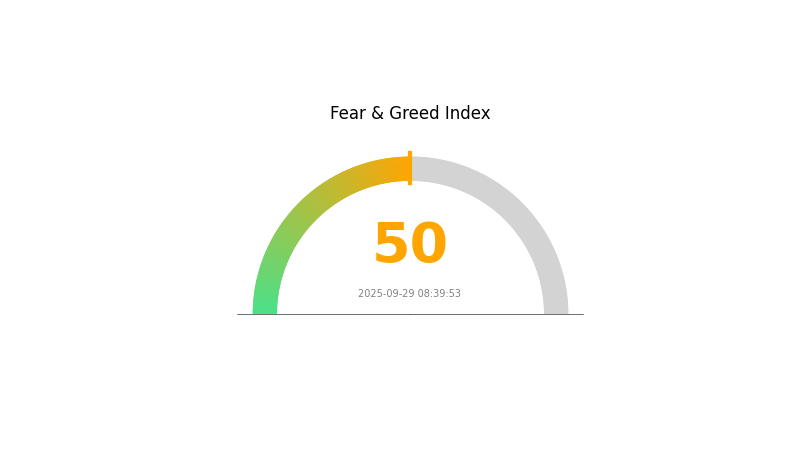
29 Eylül 2025 Korku ve Açgözlülük Endeksi: 50 (Nötr)
Güncel Korku ve Açgözlülük Endeksini görüntüleyin
Kripto piyasasında duyarlılık dengeli; Korku ve Açgözlülük Endeksi 50 seviyesinde. Bu nötr durumda yatırımcılar ne aşırı endişeli ne de aşırı hırslı. Yatırımcılar strateji ve portföylerini yeniden gözden geçirmeleri için uygun bir zaman. Piyasa aşırı duygusal bir tablo sergilemiyor; yine de yatırım kararlarından önce dikkatli olunmalı ve kapsamlı analiz yapılmalı. Gate.com, mevcut piyasa koşullarında yol gösterici araçlar ve kaynaklar sunar.
ID Varlık Dağılımı
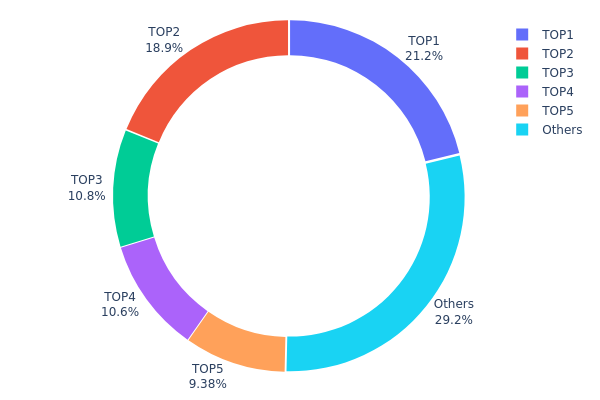
Adres bazlı varlık dağılımı verileri, ID tokenlerinin farklı adresler arasında nasıl dağıldığına dair önemli bir gösterge sunar. Analizler, ilk 5 adresin toplam arzın %70,79'unu elinde bulundurduğunu gösteriyor; bu da yüksek oranda yoğunlaşmış bir dağılıma işaret ediyor.
En büyük adres tüm tokenlerin %21,16'sını, ikinci en büyük adres ise %18,87'sini kontrol ediyor. Az sayıda adreste yüksek konsantrasyon, piyasa manipülasyonu ve fiyat oynaklığı riskini artırıyor. Bu merkezi yapı, büyük sahiplerin alım-satım faaliyetleriyle fiyatlarda önemli oynaklık yaratmasına yol açabilir.
Bu konsantrasyon seviyesi, ID token ekosisteminde merkeziyetsizliğin düşük olduğunu gösteriyor. Diğer adreslerde %29,21 oranında token bulunmasına rağmen, üst düzey sahiplerin hakimiyeti, piyasa istikrarı ve manipülasyon riskinin azaltılması için token dağılımının yaygınlaşması gerektiğine işaret ediyor. Mevcut dağılım, piyasa adaleti ve uzun vadeli sürdürülebilirlik konularında bazı yatırımcıların çekincelerine neden olabilir.
| Üst | Adres | Varlık Miktarı | Varlık (%) |
|---|---|---|---|
| 1 | 0x706a...896ab3 | 380.000,00K | 21,16% |
| 2 | 0xa490...204a66 | 338.834,99K | 18,87% |
| 3 | 0x4296...3a31f7 | 194.416,66K | 10,82% |
| 4 | 0x062a...9ddca6 | 189.783,25K | 10,57% |
| 5 | 0x48a6...740454 | 168.333,33K | 9,37% |
| - | Diğerleri | 523.984,94K | 29,21% |
II. Gelecek Dönem Altın Fiyatlarını Etkileyen Temel Unsurlar
Arz Mekanizması
- Madencilik Üretimi: Altın madenciliği üretimi son yıllarda 3.500-4.000 ton aralığında sabit kalmıştır.
- Tarihsel Eğilim: Arzda sınırlı büyüme, talep arttığında fiyatların yükselmesini sağlamıştır.
- Güncel Etki: Arz kısıtları altın fiyatını desteklemeyi sürdürmektedir; maden üretimi 2021'de 3.573 tondan 2024'te 3.673 tona yükselmiştir.
Kurumsal ve Büyük Sahip Dinamikleri
- Kurumsal Varlıklar: Merkez bankaları, özellikle gelişmekte olan ülkeler, altın rezervlerini artırmaktadır.
- Kurumsal Benimseme: Elektronik, havacılık ve tıbbi ekipman sektörlerinde endüstriyel altın talebi yükselmektedir.
- Devlet Politikaları: Birçok ülke, özellikle gelişen piyasalar, "dolarizasyonu azaltma" politikası ile altın rezervlerini artırıyor.
Makroekonomik Ortam
- Para Politikası Etkisi: FED ve diğer merkez bankalarının beklenen faiz indirimleri altın fiyatlarını destekleyebilir.
- Enflasyon Korumalı Özellikler: Altın, enflasyona karşı korunma aracı olarak cazibesini koruyor; küresel enflasyon baskıları sürecektir.
- Jeopolitik Faktörler: Devam eden jeopolitik gerilimler ve çatışmalar, altına güvenli liman talebini artırıyor.
Teknolojik Gelişim ve Ekosistem Oluşumu
- Finansal Yenilik: Altın ETF'lerinin ve vadeli işlemlerin popülaritesi, altının likiditesini ve finansal varlık olarak işlem hacmini arttırdı.
- Endüstriyel Kullanımlar: Yarı iletken, havacılık ve tıbbi cihaz sektörlerinde yaşanan teknolojik gelişmeler, endüstriyel altın talebini büyütüyor.
III. 2025-2030 Dönemi ID Fiyat Tahmini
2025 Öngörüsü
- Temkinli tahmin: 0,12866 - 0,14960 dolar
- Nötr tahmin: 0,14960 - 0,17877 dolar
- İyimser tahmin: 0,17877 - 0,20794 dolar (olumlu piyasa koşulları gerektirir)
2027-2028 Öngörüsü
- Piyasa aşaması beklentisi: Potansiyel büyüme dönemi
- Fiyat aralığı tahmini:
- 2027: 0,15267 - 0,25518 dolar
- 2028: 0,13725 - 0,24847 dolar
- Başlıca katalizörler: Piyasa benimsenmesi ve teknolojik ilerleme
2029-2030 Uzun Vadeli Görünüm
- Temel senaryo: 0,24256 - 0,27773 dolar (istikrarlı piyasa büyümesi varsayımıyla)
- İyimser senaryo: 0,27773 - 0,31290 dolar (güçlü piyasa performansı varsayımıyla)
- Dönüştürücü senaryo: 0,31290 - 0,32772 dolar (çığır açıcı gelişmeler varsayımıyla)
- 31 Aralık 2030: ID 0,27773 dolar (potansiyel ortalama fiyat)
| Yıl | Tahmini En Yüksek Fiyat | Tahmini Ortalama Fiyat | Tahmini En Düşük Fiyat | Değişim (%) |
|---|---|---|---|---|
| 2025 | 0,20794 | 0,1496 | 0,12866 | 0 |
| 2026 | 0,25743 | 0,17877 | 0,12693 | 19 |
| 2027 | 0,25518 | 0,2181 | 0,15267 | 45 |
| 2028 | 0,24847 | 0,23664 | 0,13725 | 58 |
| 2029 | 0,3129 | 0,24256 | 0,2086 | 62 |
| 2030 | 0,32772 | 0,27773 | 0,20274 | 85 |
IV. ID için Profesyonel Yatırım Stratejileri ve Risk Yönetimi
ID Yatırım Yöntemi
(1) Uzun Vadeli Tutma Stratejisi
- Uygun yatırımcı profili: Yüksek risk toleransına sahip ve Web3 teknolojilerine güvenen yatırımcılar
- Operasyon önerileri:
- Piyasa düşüşlerinde ID token biriktirin
- En az 2-3 yıl boyunca piyasadaki dalgalanmalara karşı pozisyonunuzu sürdürün
- Tokenleri güvenli bir donanım cüzdanında koruyun
(2) Aktif Al-Sat Stratejisi
- Teknik analiz araçları:
- Hareketli Ortalamalar: 50 ve 200 günlük MA ile trendleri belirleyin
- RSI: Aşırı alım ve aşırı satım sinyallerini takip edin
- Dalgalı al-sat için önemli noktalar:
- Zarar durdur emirleriyle olası kayıpları sınırlayın
- Önceden belirlenen fiyat hedeflerinde kar alın
ID Risk Yönetim Çerçevesi
(1) Varlık Dağılımı İlkeleri
- Temkinli yatırımcılar: Kripto portföyünün %1-3'ü
- Agresif yatırımcılar: Kripto portföyünün %5-10'u
- Profesyonel yatırımcılar: Kripto portföyünün %15'ine kadar
(2) Riskten Korunma Yöntemleri
- Diversifikasyon: Yatırımları farklı Web3 projelerine dağıtın
- Opsiyon ticareti: Düşüş riskine karşı satım opsiyonu kullanın
(3) Güvenli Saklama Çözümleri
- Sıcak cüzdan: Gate Web3 Cüzdan
- Soğuk saklama: Uzun vade için donanım cüzdanı kullanın
- Güvenlik önlemleri: İki aşamalı doğrulama etkinleştirin, güçlü şifreler seçin
V. ID için Potansiyel Riskler ve Zorluklar
ID Piyasa Riskleri
- Yüksek oynaklık: Kısa sürede büyük fiyat dalgalanmaları
- Düşük likidite: Büyük işlemlerde zorluk yaşanabilir
- Piyasa duyarlılığı: Genel kripto piyasası trendlerinden etkilenme
ID Düzenleyici Riskler
- Belirsiz düzenlemeler: Olumsuz regülasyon olasılığı
- Sınır ötesi uyum: Farklı mevzuatlara uyumda güçlük
- Vergi etkileri: Kripto varlıkların vergilendirilmesinde değişen yaklaşımlar
ID Teknik Riskler
- Akıllı sözleşme açıkları: Kod kusurlarının istismar riski
- Ölçeklenebilirlik sorunları: Ağ yoğunluğu arttığında performans sıkıntısı
- Uyumluluk: Diğer blokzincirlerle sorunsuz entegrasyon zorlukları
VI. Sonuç ve Eylem Önerileri
ID Yatırım Potansiyeli Değerlendirmesi
Space ID, Web3 alan adı ve kimlik piyasasında uzun vadeli potansiyele sahip olsa da kısa vadede volatilite ve düzenleyici belirsizliklerle karşı karşıya.
ID Yatırım Önerileri
✅ Yeni başlayanlar: Küçük miktarla başlayın, Web3 teknolojilerini öğrenmeye odaklanın ✅ Deneyimli yatırımcılar: Hem uzun vadeli tutma hem aktif al-sat ile dengeli stratejiyi değerlendirin ✅ Kurumsal yatırımcılar: Detaylı inceleme yapın, büyük işlemler için OTC seçeneklerini düşünün
ID Alım-Satım Katılım Yöntemleri
- Spot alım-satım: Gate.com üzerinden ID tokenı alıp satabilirsiniz
- Stake etme: Ek kazanç için stake etme programlarına katılın
- DeFi entegrasyonu: ID token ile merkeziyetsiz finans olanaklarını keşfedin
Kripto para yatırımları çok yüksek risk içerir; bu makale yatırım tavsiyesi niteliğinde değildir. Yatırımcılar kararlarını kendi risk toleranslarına göre vermeli ve profesyonel finans danışmanlarına başvurmalıdır. Asla kaybetmeyi göze alabileceğinizden fazlasını yatırmayın.
Sıkça Sorulan Sorular
1 inch 100 dolara ulaşır mı?
Çok düşük olasılık. 1inch'in 320 kat artarak 103 milyar dolar piyasa değerine erişmesi gerekir. Mevcut piyasa koşullarına göre bu olası değildir.
Cardano'nun 2025 fiyat öngörüsü nedir?
Cardano'nun Aralık 2025'te 1,16 - 1,17 dolar aralığında işlem görmesi beklenmektedir; bu, mevcut piyasa analiz ve trendlerine dayanmaktadır.
ID'nin fiyatı yükselir mi?
Kesin fiyat hareketini tahmin etmek zor olsa da, ID tokenı Web3 alanında büyüme potansiyeli göstermektedir. Piyasa eğilimleri ve artan benimseme fiyatı yükseltebilir.
2025'te bir sonraki Bitcoin olacak kripto para hangisi?
Bitcoin'in 2025 yılında 77.000 - 155.000 dolar aralığına çıkması bekleniyor. Bu dönemde başka bir kripto paranın Bitcoin'in hakimiyetini veya değerini yakalaması beklenmemektedir.
Share
Content
Giriş: ID'nin Piyasa Konumu ve Yatırım Potansiyeli
I. ID Fiyat Geçmişi ve Güncel Piyasa Durumu
II. Gelecek Dönem Altın Fiyatlarını Etkileyen Temel Unsurlar
III. 2025-2030 Dönemi ID Fiyat Tahmini
IV. ID için Profesyonel Yatırım Stratejileri ve Risk Yönetimi
V. ID için Potansiyel Riskler ve Zorluklar
VI. Sonuç ve Eylem Önerileri
Sıkça Sorulan Sorular
How to Buy Cryptocurrency


Trending Cryptocurrencies


Yatırım Yapmak için En Çok Hangi Sebep Sizinle Yankı Buluyor ve Neden?

Kripto'da Boğa ve Ayı Piyasaları: Web3 Yatırımcıları için Piyasa Döngülerini Anlamak

Bir Ajan veya Broker Hangi Faaliyetleri Yapmasına İzin Verilir? Açıklamalı

2025 FORT Fiyat Öngörüsü: Halving Sonrası Kripto Ekosisteminde Piyasa Trendleri ve Büyüme Potansiyelinin Değerlendirilmesi

2025 ATS Fiyat Tahmini: Otomatik Alım Satım Sistemi Token'ının Piyasa Eğilimleri ve Gelecekteki Değerlemesinin Analizi
2025 ASR Fiyat Tahmini: Otomatik Konuşma Tanıma Sektöründe Piyasa Trendleri, Teknolojik İlerlemeler ve Yatırım Olanaklarının Analizi

Magic Eden’i Keşfetmek: NFT Pazaryeri Genel Görünümü ve Kullanım İpuçları
Web3 işlemlerinde güvenli dijital cüzdan

Grass Airdrop'u Hakkında Eksiksiz Kılavuz: Ödül Almanın Adımları

Web3 Token Değerlemesi: Tam Kapsamlı Rehber
BGSC nedir: Kan Gazı ve Serum Kimyası Analizine Kapsamlı Bir Rehber