Trade
Basic
Futures
Futures
Hundreds of contracts settled in USDT or BTC
TradFi
Gold
Trade global traditional assets with USDT in one place
Options
Hot
Trade European-style vanilla options
Unified Account
Maximize your capital efficiency
Demo Trading
Futures Kickoff
Get prepared for your futures trading
Futures Events
Participate in events to win generous rewards
Demo Trading
Use virtual funds to experience risk-free trading
Earn
Launch
CandyDrop
Collect candies to earn airdrops
Launchpool
Quick staking, earn potential new tokens
HODLer Airdrop
Hold GT and get massive airdrops for free
Launchpad
Be early to the next big token project
Alpha Points
Trade on-chain assets and enjoy airdrop rewards!
Futures Points
Earn futures points and claim airdrop rewards
Investment
Simple Earn
Earn interests with idle tokens
Auto-Invest
Auto-invest on a regular basis
Dual Investment
Buy low and sell high to take profits from price fluctuations
Soft Staking
Earn rewards with flexible staking
Crypto Loan
0 Fees
Pledge one crypto to borrow another
Lending Center
One-stop lending hub
VIP Wealth Hub
Customized wealth management empowers your assets growth
Private Wealth Management
Customized asset management to grow your digital assets
Quant Fund
Top asset management team helps you profit without hassle
Staking
Stake cryptos to earn in PoS products
Smart Leverage
New
No forced liquidation before maturity, worry-free leveraged gains
GUSD Minting
Use USDT/USDC to mint GUSD for treasury-level yields
More
Raisa3433
Bitcoin returns to 70`000
275
- Reward
- like
- Comment
- Repost
- Share
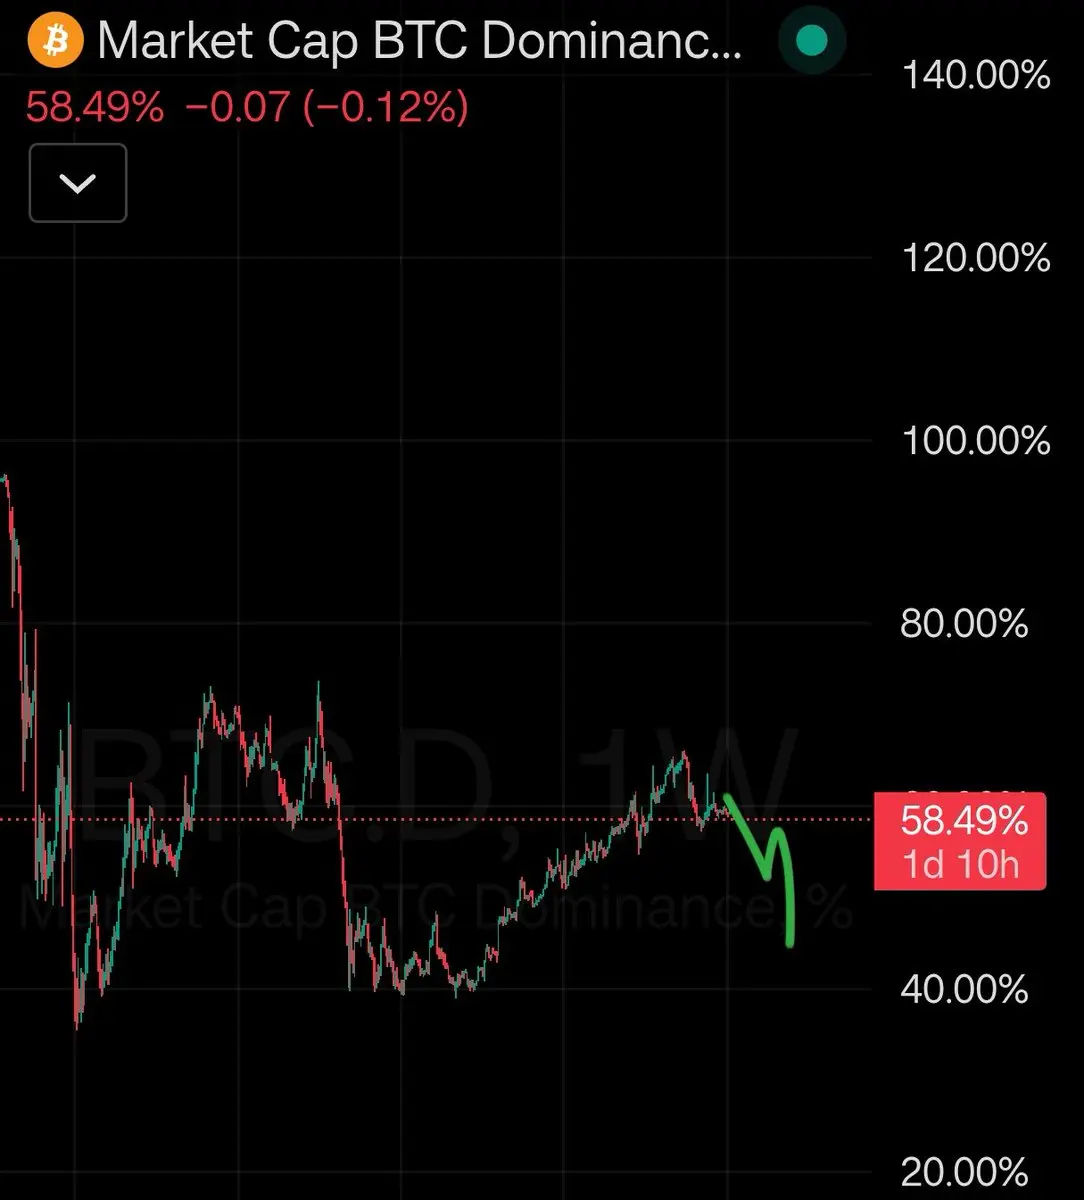
$BTC Dominance at ~58.5%
Bitcoin dominance is stalling near a key resistance.
Momentum is weakening, and a breakdown from this zone could signal capital rotation into alts.
If dominance continues lower → altcoins get room to run.
If it reclaims this level → BTC stays in control.
Market is at a decision point. 👀
Bitcoin dominance is stalling near a key resistance.
Momentum is weakening, and a breakdown from this zone could signal capital rotation into alts.
If dominance continues lower → altcoins get room to run.
If it reclaims this level → BTC stays in control.
Market is at a decision point. 👀
BTC-2.4%
- Reward
- 2
- Comment
- Repost
- Share
#USIsraelStrikesIranBTCPlunges Looking at MYX/USDT, I can provide a comprehensive analysis based on the candlestick pattern.
OHLC Analysis
Based on the market data:
· Current Price: ~$0.4095
· 24h High: $0.4362
· 24h Low: $0.3721
· 24h Change: +2.45% to +3.38%
Last Candle Profile (1H Chart)
The 1-hour timeframe shows:
· BOLL(20,2) Values:
· Upper Band: 0.4350
· Middle Band: 0.4102
· Lower Band: 0.3854
· SAR: 0.3760 (below price, indicating potential uptrend)
(5 M Chart):
· BOLL(20,2) Values:
· Upper Band: 0.4182
· Middle Band: 0.4139
· Lower Band: 0.4095
· SAR: 0.4202 (above price,
MYX0.22%

- Reward
- 3
- Comment
- Repost
- Share
F
飞驰人生
Created By@DonaldLiuTao
Subscription Progress
0.00%
MC:
$0
More Tokens
Major Update!
Gate has fully upgraded its Options VIP fee structure, covering all options products and delivering meaningful fee reductions from beginners to professionals.
VIP0 users can enjoy lower trading fees with no asset or volume requirements, giving new traders a clear cost advantage from day one;
At the growth stage, traders can unlock lower fees with assets in the tens of thousands USD or monthly volume in the millions, far below the hundreds-of-millions volume or high-asset thresholds required by major platforms;
For professional and institutional traders, VIP10+ offers 0% Maker and

- Reward
- 2
- 2
- Repost
- Share
Discovery :
:
To The Moon 🌕View More
What was discussed in the live room: the big bullish candle directly reached around 1890. Long positions are profitable, and a small position is being held to wait for a big gain🉐
View Original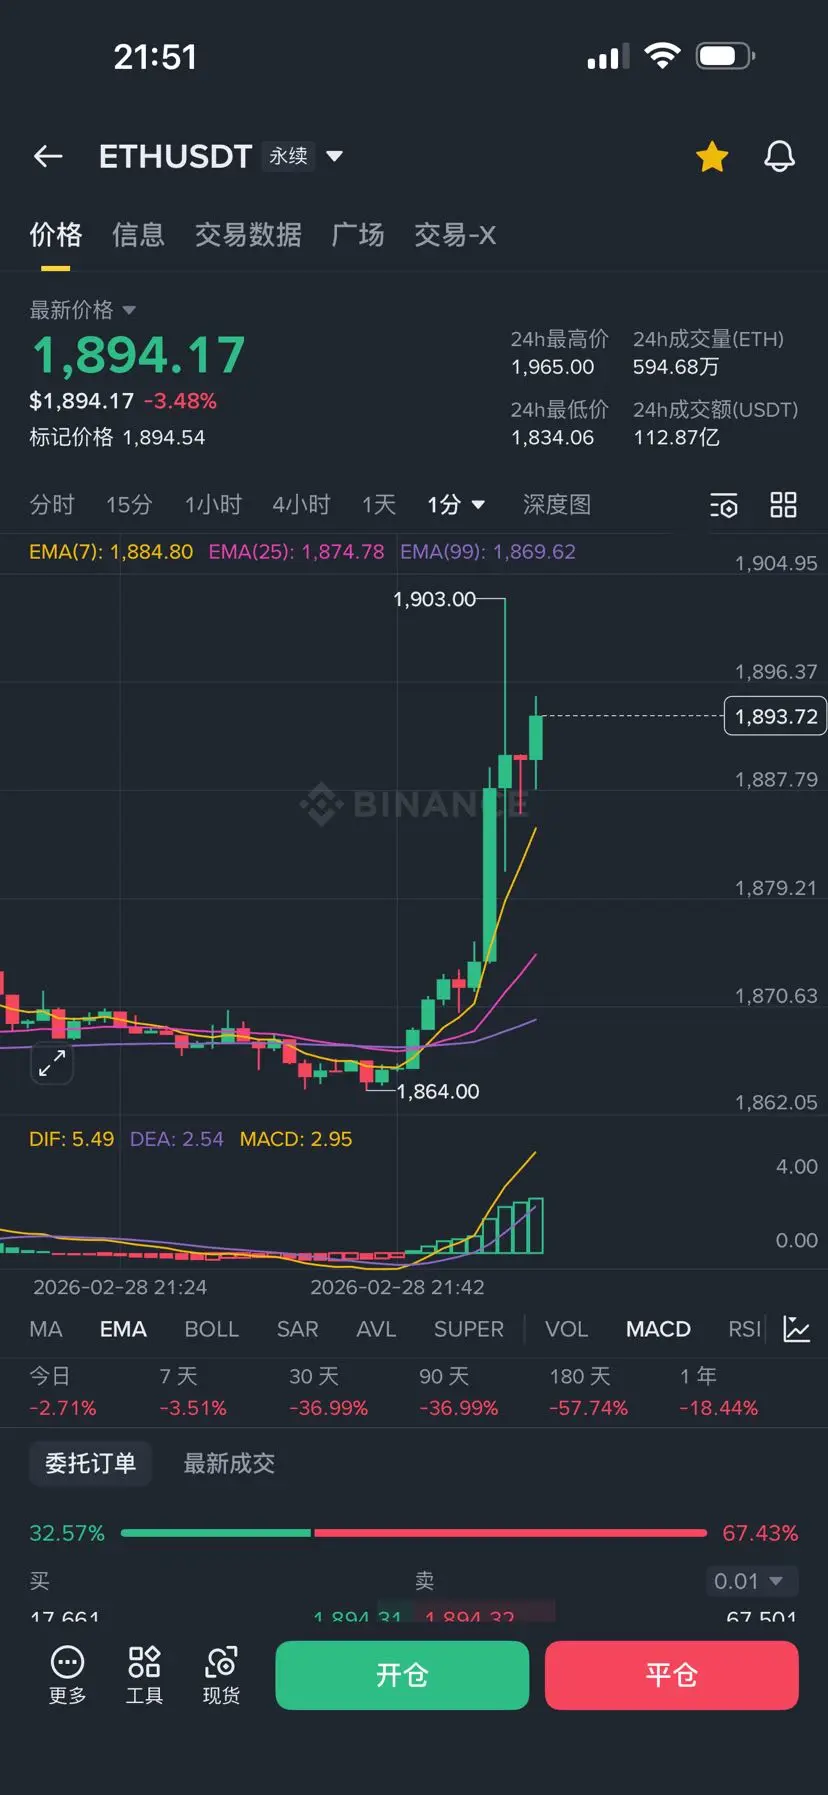
[The user has shared his/her trading data. Go to the App to view more.]
- Reward
- like
- Comment
- Repost
- Share
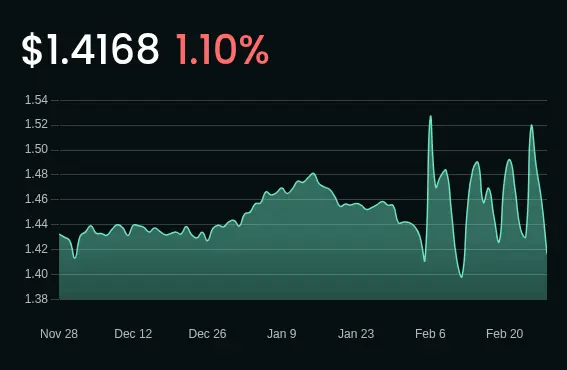
Kira's portfolio update: Over the past 3 months, we've seen a slight dip at -1.10%, yet our annualized performance shines at +10.35%. 📈 Excited to keep hunting for alpha! #Crypto #Trading #Portfolio
Ready to start your journey?
Ready to start your journey?
- Reward
- 2
- Comment
- Repost
- Share
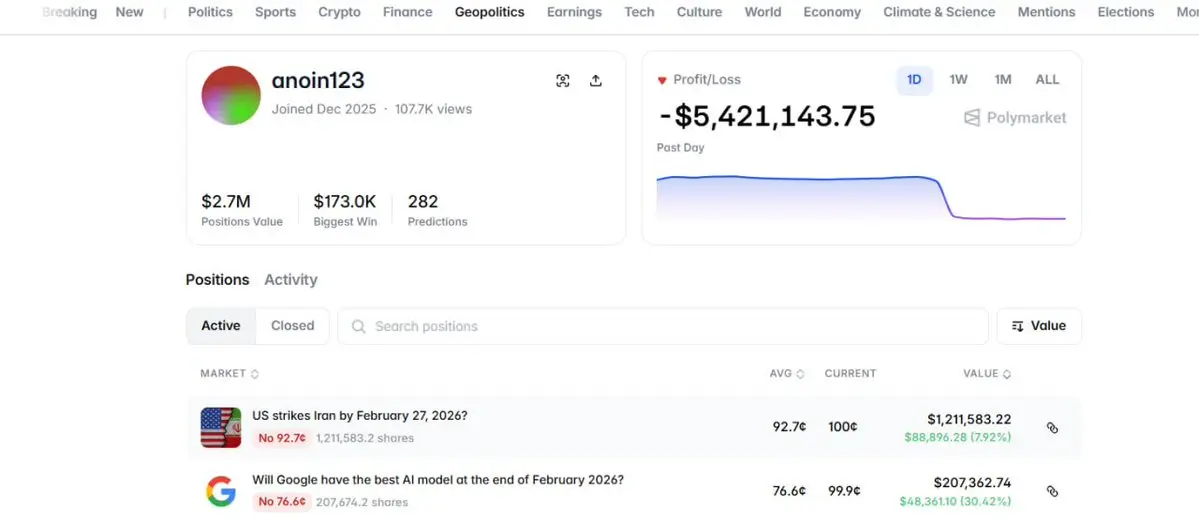
Lost $5.4M in just 24 hours
this guy anoin123 was betting against the US ran strike on Polymarket
putting millions on "No"
but the market just hit 99% probability for Feb 28 and his whole account just got nuked
but no doubt he will recover all of this
this guy anoin123 was betting against the US ran strike on Polymarket
putting millions on "No"
but the market just hit 99% probability for Feb 28 and his whole account just got nuked
but no doubt he will recover all of this
- Reward
- 1
- Comment
- Repost
- Share
🇮🇷Iranian Foreign Minister says, “We are interested in de-escalation.”


- Reward
- 2
- Comment
- Repost
- Share
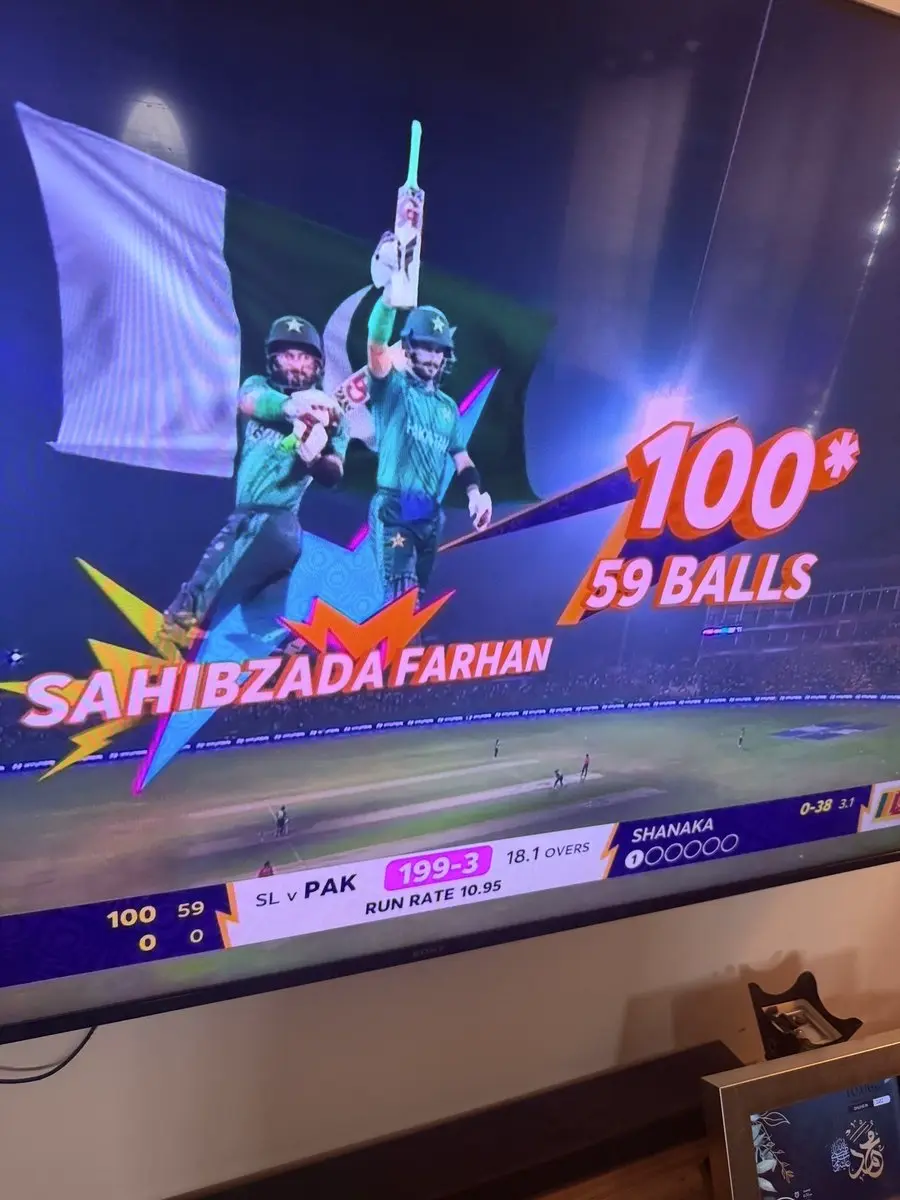
An honest batsman showing his true class for the first time in the Worldcup and breaking all the records
What a man our beloved Sahibzada Farhan is.
#PAKvsSL
What a man our beloved Sahibzada Farhan is.
#PAKvsSL
- Reward
- 1
- Comment
- Repost
- Share
#深度创作营 2026 Cryptocurrency Market: Finding Certainty Opportunities in the Cycle Repetition
Since the beginning of 2026, the crypto market has experienced a strong recovery driven by the dual forces of halving expectations and institutional capital inflows. As a trader who has gone through bull and bear cycles, I prefer to base my analysis on historical patterns and underlying logic rather than short-term emotions. This article will review the current market from three perspectives and project the main investment themes for the future.
1. Cycle Perspective: Market Rhythm Under the Halving Narra
View OriginalSince the beginning of 2026, the crypto market has experienced a strong recovery driven by the dual forces of halving expectations and institutional capital inflows. As a trader who has gone through bull and bear cycles, I prefer to base my analysis on historical patterns and underlying logic rather than short-term emotions. This article will review the current market from three perspectives and project the main investment themes for the future.
1. Cycle Perspective: Market Rhythm Under the Halving Narra


- Reward
- 3
- 5
- Repost
- Share
Twinkle,Twinkle,LittleStar:
Volatility is an opportunity 📊View More
BTC ETH XRP Market Analysis
369
- Reward
- like
- Comment
- Repost
- Share
remember this war in Iran is just a distraction from the real culprits @frankdegods @notthreadguy
- Reward
- 1
- Comment
- Repost
- Share
馬币火
Malaysian Ringgit
Created By@CryptoKing2026
Listing Progress
100.00%
MC:
$4.92K
More Tokens
I plan to go on a two-week vacation as soon as I close all my trades. Those who copy manually will see that I have stopped opening trades.
I also attached the actual statistics of manual copying.
View OriginalI also attached the actual statistics of manual copying.
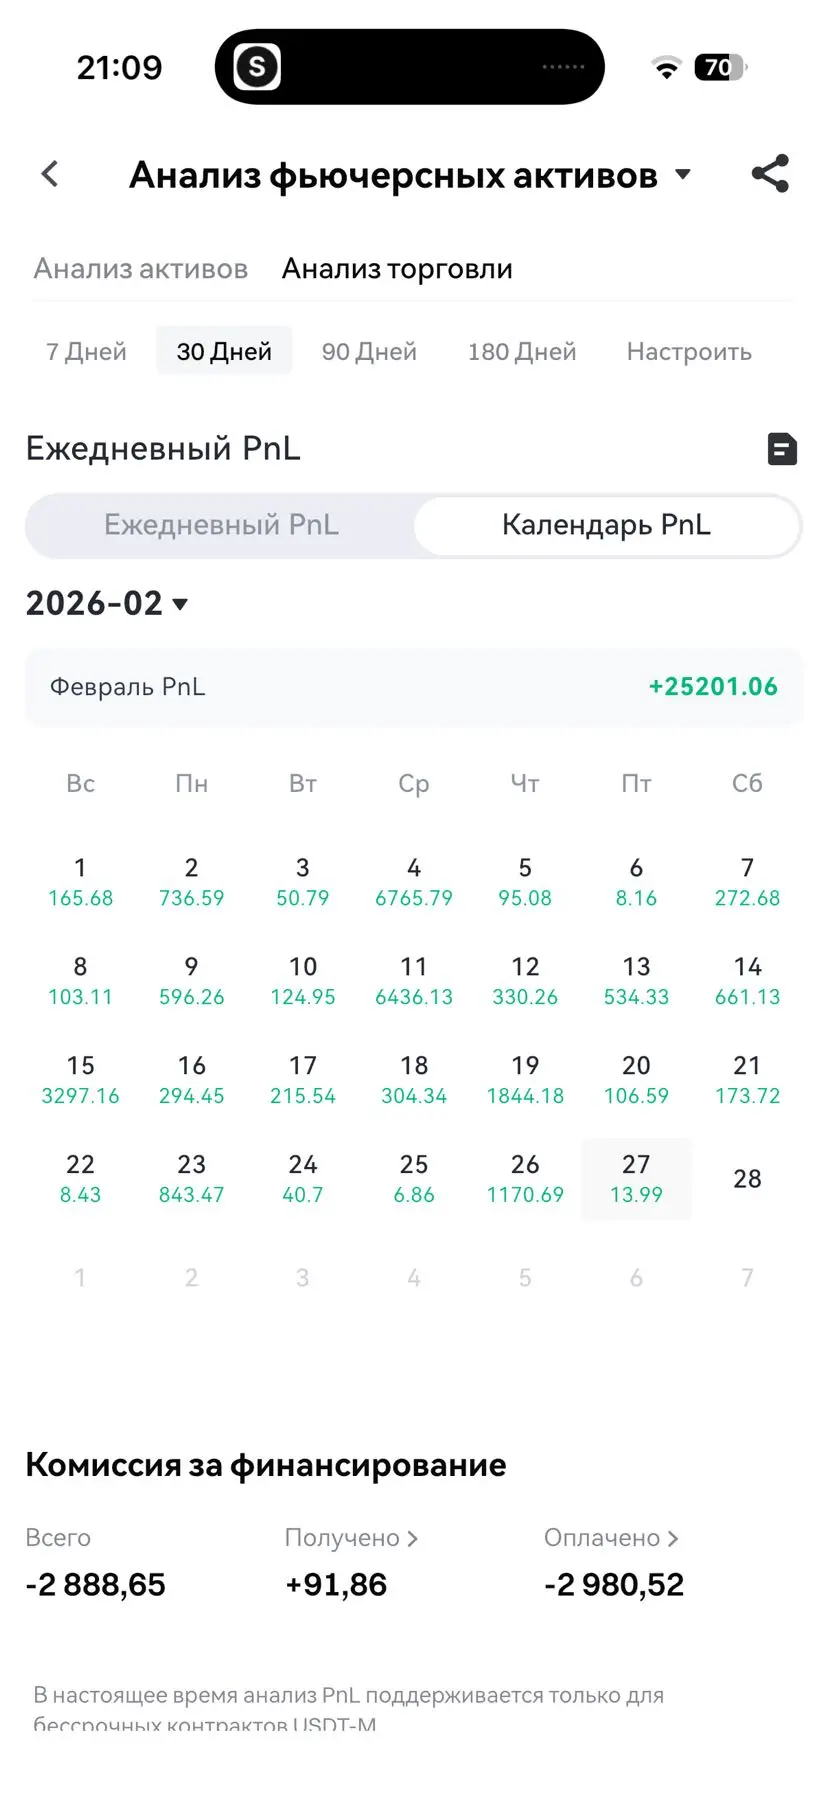
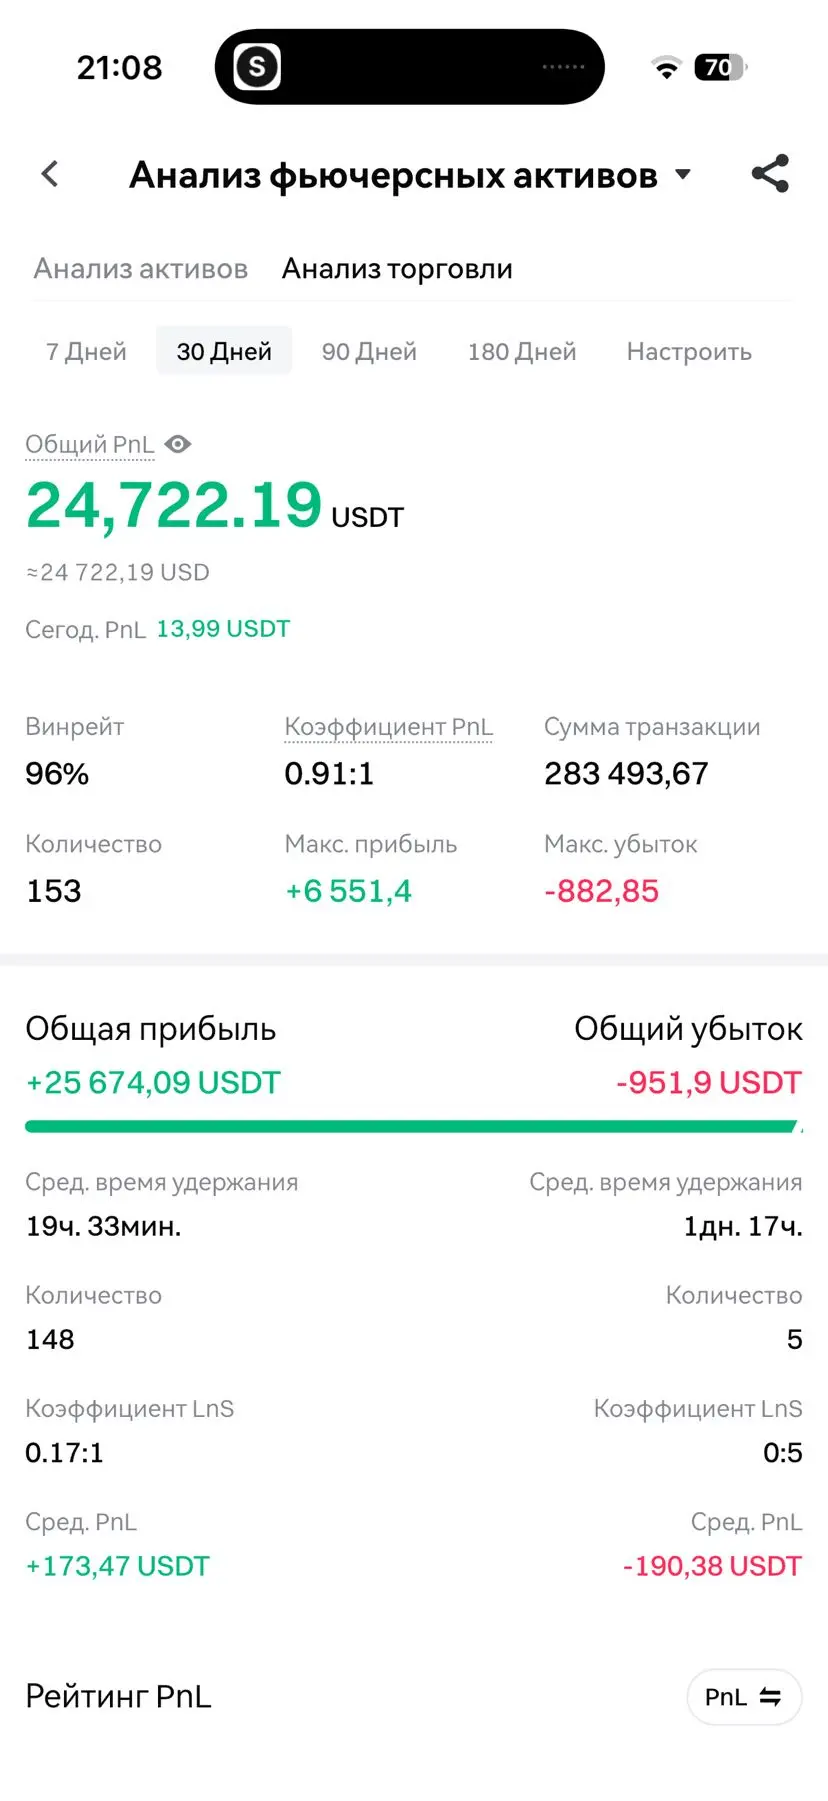
[The user has shared his/her trading data. Go to the App to view more.]
- Reward
- 1
- Comment
- Repost
- Share
A plane ticket costing 2.1 million is definitely a matter of life and death!
After enjoying comfort for so long, I gradually almost forgot how safe the land I am on truly is🤣
View OriginalAfter enjoying comfort for so long, I gradually almost forgot how safe the land I am on truly is🤣

- Reward
- 1
- Comment
- Repost
- Share
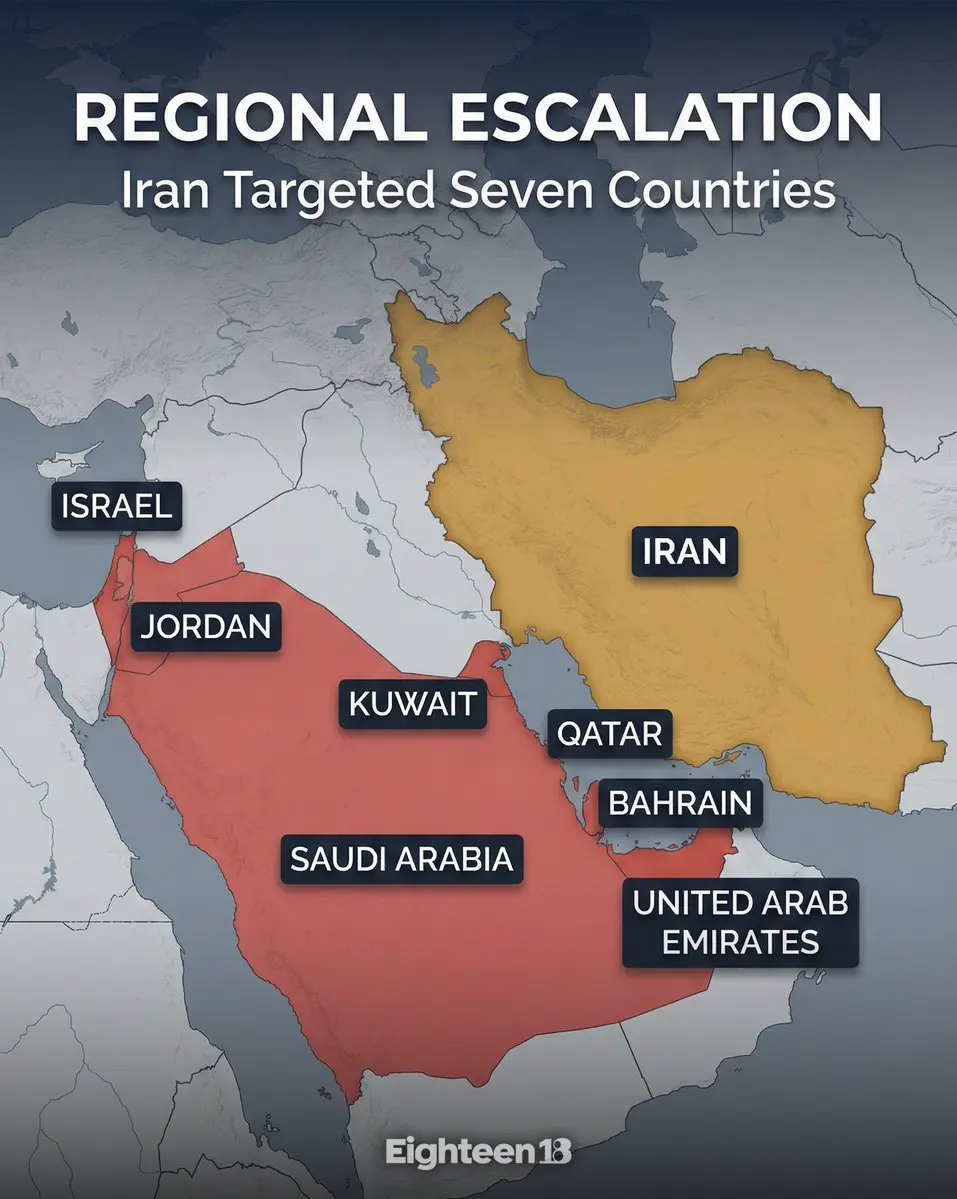
Will the US, Israel, and Iran's three-way conflict evolve into a full-scale Middle East war? What impact does this have on Bitcoin's decline and the bear market?
According to reports, Iran has launched attacks against seven Middle Eastern countries, including Israel, Jordan, Qatar, Bahrain, the UAE, Saudi Arabia, and Kuwait.
If regional conflicts escalate further, it could develop into a full-scale Middle East war. The situation is very dire, with many investment banks predicting that gold prices will break through $6,000 per ounce during this war. So, is it a good time to buy gold on dips
BTC-2.4%
- Reward
- like
- Comment
- Repost
- Share
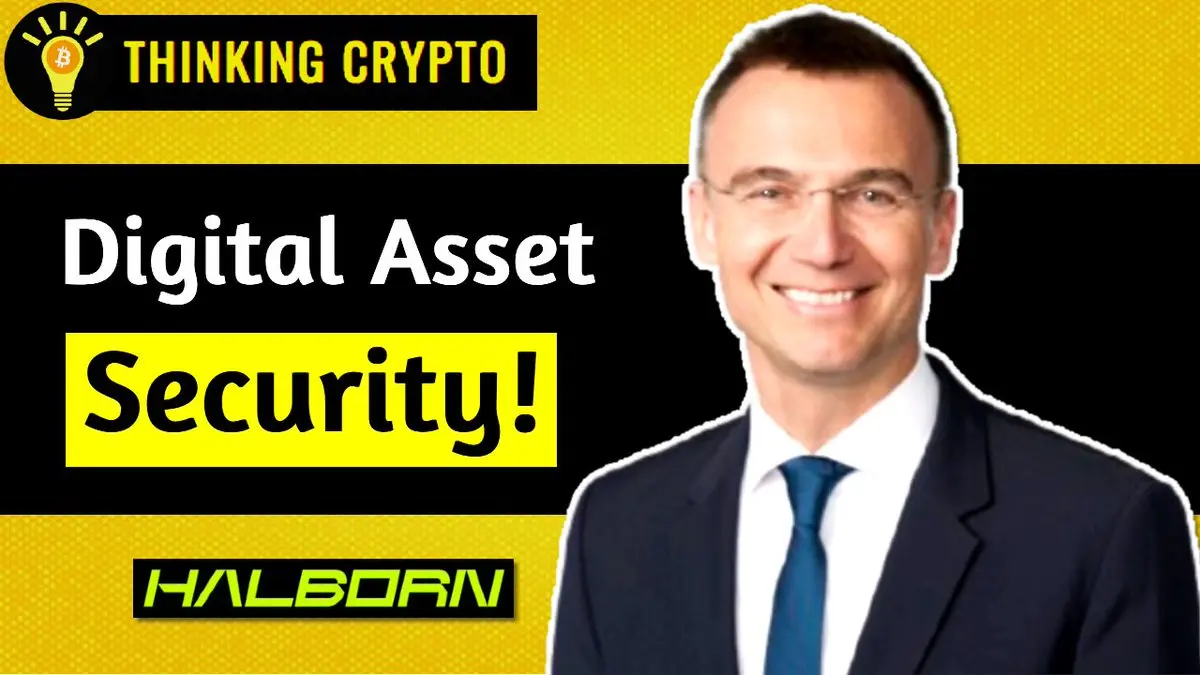
Securing Tokenized Assets & Crypto For Massive Institutions!
WATCH ▶️
Jacques Boschung, CEO of Halborn, sat down with me for an interview at the Halborn Access 2026 Summit at the NYSE. We discussed how Halborn is helping institutions to protect their crypto assets.
#crypto #tokenization #security
WATCH ▶️
Jacques Boschung, CEO of Halborn, sat down with me for an interview at the Halborn Access 2026 Summit at the NYSE. We discussed how Halborn is helping institutions to protect their crypto assets.
#crypto #tokenization #security
- Reward
- 1
- Comment
- Repost
- Share
#DeepCreationCamp
Hey everyone, jumping in here because the crypto space is absolutely intense right now—late February 2026 feels like one of those rollercoaster weeks where everything happens at once. Geopolitics just impacted the market hard, and while it's challenging watching the charts decline, these moments are exactly when the real patterns show up and opportunities start hiding in plain sight.
So, the big trigger this weekend: Recent developments in the Middle East caused a significant shift, and boom—risk-off mode kicked in full force. Bitcoin faced pressure, sliding below $64,000 pr
- Reward
- 8
- 6
- Repost
- Share
ShizukaKazu:
2026 Go Go Go 👊View More
Bitcoin season ? No.
Altcoin season ? No.
Survive season ? Yes.
Don't get liquidated, save your liquidity.
Everything will sound right.
Do u understand?
Altcoin season ? No.
Survive season ? Yes.
Don't get liquidated, save your liquidity.
Everything will sound right.
Do u understand?
BTC-2.4%

- Reward
- 2
- 1
- Repost
- Share
monowar2782:
I'm always talking about this conceptLoad More
Join 40M users in our growing community
⚡️ Join 40M users in the crypto craze discussion
💬 Engage with your favorite top creators
👍 See what interests you
Trending Topics
View More42.47M Popularity
151.27K Popularity
99.15K Popularity
1.66M Popularity
496.42K Popularity
Hot Gate Fun
View More- MC:$2.34KHolders:20.00%
- MC:$2.29KHolders:10.00%
- MC:$0.1Holders:10.00%
- MC:$2.34KHolders:20.14%
- MC:$2.33KHolders:20.07%
News
View MoreA certain whale sold 500 PAXG in the past 6 hours, with an estimated profit of $217,000.
27 m
A loud explosion occurred in Dubai, with thick smoke and flames appearing above the Palm Jumeirah community.
29 m
Iranian Foreign Minister: Iran does not have the capability to strike the U.S. mainland and will not develop missiles capable of targeting the United States.
1 h
Newly Created Wallet Opens Leveraged Long Positions on SILVER and GOLD Tokens
1 h
Data shows: You need to hold Bitcoin for at least three years to avoid losses
1 h
Pin