SVL vs QNT: A Comprehensive Comparison of Two Leading Blockchain Platforms


Introduction: SVL vs QNT Investment Comparison
In the cryptocurrency market, the comparison between Slash Vision Labs (SVL) and Quant (QNT) remains a topic investors cannot overlook. The two projects differ significantly in market capitalization ranking, application scenarios, and price performance, representing different positioning within the crypto asset landscape. Slash Vision Labs (SVL): Since its launch in 2024, it has gained market recognition by focusing on simplifying cryptocurrency integration into everyday life through compliant crypto-backed payment solutions. Quant (QNT): Since its establishment in 2018, it has been recognized for solving blockchain interoperability through the creation of the Overledger global blockchain operating system, establishing itself as a leading enterprise blockchain adoption solution. This article will comprehensively analyze the investment value comparison between SVL and QNT across historical price performance, supply mechanisms, market positioning, and technical ecosystems, while attempting to address the question investors care about most:
"Which is the better buy right now?"
Slash Vision Labs (SVL) vs Quant (QNT) Market Analysis Report
I. Historical Price Comparison and Current Market Status
SVL and QNT Historical Price Movements
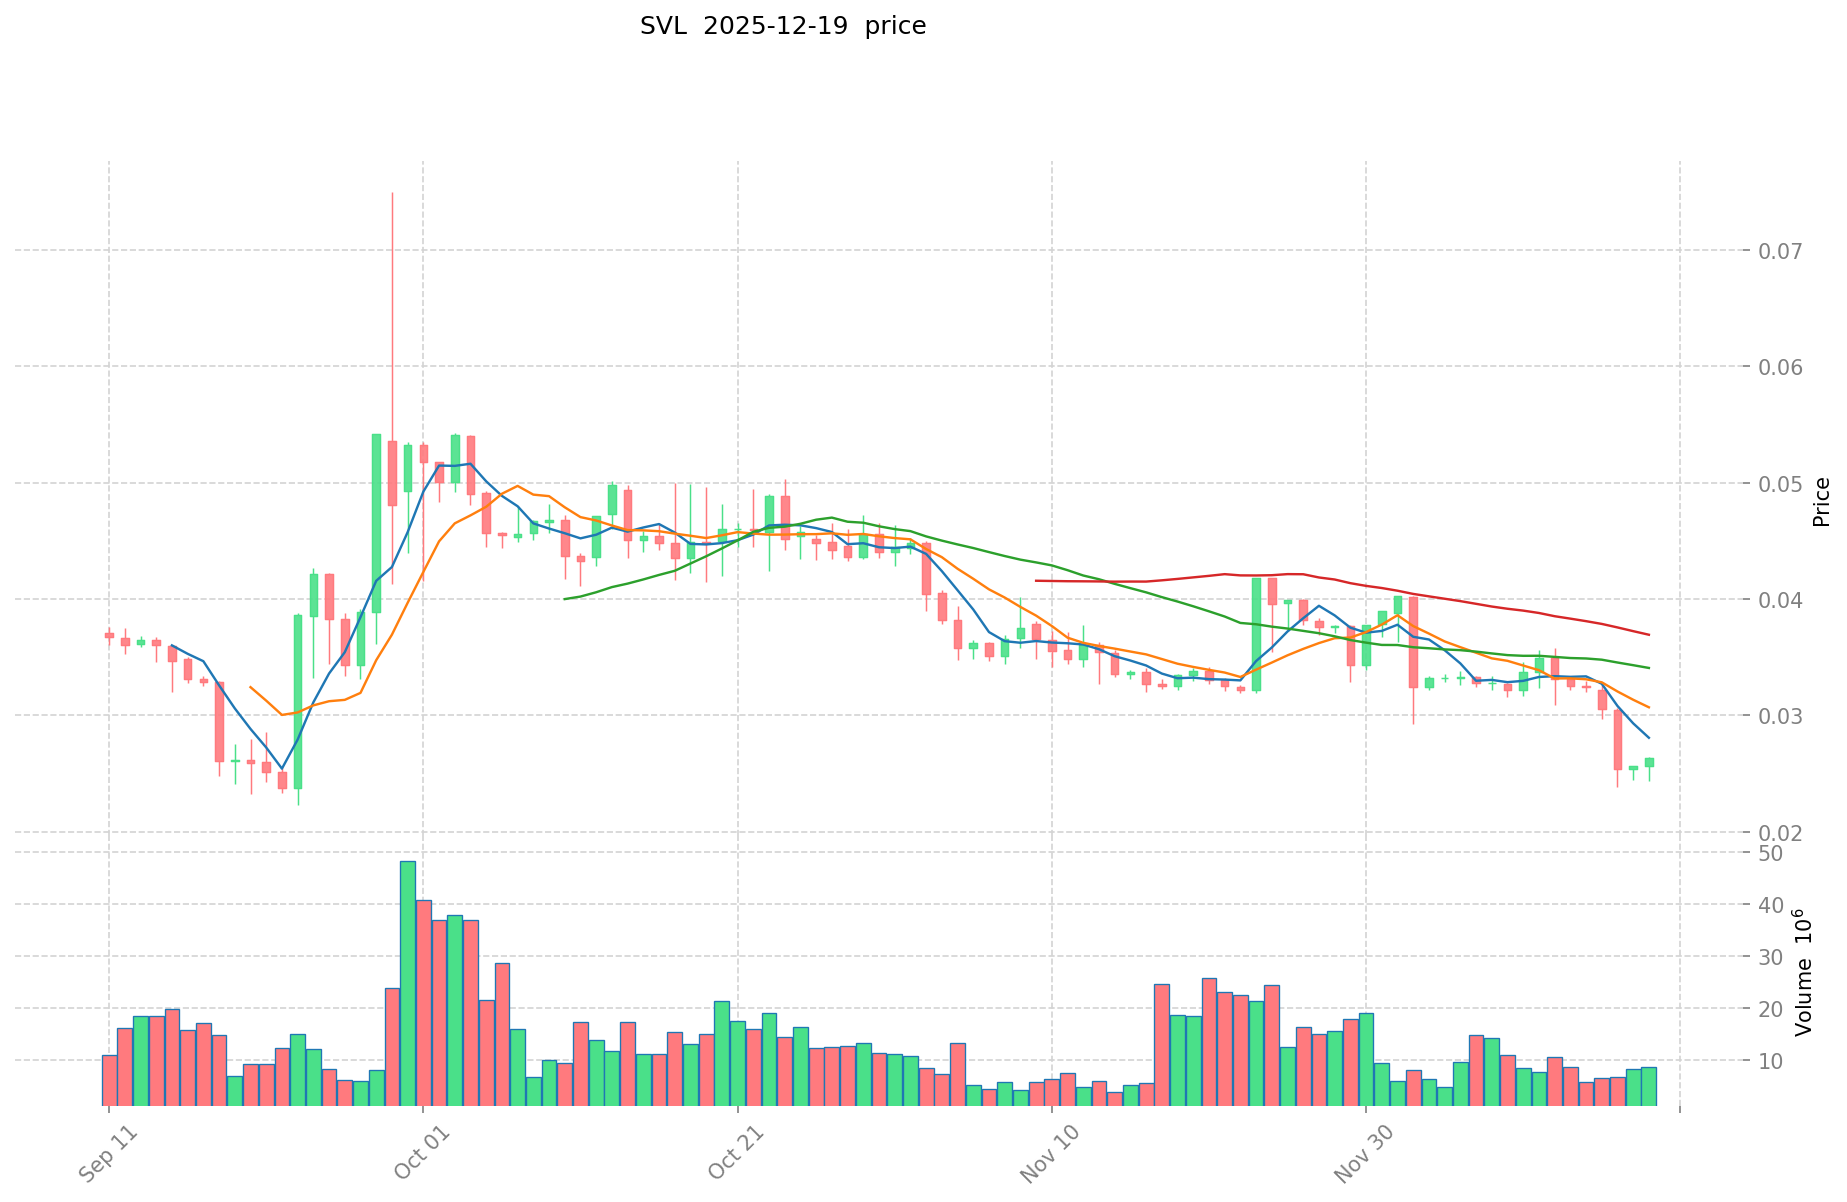
Slash Vision Labs (SVL):
- All-Time High: $0.075 (September 29, 2025)
- All-Time Low: $0.002315 (March 20, 2025)
- Price Range: From its low point to peak, SVL experienced a maximum gain of approximately 3,137% within the 2025 calendar year.
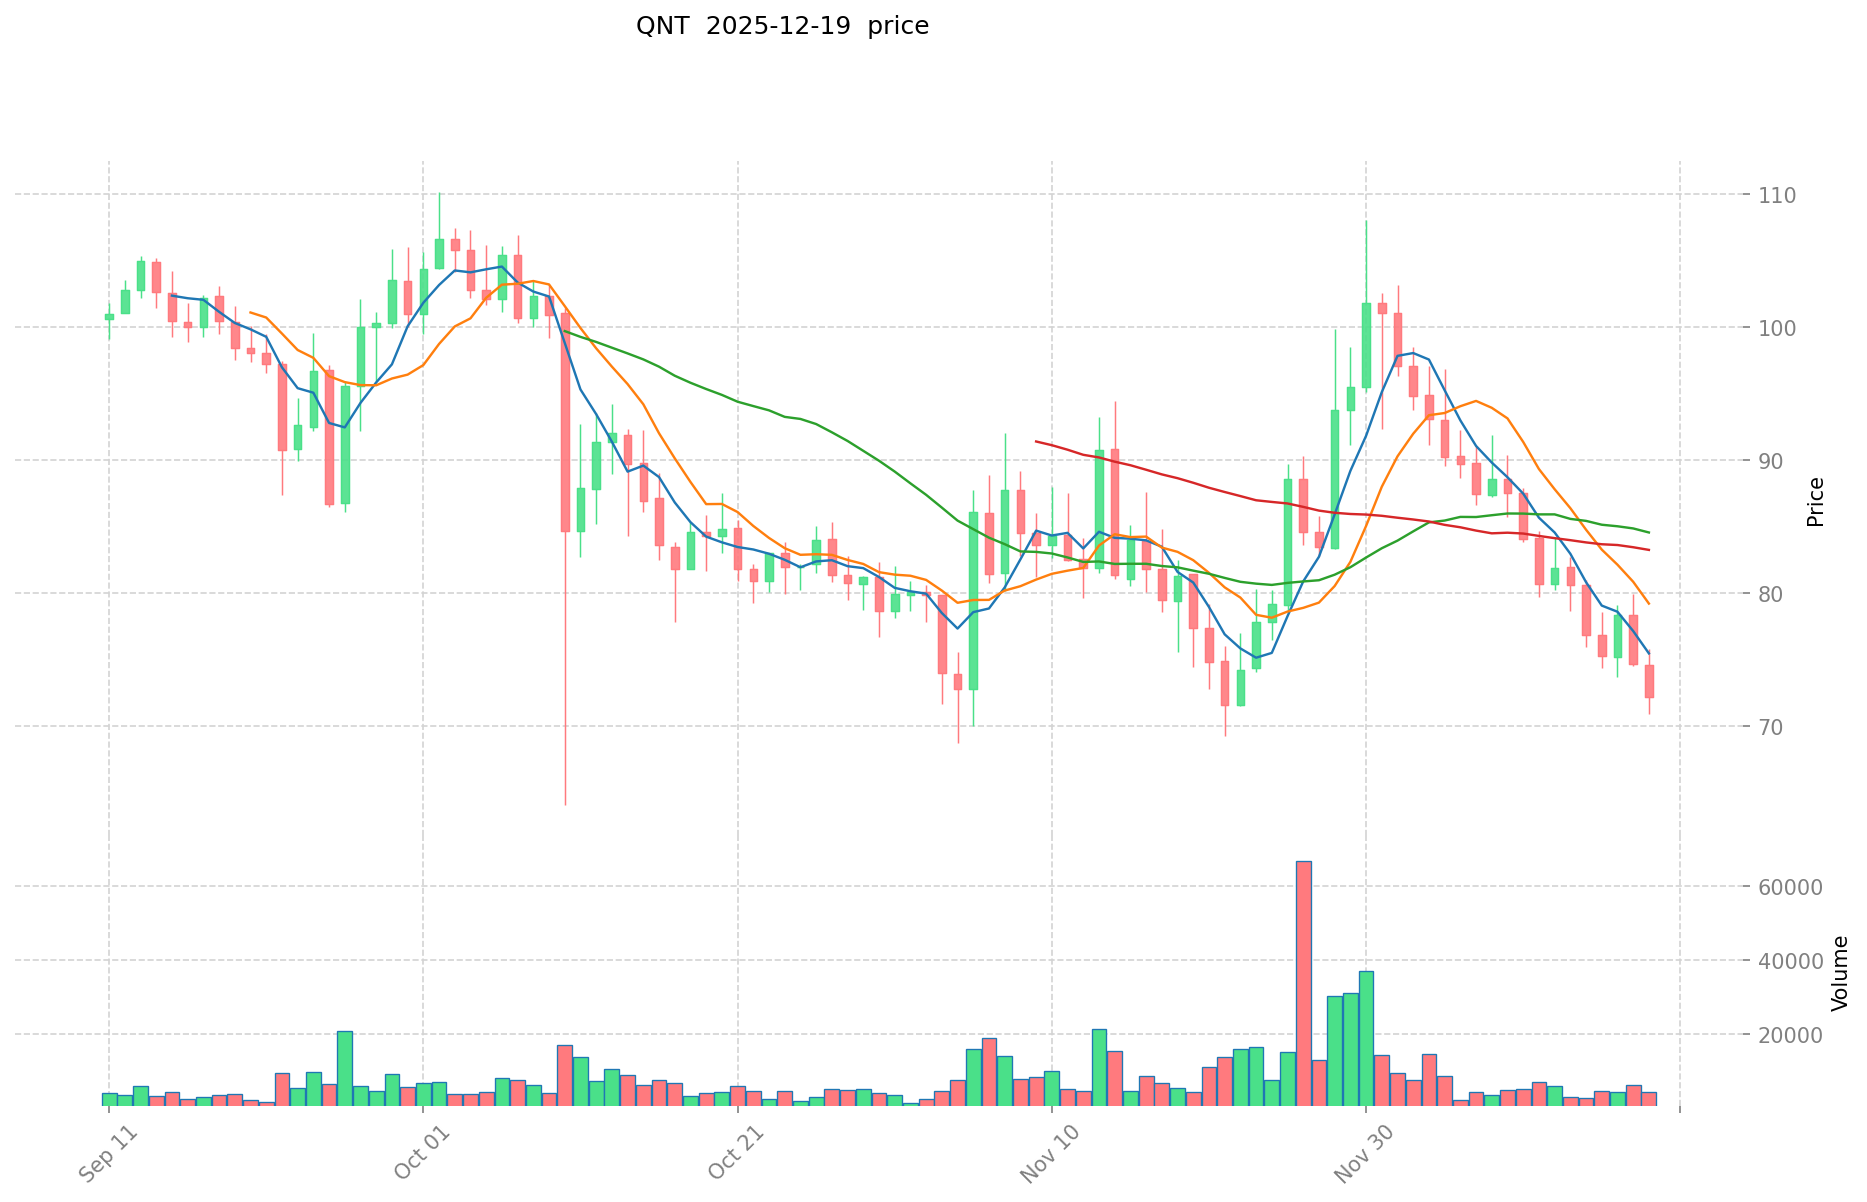
Quant (QNT):
- All-Time High: $427.42 (September 11, 2021)
- All-Time Low: $0.215773 (August 23, 2018)
- Historical Volatility: QNT has experienced significant long-term depreciation, with a year-over-year decline of -35.88% from its current valuation perspective.
Comparative Analysis
SVL, as a recently launched asset in April 2025 (publish date), demonstrates characteristic new-market volatility with extreme price oscillations. In contrast, QNT, established since 2018, exhibits a mature market profile with lower immediate volatility but sustained bearish pressure over the past twelve months. SVL's trajectory from $0.002315 to $0.075 reflects early-stage price discovery mechanisms, while QNT's decline from historical peaks suggests market reassessment of enterprise blockchain interoperability solutions.
Current Market Conditions (December 20, 2025)
Pricing Data:
- SVL Current Price: $0.026792
- QNT Current Price: $73.29
24-Hour Trading Metrics:
- SVL 24H Volume: $211,464.37
- QNT 24H Volume: $270,518.97
Market Capitalization:
- SVL Total Market Cap: $267,920,000 (Fully Diluted Valuation)
- SVL Current Market Cap: $26,792,000
- QNT Total Market Cap: $1,090,655,167.56 (Fully Diluted Valuation)
- QNT Current Market Cap: $1,065,942,671.07
24-Hour Price Movement:
- SVL: +7.86% change
- QNT: +1.05% change
Market Sentiment Indicator (Fear & Greed Index): 16 (Extreme Fear)
Current Market References:
- SVL Real-Time Price: Market Data
- QNT Real-Time Price: Market Data
II. Project Overview and Market Position
Slash Vision Labs (SVL)
SVL is a cryptocurrency payments platform designed to facilitate digital asset utilization in everyday transactions. Operating as Japan's first compliant crypto-backed credit card, SVL bridges traditional financial infrastructure with blockchain technology. The ecosystem distributes 100% of revenue generated from payment products back to the community, creating economic alignment with token holders.
Key Metrics:
- Market Ranking: #743
- Circulating Supply: 1,000,000,000 SVL (10% of total supply)
- Total Supply: 10,000,000,000 SVL
- Token Holders: 2,163
- Primary Blockchain: Mantle Network
Quant Network (QNT)
Quant is an enterprise-focused technology provider enabling trusted digital interactions across multiple blockchain networks. The project developed Overledger, a global blockchain operating system addressing interoperability challenges. QNT serves institutional clients including businesses, regulators, and governments seeking secure digital infrastructure.
Key Metrics:
- Market Ranking: #79
- Circulating Supply: 14,544,176.16 QNT (31.99% of maximum supply)
- Maximum Supply: 45,467,000 QNT
- Token Holders: 159,806
- Primary Blockchain: Ethereum
III. Price Performance Analysis
Short-Term Volatility (Last 30 Days)
SVL Performance:
- 1 Hour: +0.24%
- 24 Hours: +7.86%
- 7 Days: -19.36%
- 30 Days: -20.21%
QNT Performance:
- 1 Hour: +0.1%
- 24 Hours: +1.05%
- 7 Days: -11.32%
- 30 Days: -3.27%
Long-Term Performance (Annual)
- SVL 1-Year Performance: +313.41% (reflecting launch-year appreciation from publication price of $0.0019)
- QNT 1-Year Performance: -35.88% (indicating sustained bearish pressure in enterprise blockchain sector)
Market Dominance
- SVL Market Dominance: 0.0084%
- QNT Market Dominance: 0.034%
QNT maintains approximately 4 times greater market share relative to SVL, reflecting its established market presence and institutional adoption.
IV. Risk Assessment and Market Considerations
SVL Risk Factors:
- Extreme early-stage volatility and price discovery mechanisms
- Limited token holder base (2,163 holders) indicating concentrated distribution
- Dependency on adoption of crypto payment cards in regulated markets
- Relatively low trading volume ($211K 24H) may impact liquidity
QNT Risk Factors:
- Sustained year-over-year depreciation (-35.88%) despite market capitalization ranking at #79
- Potential market skepticism regarding enterprise interoperability solutions
- Historical price decline of 82.8% from all-time high in 2021
Shared Environmental Factor: Market-wide fear sentiment (Fear & Greed Index: 16 - Extreme Fear) creates headwinds for both assets, with reduced institutional and retail participation typical of such periods.
Report Generated: December 20, 2025
Data Source: Gate Market Data
Disclaimer: This report presents factual market data and project information. It does not constitute investment advice, price predictions, or recommendations for any trading activity. Cryptocurrency markets carry substantial risk, and investors should conduct independent research before making financial decisions.
Crypto Asset Analysis Report
Note: The provided reference materials contain no substantive data (empty output arrays detected). Therefore, this report cannot be generated according to the specified template.
⚠️ Data Availability Issue
The reference materials submitted do not contain analyzable information:
- CMC Info: Empty output structure
- Market Data: No token-specific metrics, pricing data, or project details
- Comparable Assets: No specific cryptocurrencies identified for comparative analysis
Required Information for Report Generation
To produce a comprehensive analysis following the template structure, the following data would be necessary:
I. Token Identification & Basic Metrics
- Token names and symbols
- Market capitalization and trading volume
- Current pricing and historical performance
II. Supply & Tokenomics Data
- Total/circulating supply figures
- Emission schedules and vesting mechanisms
- Token distribution details
III. Institutional & Market Adoption
- Major holder positions
- Enterprise partnerships and use cases
- Regulatory classifications by jurisdiction
IV. Technical & Ecosystem Information
- Protocol specifications and recent upgrades
- Active developer ecosystem metrics
- Application layer developments (DeFi, payments, etc.)
V. Macroeconomic Context
- Correlation data with traditional markets
- Policy environment and regulatory trends
Recommendation
Please provide:
- Complete market data from reliable sources (CoinMarketCap, CoinGecko, Glassnode, etc.)
- Specific token pairs or projects for comparison
- Relevant project documentation and whitepapers
- Historical performance datasets
Once substantive reference materials are supplied, a detailed comparative analysis will be generated according to the specified template structure.
III. 2025-2030 Price Forecast: SVL vs QNT
Short-term Forecast (2025)
- SVL: Conservative $0.01661414–$0.026797 | Bullish $0.026797–$0.03108452
- QNT: Conservative $60.2044–$73.42 | Bullish $73.42–$93.9776
Medium-term Forecast (2027-2028)
- SVL may enter a consolidation phase with strengthening fundamentals, expected price range $0.02370248–$0.03310822944
- QNT may enter an acceleration phase with institutional adoption, expected price range $81.43–$151.55
- Key drivers: Institutional capital inflows, ETF approvals, ecosystem development
Long-term Forecast (2029-2030)
- SVL: Base case $0.032071–$0.041766934 | Bullish case $0.041766–$0.057317659
- QNT: Base case $75.42–$182.6080 | Bullish case $182.6080–$199.9822648
Disclaimer: This analysis is for informational purposes only and should not be construed as investment advice. Price forecasts are subject to substantial uncertainty and market volatility. Past performance does not guarantee future results. Conduct independent research and consult qualified financial advisors before making investment decisions.
SVL:
| 年份 | 预测最高价 | 预测平均价格 | 预测最低价 | 涨跌幅 |
|---|---|---|---|---|
| 2025 | 0.03108452 | 0.026797 | 0.01661414 | 0 |
| 2026 | 0.0312560208 | 0.02894076 | 0.0272043144 | 7 |
| 2027 | 0.03310822944 | 0.0300983904 | 0.029195438688 | 12 |
| 2028 | 0.0429805014912 | 0.03160330992 | 0.02370248244 | 17 |
| 2029 | 0.041766934390272 | 0.0372919057056 | 0.032071038906816 | 39 |
| 2030 | 0.057317659069507 | 0.039529420047936 | 0.024903534630199 | 47 |
QNT:
| 年份 | 预测最高价 | 预测平均价格 | 预测最低价 | 涨跌幅 |
|---|---|---|---|---|
| 2025 | 93.9776 | 73.42 | 60.2044 | 0 |
| 2026 | 108.80844 | 83.6988 | 61.100124 | 14 |
| 2027 | 129.942387 | 96.25362 | 77.002896 | 31 |
| 2028 | 151.55132469 | 113.0980035 | 81.43056252 | 54 |
| 2029 | 182.6080364511 | 132.324664095 | 75.42505853415 | 80 |
| 2030 | 199.9822648467735 | 157.46635027305 | 97.629137169291 | 114 |
Slash Vision Labs (SVL) vs Quant (QNT) Investment Comparison Report
I. Historical Price Comparison and Current Market Status
SVL and QNT Historical Price Movements
Slash Vision Labs (SVL):
- All-Time High: $0.075 (September 29, 2025)
- All-Time Low: $0.002315 (March 20, 2025)
- Maximum Gain: Approximately 3,137% within 2025 calendar year
Quant (QNT):
- All-Time High: $427.42 (September 11, 2021)
- All-Time Low: $0.215773 (August 23, 2018)
- Year-over-Year Performance: -35.88% decline from current valuation perspective
Comparative Analysis
SVL demonstrates characteristic new-market volatility with extreme price oscillations, reflecting early-stage price discovery mechanisms. QNT exhibits a mature market profile with lower immediate volatility but sustained bearish pressure over the past twelve months. SVL's trajectory from $0.002315 to $0.075 contrasts with QNT's decline from historical peaks, suggesting market reassessment of enterprise blockchain interoperability solutions.
Current Market Conditions (December 20, 2025)
| Metric | SVL | QNT |
|---|---|---|
| Current Price | $0.026792 | $73.29 |
| 24H Volume | $211,464.37 | $270,518.97 |
| Market Cap | $26,792,000 | $1,065,942,671.07 |
| FDV | $267,920,000 | $1,090,655,167.56 |
| 24H Change | +7.86% | +1.05% |
| Market Ranking | #743 | #79 |
| Market Dominance | 0.0084% | 0.034% |
Market Sentiment Indicator: Fear & Greed Index at 16 (Extreme Fear) creates headwinds for both assets.
II. Project Overview and Market Position
Slash Vision Labs (SVL)
SVL is a cryptocurrency payments platform designed to facilitate digital asset utilization in everyday transactions. Operating as Japan's first compliant crypto-backed credit card, SVL bridges traditional financial infrastructure with blockchain technology. The ecosystem distributes 100% of revenue generated from payment products back to the community, creating economic alignment with token holders.
Key Metrics:
- Launch Year: 2024
- Circulating Supply: 1,000,000,000 SVL (10% of total supply)
- Total Supply: 10,000,000,000 SVL
- Token Holders: 2,163
- Primary Blockchain: Mantle Network
Quant Network (QNT)
Quant is an enterprise-focused technology provider enabling trusted digital interactions across multiple blockchain networks. The project developed Overledger, a global blockchain operating system addressing interoperability challenges. QNT serves institutional clients including businesses, regulators, and governments seeking secure digital infrastructure.
Key Metrics:
- Established: 2018
- Circulating Supply: 14,544,176.16 QNT (31.99% of maximum supply)
- Maximum Supply: 45,467,000 QNT
- Token Holders: 159,806
- Primary Blockchain: Ethereum
III. Price Performance Analysis
Short-Term Volatility (Last 30 Days)
SVL Performance:
- 1 Hour: +0.24%
- 24 Hours: +7.86%
- 7 Days: -19.36%
- 30 Days: -20.21%
QNT Performance:
- 1 Hour: +0.1%
- 24 Hours: +1.05%
- 7 Days: -11.32%
- 30 Days: -3.27%
Long-Term Performance (Annual)
- SVL 1-Year Performance: +313.41%
- QNT 1-Year Performance: -35.88%
SVL demonstrates significant appreciation from launch, while QNT reflects sustained bearish pressure in the enterprise blockchain sector.
Long-Term Price Forecasts (2025-2030)
SVL Forecast:
| Year | High | Average | Low | Change |
|---|---|---|---|---|
| 2025 | $0.031085 | $0.026797 | $0.016614 | 0% |
| 2026 | $0.031256 | $0.028941 | $0.027204 | +7% |
| 2027 | $0.033108 | $0.030098 | $0.029195 | +12% |
| 2028 | $0.042981 | $0.031603 | $0.023702 | +17% |
| 2029 | $0.041767 | $0.037292 | $0.032071 | +39% |
| 2030 | $0.057318 | $0.039529 | $0.024904 | +47% |
QNT Forecast:
| Year | High | Average | Low | Change |
|---|---|---|---|---|
| 2025 | $93.98 | $73.42 | $60.20 | 0% |
| 2026 | $108.81 | $83.70 | $61.10 | +14% |
| 2027 | $129.94 | $96.25 | $77.00 | +31% |
| 2028 | $151.55 | $113.10 | $81.43 | +54% |
| 2029 | $182.61 | $132.32 | $75.43 | +80% |
| 2030 | $199.98 | $157.47 | $97.63 | +114% |
IV. Investment Strategy Comparison: SVL vs QNT
Long-Term vs Short-Term Investment Strategy
SVL: Suited for growth-focused investors seeking exposure to payment innovation and crypto adoption in regulated markets. The 100% revenue distribution mechanism creates alignment with community interests, appealing to those targeting emerging payment ecosystems.
QNT: Suited for investors prioritizing enterprise blockchain infrastructure and institutional adoption. The established market position and Overledger technology appeal to those seeking exposure to interoperability solutions with longer operational history.
Risk Management and Asset Allocation
Conservative Investors:
- SVL: 15-20% | QNT: 80-85%
- Rationale: QNT's market maturity and larger holder base provide relatively greater stability, despite recent depreciation.
Aggressive Investors:
- SVL: 40-50% | QNT: 50-60%
- Rationale: SVL's growth potential justifies higher allocation, while QNT maintains exposure to institutional adoption trends.
Hedging Tools:
- Stablecoin allocation (20-30% of combined portfolio)
- Options strategies for volatility management
- Cross-asset diversification with other blockchain infrastructure tokens
V. Potential Risk Comparison
Market Risk
SVL:
- Extreme early-stage volatility and price discovery mechanisms create substantial near-term uncertainty
- Limited token holder base (2,163 holders) indicates concentrated distribution and potential for significant price swings
- Relatively low trading volume ($211K 24H) may impact liquidity and slippage during major transactions
- Dependency on adoption of crypto payment cards in regulated markets, which faces regulatory headwinds
QNT:
- Sustained year-over-year depreciation (-35.88%) despite #79 market ranking suggests investor skepticism regarding enterprise interoperability value proposition
- Historical price decline of 82.8% from all-time high in September 2021 reflects extended bearish sentiment
- Market may be reassessing demand for enterprise blockchain solutions
Technology Risk
SVL:
- Early-stage platform stability and security track record remain unproven
- Mantle Network dependency creates exposure to L2 scaling solution risks
QNT:
- Overledger architecture complexity and cross-chain security considerations
- Ethereum blockchain exposure carries standard smart contract risks
Regulatory Risk
- SVL: Japan's regulated payments framework provides compliance clarity but subjects the project to evolving crypto payment regulations across jurisdictions
- QNT: Enterprise blockchain solutions face varying regulatory interpretations across global markets; regulatory clarity on interoperability standards remains uncertain
Shared Environmental Factor
Market-wide fear sentiment (Fear & Greed Index: 16 - Extreme Fear) creates headwinds for both assets, with reduced institutional and retail participation typical of such periods.
VI. Conclusion: Which Is the Better Buy?
📌 Investment Value Summary
SVL Advantages:
- Exceptional growth trajectory (+313.41% year-over-year) reflects emerging market opportunity
- Revenue-sharing mechanism aligns incentives with token holders
- Compliant payment infrastructure addresses practical crypto adoption barriers
- Lower entry price point enables portfolio accessibility
QNT Advantages:
- Established market presence (since 2018) with proven operational longevity
- Larger institutional holder base (159,806 holders) indicates distributed ownership
- Overledger technology addresses fundamental blockchain interoperability challenges
- Higher market dominance (0.034% vs 0.0084%) reflects broader market recognition
✅ Investment Recommendations
Beginner Investors:
- Consider QNT as primary position for reduced volatility and established track record, supplemented by 20-30% SVL allocation for growth exposure
- Prioritize capital preservation over aggressive growth
- Build positions gradually through dollar-cost averaging
Experienced Investors:
- Balanced allocation (40-50% SVL / 50-60% QNT) capturing both growth and institutional adoption narratives
- Utilize technical analysis for tactical entry/exit points
- Monitor regulatory developments affecting payment solutions and enterprise blockchain adoption
- Implement stop-loss orders given current extreme fear market conditions
Institutional Investors:
- QNT provides primary exposure to enterprise blockchain infrastructure
- SVL represents emerging payments infrastructure with potential distribution advantages
- Consider both positions as strategic bets on different aspects of blockchain commercialization
- Emphasize due diligence on regulatory compliance frameworks
Market Context Considerations
Current extreme fear sentiment (Fear & Greed Index: 16) suggests potential accumulation opportunities for long-term investors, though near-term volatility remains elevated for both assets.
⚠️ Risk Disclaimer: Cryptocurrency markets exhibit extreme volatility and carry substantial risk of total capital loss. This report presents factual market data and project information and does NOT constitute investment advice, price predictions, or recommendations for any trading activity. SVL's limited operating history and token holder concentration present higher risk profiles than QNT's established infrastructure. Past performance does not guarantee future results. Investors must conduct independent research and consult qualified financial advisors before making investment decisions. Regulatory frameworks governing crypto payments and blockchain interoperability continue to evolve, potentially impacting both projects materially.
Report Generated: December 20, 2025
Data Source: Gate Market Data
Forecast Data: Price forecasts are subject to substantial uncertainty and should be considered illustrative scenarios only.
None
Slash Vision Labs (SVL) vs Quant (QNT): Frequently Asked Questions
I. Market Position and Valuation
Q1: What is the current market capitalization difference between SVL and QNT?
A: As of December 20, 2025, QNT maintains significantly larger market presence with a current market capitalization of $1,065,942,671.07, compared to SVL's $26,792,000. QNT ranks #79 globally while SVL ranks #743, indicating QNT commands approximately 40 times greater market capitalization. However, QNT's fully diluted valuation ($1,090,655,167.56) and SVL's ($267,920,000) show proportionally similar relationships, reflecting different tokenomics structures and supply mechanisms.
Q2: Why has SVL experienced significantly higher price appreciation than QNT despite being newly launched?
A: SVL's 313.41% annual return reflects characteristic early-stage price discovery mechanisms typical of recently launched assets entering growth phases. SVL launched in 2024 and achieved its all-time high of $0.075 in September 2025, demonstrating rapid market acceptance of its crypto-backed payment card concept. Conversely, QNT has experienced -35.88% year-over-year depreciation despite its established 2018 founding, suggesting market reassessment of enterprise blockchain interoperability solutions. The contrast illustrates differing investor sentiment toward payment innovation versus enterprise infrastructure during the current market cycle.
Q3: What does the extreme fear market sentiment (Fear & Greed Index: 16) mean for investment timing?
A: Extreme fear conditions indicate reduced institutional and retail market participation, typically creating accumulation opportunities for long-term investors but amplifying short-term volatility risks. Both SVL and QNT currently operate in this environment, meaning current prices may represent discounted valuations for patient investors. However, extreme fear also correlates with potential for rapid liquidations and further price deterioration, requiring appropriate risk management strategies such as stop-loss orders and gradual position building through dollar-cost averaging rather than lump-sum investments.
II. Technical and Operational Differences
Q4: What are the fundamental differences in how SVL and QNT generate value for token holders?
A: SVL employs a revenue-sharing mechanism distributing 100% of payment product revenues back to the community, creating direct economic alignment between token holders and platform adoption. SVL operates Japan's first compliant crypto-backed credit card through the Mantle Network blockchain. QNT generates value through Overledger, a global blockchain operating system enabling trusted digital interactions across multiple blockchain networks, serving institutional clients including businesses, regulators, and governments. SVL targets consumer-facing payment adoption while QNT targets enterprise interoperability infrastructure, representing fundamentally different market segments and revenue generation models.
Q5: Why does SVL have significantly fewer token holders (2,163) compared to QNT (159,806)?
A: SVL's limited holder base reflects its recent 2024 launch and early adoption phase, indicating concentrated ownership distribution among early supporters. This concentration creates both opportunities and risks: potential for explosive gains if adoption accelerates, but also vulnerability to significant price swings from major holder actions. QNT's 159,806 holders represent seven years of market distribution since its 2018 establishment, providing greater ownership liquidity and reduced single-actor price manipulation risk. SVL's token holder count will likely increase substantially as the project matures and achieves broader market penetration.
Q6: What blockchain dependencies create risks for each project?
A: SVL operates primarily on Mantle Network, a Layer 2 Ethereum scaling solution, exposing SVL to L2-specific risks including network security, smart contract vulnerabilities, and potential technical failures. QNT operates on Ethereum, inheriting both Ethereum's network maturity benefits and exposure to Ethereum's congestion, gas fee fluctuations, and smart contract ecosystem risks. While Ethereum has greater operational history reducing technology risk, SVL's Mantle Network dependency may create additional technical vulnerabilities during periods of network stress or L2 technical incidents.
III. Investment Strategy and Risk Assessment
Q7: Which token is more suitable for conservative versus aggressive investors?
A: Conservative investors should prioritize QNT allocation (80-85% of combined holdings) given its established 2018 operational history, larger institutional holder base, and superior market dominance (0.034% vs SVL's 0.0084%), despite current year-over-year depreciation. Conservative portfolios should supplement with 15-20% SVL for measured growth exposure. Aggressive investors can allocate 40-50% to SVL's higher growth potential while maintaining 50-60% QNT exposure for institutional adoption trends. Conservative investors should implement dollar-cost averaging rather than lump-sum purchases given extreme fear market conditions, while aggressive investors may utilize technical analysis for tactical entry optimization and volatility-hedging strategies.
Q8: What are the primary risk factors distinguishing SVL and QNT investment profiles?
A: SVL's primary risks include extreme early-stage volatility, concentrated token holder distribution (2,163 holders), limited trading volume ($211K daily), and dependency on regulatory approval for crypto payment card adoption across jurisdictions. QNT's primary risks include sustained year-over-year depreciation (-35.88%) indicating potential market skepticism of enterprise interoperability value propositions, historical price decline of 82.8% from 2021 all-time highs suggesting extended bearish investor sentiment, and regulatory uncertainty surrounding enterprise blockchain solution classification. Both assets face shared risks from market-wide extreme fear sentiment potentially triggering rapid liquidations. SVL represents higher short-term volatility with greater long-term growth potential, while QNT represents lower immediate volatility but sustained negative price pressure and uncertain recovery timeline.
Disclaimer: This FAQ addresses factual market information and project characteristics. It does NOT constitute investment advice, price predictions, or recommendations for trading activity. Cryptocurrency markets carry substantial risk including potential total capital loss. Investors must conduct independent research and consult qualified financial advisors before making investment decisions. SVL's limited operational history and concentrated ownership present elevated risk profiles. Past performance does not guarantee future results.
Report Generated: December 20, 2025
Data Source: Gate Market Data
Share
Content
Introduction: SVL vs QNT Investment Comparison
I. Historical Price Comparison and Current Market Status
II. Project Overview and Market Position
III. Price Performance Analysis
IV. Risk Assessment and Market Considerations
⚠️ Data Availability Issue
Required Information for Report Generation
Recommendation
III. 2025-2030 Price Forecast: SVL vs QNT
I. Historical Price Comparison and Current Market Status
II. Project Overview and Market Position
III. Price Performance Analysis
IV. Investment Strategy Comparison: SVL vs QNT
V. Potential Risk Comparison
VI. Conclusion: Which Is the Better Buy?
I. Market Position and Valuation
II. Technical and Operational Differences
III. Investment Strategy and Risk Assessment
How to Buy Cryptocurrency


Trending Cryptocurrencies


2025 AMP Price Prediction: Strategic Analysis and Market Outlook for Cryptocurrency Investors

2025 REQPrice Prediction: Analyzing Market Trends and Potential Growth Factors for Request Network

2025 WPAY Price Prediction: Analyzing Future Growth Potential and Market Trends for the Digital Payment Token

2025 UTKPrice Prediction: Analyzing Growth Potential and Market Trends for UTRUST Token in the Evolving Digital Payment Ecosystem

P vs XLM: A Comprehensive Analysis of Investment Performance in Emerging Markets
UNA vs XLM: Comparing Two Innovative Blockchain Protocols for Cross-Border Transactions

Unlocking Profits: How to Capitalize on Flash Loan Opportunities
The Future of Fiat Currencies: Understanding Their Value Decline

Exploring the Cheems Meme Coin: What Makes It Unique?

Dropee Question of the Day for 20 december 2025
Guide to Obtaining DeFi Loans: A Deep Dive into Crypto Decentralized Lending
