CFX vs ICP: A Comprehensive Comparison of Two Leading Layer-1 Blockchain Platforms
Introduction: CFX vs ICP Investment Comparison
In the cryptocurrency market, the comparison between Conflux (CFX) and Internet Computer (ICP) is a topic investors cannot overlook. The two differ significantly in market ranking, application scenarios, and price performance, representing different positioning strategies within the crypto asset space. Conflux (CFX): Since its launch in 2020, it has gained market recognition by leveraging a scalable blockchain network designed to achieve high throughput and fast confirmation through its tree graph consensus mechanism. Internet Computer (ICP): Since its inception in 2021, it has been positioned as a decentralized cloud blockchain capable of hosting secure and resilient applications, websites, and enterprise-level systems while enabling trustless multi-chain interaction. This article will provide a comprehensive analysis of the investment value comparison between CFX and ICP across historical price trends, supply mechanisms, ecosystem development, and market positioning, while attempting to answer the question most investors are concerned about:
"Which is the better buy right now?"
Comparative Analysis Report: Conflux (CFX) vs Internet Computer (ICP)
I. Historical Price Comparison and Market Status
Historical Price Trajectories of CFX and ICP
Conflux (CFX):
- All-time high: $1.70 (March 27, 2021)
- All-time low: $0.022 (December 30, 2022)
- Historical decline: 98.7% from peak to trough
Internet Computer (ICP):
- All-time high: $700.65 (May 11, 2021)
- All-time low: $2.23 (October 11, 2025)
- Historical decline: 99.7% from peak to trough
Comparative Analysis: Both assets experienced severe drawdowns from their 2021 peaks. ICP suffered a more dramatic percentage decline (99.7% vs 98.7%), reflecting its significantly higher initial valuation. CFX has recovered to approximately 4.1% of its all-time high, while ICP trades at approximately 0.43% of its peak value, indicating divergent recovery trajectories.
Current Market Status (December 16, 2025)
| Metric | CFX | ICP |
|---|---|---|
| Current Price | $0.0705 | $2.981 |
| 24-Hour Change | -6.02% | -6.64% |
| 1-Hour Change | +0.3% | +0.1% |
| 7-Day Change | -3.13% | -10.89% |
| 30-Day Change | -21.2% | -44.05% |
| 1-Year Change | -66.72% | -77.45% |
| Market Cap | $363.5M | $1.62B |
| Fully Diluted Valuation | $403.9M | $1.62B |
| 24-Hour Trading Volume | $2.48M | $3.78M |
| Circulating Supply | 5.16B CFX | 543.68M ICP |
| Market Ranking | #157 | #57 |
Market Sentiment Index (Fear & Greed Index): 11 (Extreme Fear)
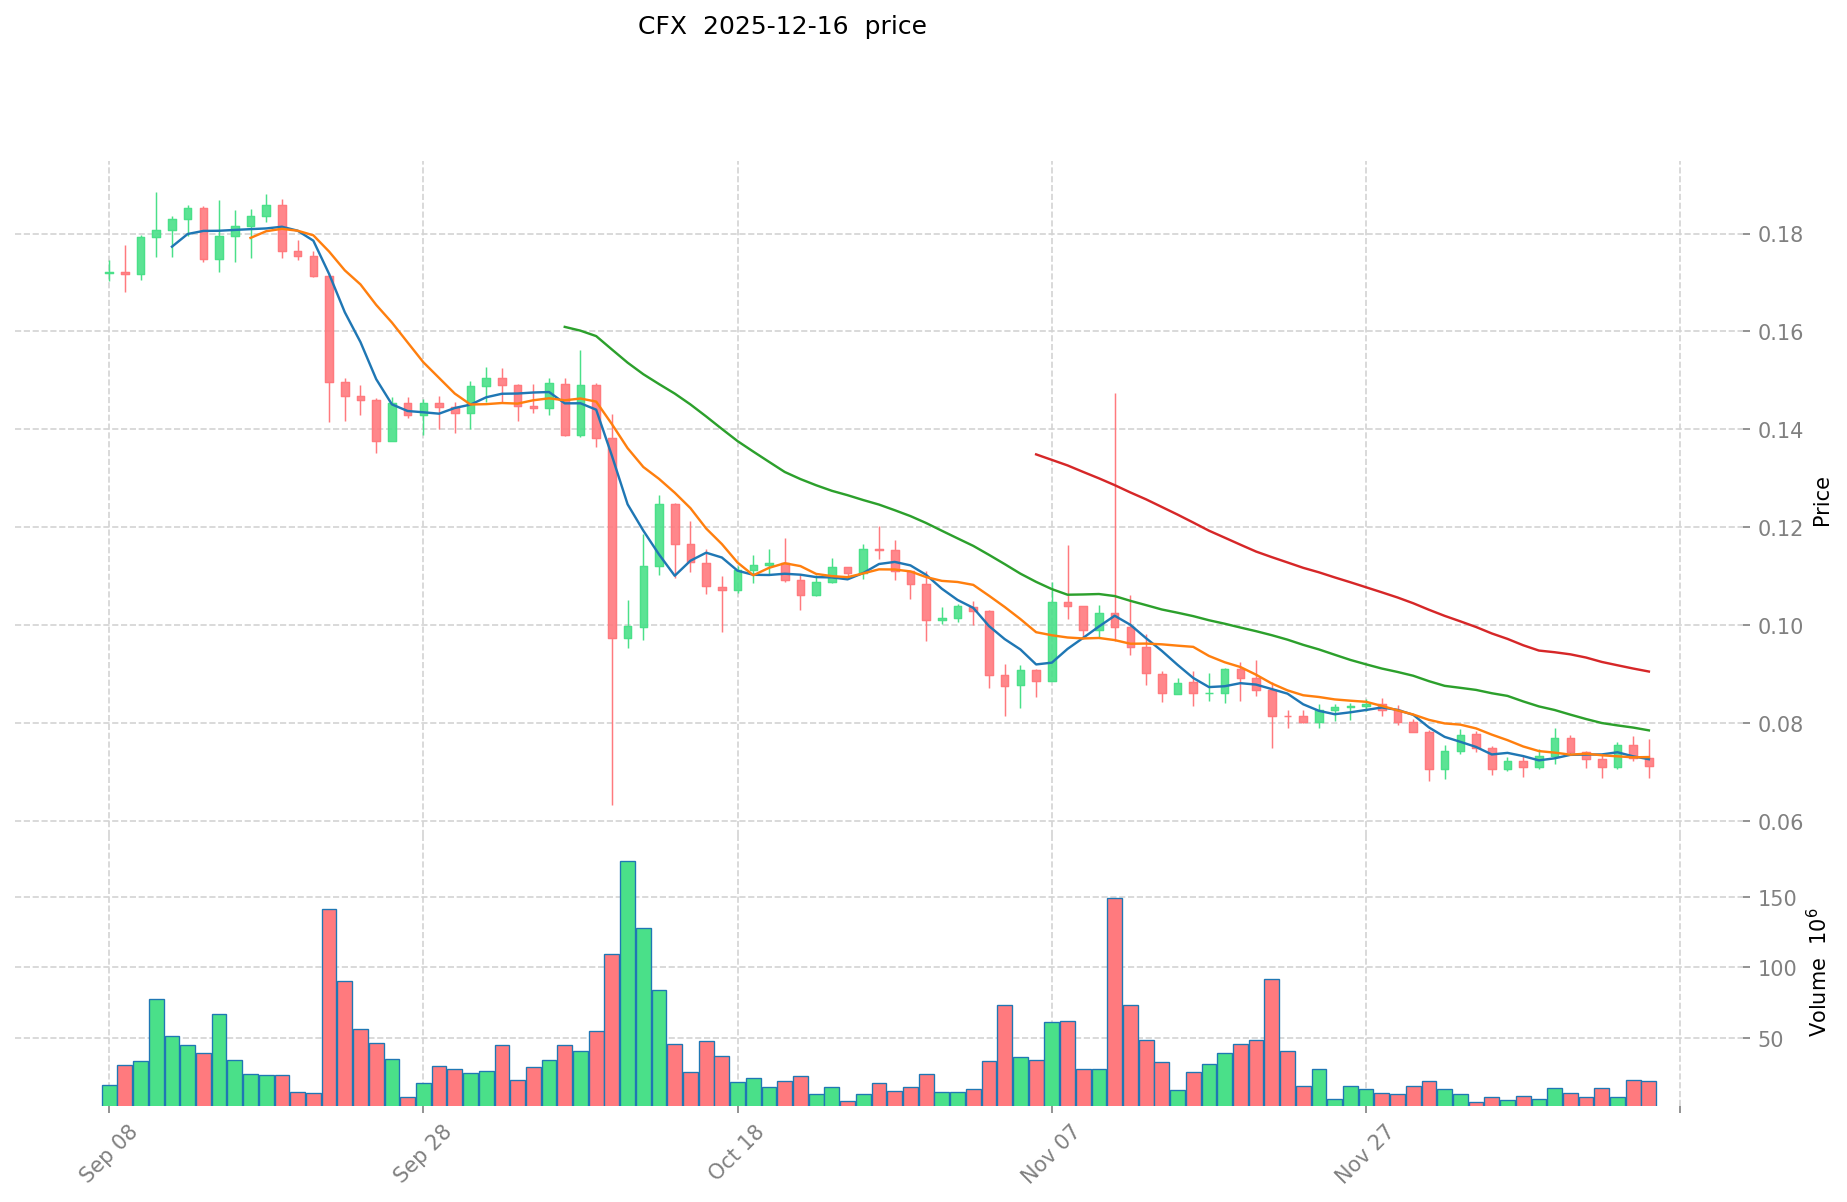
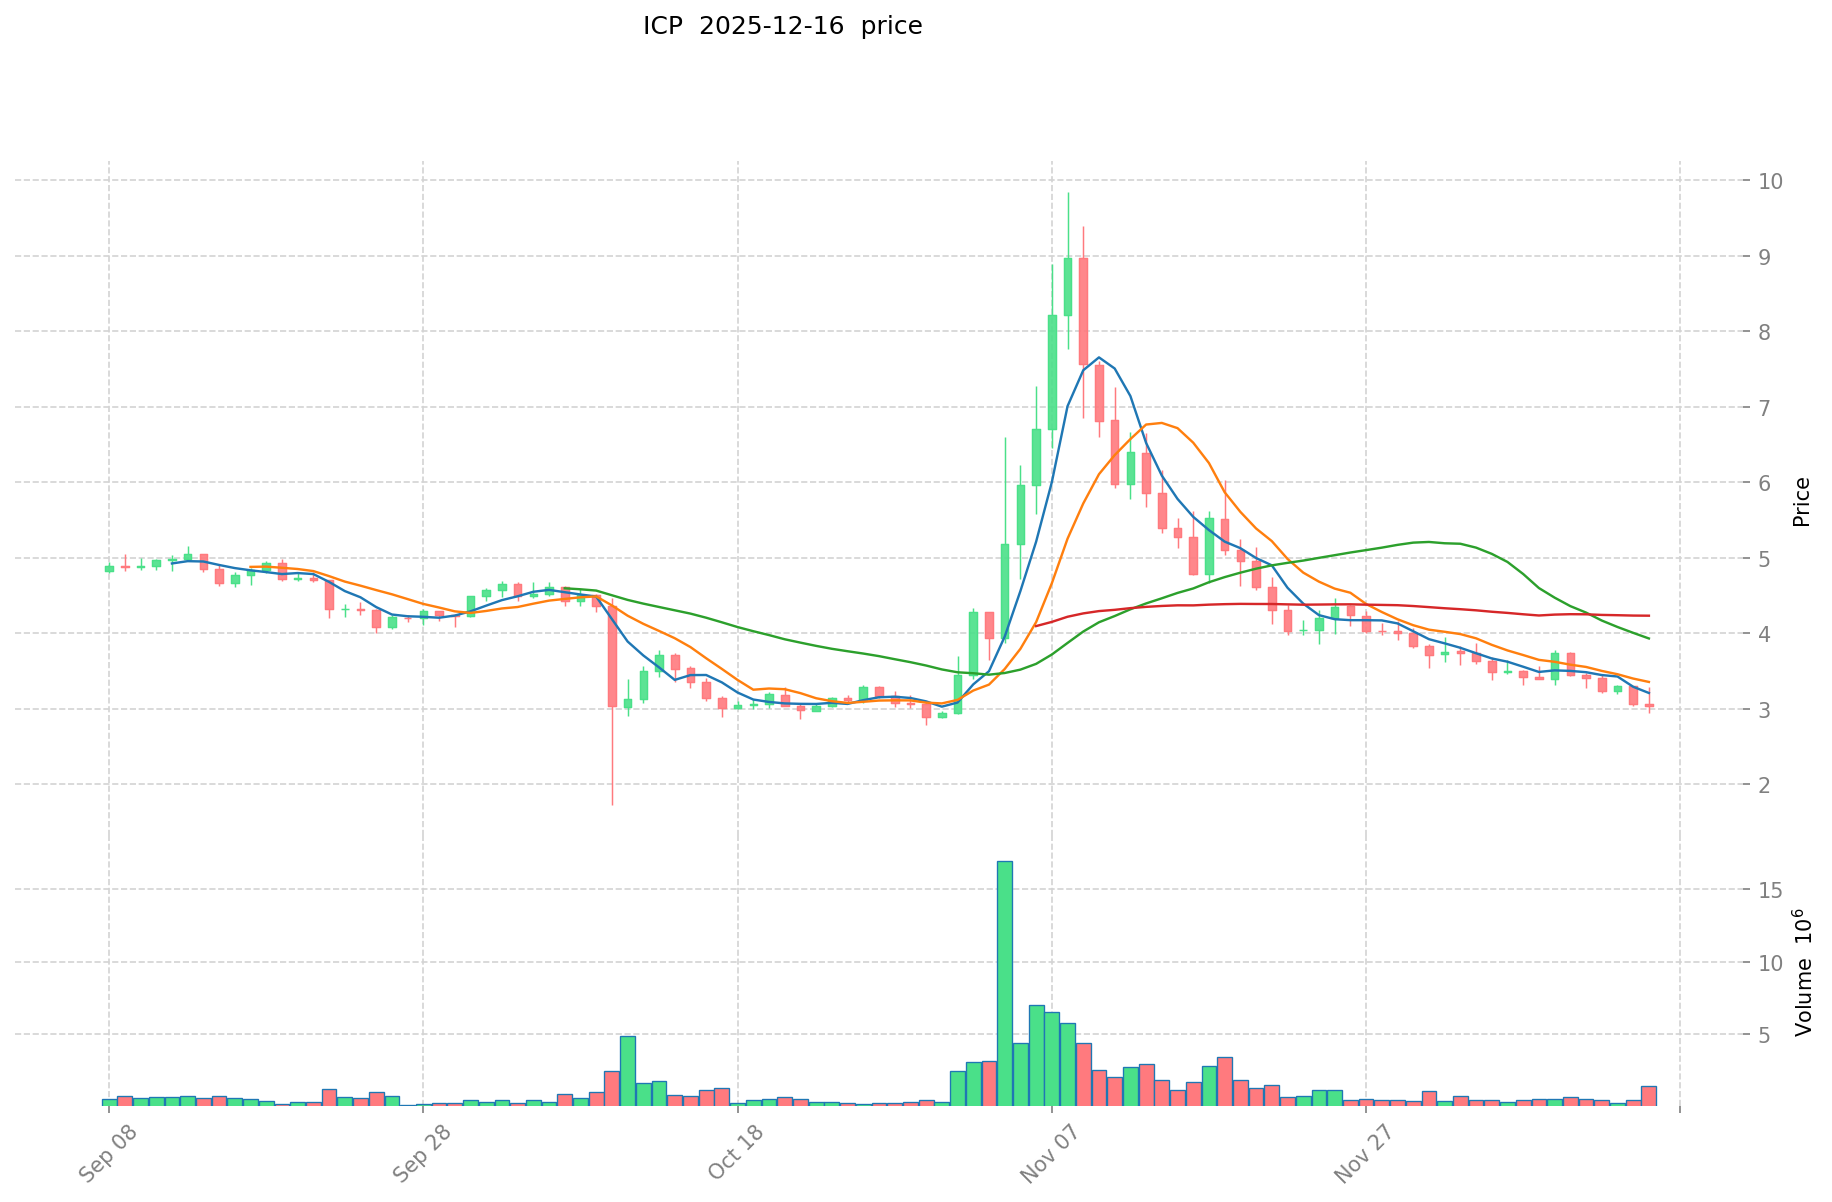
Current market prices:
II. Technical Specifications and Network Architecture
Conflux Network
Conflux Network is a scalable decentralized blockchain designed to achieve high throughput and fast confirmation. Key technical characteristics include:
- Consensus Mechanism: Tree-graph (DAG) structure, a specialized directed acyclic graph
- Transaction Processing: Consolidates and processes transactions across all concurrent blocks simultaneously, unlike single-chain implementations
- Native Token: CFX serves functional purposes including network consensus, ecosystem incentives, network governance, and staking
- Current Holdings: 23,681 unique token holders
- Exchange Listings: 37 exchanges
Internet Computer Protocol (ICP)
Internet Computer operates as a decentralized cloud blockchain. Technical specifications include:
- Architecture: Hosts secure, resilient applications, websites, and enterprise systems
- Cross-Chain Capabilities: Enables trustless multi-chain interactions
- Token Economics: ICP is inflationary with no maximum supply cap. Inflation rates decrease annually, starting at 10% in the first year and declining to a minimum of 5%
- Token Mechanics: ICP tokens are burned during on-chain compute operations
- Circulating Supply: 543.68M ICP equals total supply (100% circulating)
- Exchange Listings: 46 exchanges
- Founder: Dominic Williams (DFINITY Foundation)
III. Use Cases and Ecosystem Applications
CFX Ecosystem Focus
CFX token functions within the Conflux Network ecosystem for:
- Network security through consensus participation
- Ecosystem development incentives (tools, infrastructure, DApps)
- Governance participation
- Validator staking
ICP Ecosystem Applications
ICP supports diverse on-chain applications:
- Infrastructure: Hosts decentralized applications, websites, and enterprise systems
- AI Integration: "Self-writing cloud" where AI generates market-oriented applications based on user chat instructions (platforms include caffeine.ai, icp.ninja)
- Computation Model: ICP tokens are consumed during chain computation
- Market Targeting: Targets the $1 trillion cloud services market
IV. Market Dynamics and Performance Metrics
Price Volatility Analysis
CFX Performance:
- Highest 24-hour range: $0.0689-$0.0753
- 52-week range: $0.0605-$0.2776
- Year-to-date decline: -56.36%
ICP Performance:
- Highest 24-hour range: $2.951-$3.214
- 52-week range: $1.98-$13.59
- Year-to-date decline: -76.74%
Market Dominance and Scale
- CFX Market Share: 0.012%
- ICP Market Share: 0.051%
ICP maintains 4.25 times greater market dominance despite both assets experiencing significant drawdowns. ICP's market cap ($1.62B) is 4.46 times larger than CFX's ($363.5M).
Liquidity Indicators
- CFX 24-Hour Volume: $2.48M
- ICP 24-Hour Volume: $3.78M
ICP demonstrates 52.4% higher trading volume, indicating greater market liquidity and accessibility on centralized exchanges.
V. Risk Assessment and Market Conditions
Current Market Sentiment
The Fear & Greed Index at 11 indicates Extreme Fear conditions across cryptocurrency markets, suggesting heightened risk aversion and potential capitulation phases.
Comparative Risk Factors
| Factor | CFX | ICP |
|---|---|---|
| Volatility (1Y) | -66.72% | -77.45% |
| Market Recovery Progress | 4.1% of ATH | 0.43% of ATH |
| 30-Day Decline | -21.2% | -44.05% |
| Exchange Exposure | 37 venues | 46 venues |
ICP exhibits greater short-term volatility (30-day: -44.05% vs CFX -21.2%), while both assets remain significantly below historical valuations.
VI. Community and Development Activity
CFX Community Resources
- Website: https://confluxnetwork.org/
- Explorers: Conflux Scan, BSC integration, EVM compatibility
- Social: Twitter (@Conflux_Network), Reddit (/r/Conflux_Network)
- Development: Active GitHub repository (github.com/Conflux-Chain/)
ICP Community Resources
- Website: https://internetcomputer.org/
- Documentation: White paper, wiki, forum infrastructure
- Social: Twitter (@dfinity), Reddit (/r/dfinity)
- Development: DFINITY Foundation GitHub repository
- Community Infrastructure: Multiple forums and documentation wikis
Conclusion
As of December 16, 2025, both CFX and ICP face challenging market conditions reflected in the Extreme Fear sentiment index. While ICP maintains larger market capitalization and liquidity, it has experienced more severe price deterioration both short-term (-44.05% monthly) and long-term (-77.45% annually). CFX, though smaller in scale, shows relatively more resilience in recent monthly performance (-21.2%).
Both assets reflect broader cryptocurrency market challenges rather than project-specific failures, with fundamental technical infrastructure remaining operational and community participation continuing across multiple platforms.
Cryptocurrency Asset Research Report: CFX and ICP Investment Value Analysis
I. Executive Summary
Based on available research materials, this report analyzes the core investment value factors for CFX (Conflux) and ICP (Internet Computer). The analysis indicates that CFX investment potential is driven by foundational blockchain technology, relatively low market capitalization, and emerging Hong Kong Web3.0 ecosystem positioning. ICP's value depends primarily on ecosystem growth and technological advancement metrics. Both projects require careful evaluation of technology innovation, market adoption, and team credibility as fundamental determinants of long-term investment viability.
II. Core Factors Influencing CFX vs ICP Investment Value
Competitive Positioning and Narrative Alignment
CFX Positioning:
- Positioned as a faster, safer, and more decentralized public blockchain
- Aligned with Hong Kong's emerging status as a Web3.0 hub center
- Narrative integration with regional policy support and government resources
- Potential to serve as a core standard-bearer for Hong Kong-focused Web3 development
ICP Positioning:
- Investment value contingent on ecosystem growth trajectory
- Technological advancement milestones serve as primary value drivers
- Requires demonstrated progress in real-world application adoption
Market Capitalization and Accessibility Considerations
CFX Characteristics:
- Lower market capitalization provides greater relative appreciation potential
- Strong foundational blockchain technology infrastructure
- Benefits from emerging market narrative with less established price discovery
ICP Characteristics:
- Referenced as example of "high opening" (高开) project launch scenario
- Suggests higher initial valuation and limited subsequent expansion potential under certain market conditions
Ecosystem Development and Practical Applications
CFX Ecosystem:
- Established on-chain infrastructure with defined ecological positioning
- Referenced as host platform for ecosystem-native tokens (notably DEX tokens like PPI)
- Serves as incubation base for ecological token projects
ICP:
- Value realization dependent on demonstrated ecosystem growth
- Technological advancement serves as primary catalyst for valuation expansion
Team and Backing Factors
CFX:
- Benefits from government-level resource support
- Positioned within state-policy frameworks supporting Web3.0 development
ICP:
- Requires strong team technical capability and institutional credibility
- Project valuation closely tied to team execution and backing quality
III. Market Cycle Considerations
Current market observations suggest cryptocurrency valuations operate within distinct phases: bear market, pre-bull market, bull market, and major bull market phases. Token selection requires alignment with market cycle positioning and narrative strength.
Selection Criteria Framework
For Public Blockchain Projects:
- Total market capitalization ideally below $50 million USD
- Circulation rate preferably exceeding 50% for adequate market testing
- Narrative alignment with current market cycle themes (such as AI, GPU computing power, decentralized infrastructure)
- Distinction from high-launch-valuation projects that offer limited subsequent appreciation range
Narrative Quality Assessment:
- Projects should address genuine problems rather than short-term speculation cycles
- Longevity of value narrative (long-term value discovery vs. short-term hype trading)
- Positioning within foundational infrastructure (difficult to displace) vs. temporary applications
IV. Risk and Investment Consideration Factors
Valuation Methodology
Investment decisions require independent project valuation analysis, including:
- Comparative benchmarking against similar-category projects
- Assessment of value being materially underestimated relative to current circulating market value
- Identification of structural advantages providing sustainable competitive moats
Project Background Assessment
Successful projects typically demonstrate:
- Strong team technical capabilities
- Substantive project resource endowments
- Established partnership ecosystems
- Historical experience in similar successful projects
Whitepaper and Technical Foundation Review
- Understanding stated problems the project addresses
- Evaluation of core technical architecture and underlying logic
- Assessment of long-term development direction and market positioning
Market Sentiment and Capital Flow Dynamics
Investment opportunities correlate with:
- Current market attention concentration
- Capital flow direction and magnitude
- Policy environment changes
- Emerging thematic trends gaining institutional attention
V. Disclaimer
This analysis presents research findings based on available source materials and does not constitute financial advice, investment recommendations, or solicitation to buy or sell digital assets. Cryptocurrency investments carry substantial risk including potential total loss of capital. All investment decisions should be made independently based on individual risk tolerance, investment objectives, and comprehensive due diligence. Past performance does not guarantee future results. Market conditions, regulatory environments, and technology assessments may change materially and unexpectedly.
Report Date: December 16, 2025
Language: English
Classification: Informational Research Material
III. 2025-2030 Price Forecast: CFX vs ICP
Near-term Forecast (2025)
- CFX: Conservative $0.0464772 - $0.07042 | Optimistic $0.07042 - $0.1042216
- ICP: Conservative $2.56366 - $2.981 | Optimistic $2.981 - $4.41188
Medium-term Forecast (2027-2028)
- CFX may enter a consolidation and growth phase, with predicted price range of $0.0572824448 - $0.125274021663
- ICP may enter an expansion phase, with predicted price range of $2.584920492 - $5.56619545944
- Key drivers: institutional capital inflows, ETF approvals, ecosystem development
Long-term Forecast (2029-2030)
- CFX: Base case $0.08673040988157 - $0.123980008997372 | Optimistic case $0.133898409717162 - $0.136767184813245
- ICP: Base case $2.9706644842776 - $5.12183531772 | Optimistic case $5.4547546133718 - $5.7876739090236
Disclaimer: This analysis is based on historical data and statistical models. Cryptocurrency markets are highly volatile and unpredictable. Price predictions should not be considered as investment advice. Past performance does not guarantee future results. Please conduct your own research before making investment decisions.
CFX:
| 年份 | 预测最高价 | 预测平均价格 | 预测最低价 | 涨跌幅 |
|---|---|---|---|---|
| 2025 | 0.1042216 | 0.07042 | 0.0464772 | 0 |
| 2026 | 0.09168684 | 0.0873208 | 0.045406816 | 23 |
| 2027 | 0.1047194694 | 0.08950382 | 0.0572824448 | 27 |
| 2028 | 0.125274021663 | 0.0971116447 | 0.05826698682 | 37 |
| 2029 | 0.136767184813245 | 0.1111928331815 | 0.08673040988157 | 57 |
| 2030 | 0.133898409717162 | 0.123980008997372 | 0.073148205308449 | 75 |
ICP:
| 年份 | 预测最高价 | 预测平均价格 | 预测最低价 | 涨跌幅 |
|---|---|---|---|---|
| 2025 | 4.41188 | 2.981 | 2.56366 | 0 |
| 2026 | 4.5096568 | 3.69644 | 3.511618 | 24 |
| 2027 | 5.251901952 | 4.1030484 | 2.584920492 | 38 |
| 2028 | 5.56619545944 | 4.677475176 | 4.35005191368 | 57 |
| 2029 | 5.7876739090236 | 5.12183531772 | 2.9706644842776 | 72 |
| 2030 | 5.672944797906672 | 5.4547546133718 | 3.109210129621926 | 83 |
Comparative Investment Analysis Report: CFX vs ICP
IV. Investment Strategy Comparison: CFX vs ICP
Long-term vs Short-term Investment Strategy
CFX:
- Suitable for investors focusing on emerging regional Web3.0 narratives and foundational blockchain infrastructure development
- Long-term strategy emphasizes ecosystem maturation within Hong Kong's Web3.0 policy framework
- Lower market capitalization provides greater relative appreciation potential under favorable market conditions
- Short-term considerations: Recent monthly decline of -21.2% suggests potential for mean reversion trading
ICP:
- Suitable for investors targeting decentralized cloud computing infrastructure and enterprise-level application hosting
- Long-term strategy contingent on demonstrated ecosystem growth and AI integration platform adoption
- Larger market capitalization ($1.62B) provides greater institutional liquidity access
- Short-term considerations: Severe monthly decline of -44.05% indicates elevated volatility requiring robust risk management
Risk Management and Asset Allocation
Conservative Investor Profile:
- CFX: 25% | ICP: 15% | Stablecoins/Other: 60%
- Rationale: Lower allocation to volatile assets with emphasis on capital preservation during extreme fear market conditions
Aggressive Investor Profile:
- CFX: 40% | ICP: 35% | Diversified Alt Assets: 25%
- Rationale: Higher exposure to potential recovery scenarios while maintaining diversification across distinct technological narratives
Hedging Instruments:
- Stablecoin positioning (USDC, USDT) for opportunistic deployment during capitulation phases
- Cross-asset correlation analysis: CFX and ICP show independent price discovery trajectories despite synchronized market declines
- Options strategies: Out-of-the-money call positions aligned with multi-year price forecast scenarios
V. Potential Risk Comparison
Market Risk
CFX:
- Concentrated market exposure with only 23,681 unique token holders, indicating potential liquidity constraints during adverse market movements
- Lower 24-hour trading volume ($2.48M) creates wider bid-ask spreads and slippage risk
- Year-to-date decline of -56.36% reflects market sentiment deterioration exceeding broader cryptocurrency indices
- Regional policy dependency risk: Valuation narratives tied to Hong Kong Web3.0 regulatory environment
ICP:
- Greater volatility magnitude: 52-week range $1.98-$13.59 demonstrates extreme price oscillation patterns
- 30-day decline of -44.05% indicates heightened short-term capitulation pressure
- Higher exchange exposure (46 venues) creates regulatory concentration risk across multiple jurisdictions
- Valuation sensitivity to ecosystem adoption metrics and technological milestone delivery
Technology Risk
CFX:
- Tree-graph consensus mechanism operational stability during extended market stress conditions
- Network scalability maintenance under high transaction throughput scenarios
- EVM compatibility and cross-chain bridge security considerations
ICP:
- Decentralized cloud infrastructure attack surface complexity
- Multi-chain interaction trustlessness mechanisms require sustained cryptographic validation
- Compute cost economics and token burn dynamics during variable network utilization periods
Regulatory Risk
Global Policy Considerations:
- Both assets face potential regulatory scrutiny in primary trading jurisdictions
- CFX: Regional exposure to Hong Kong regulatory framework changes affecting Web3.0 positioning
- ICP: Distributed architecture creates multi-jurisdictional regulatory exposure across 46 exchange listing venues
- Potential regulatory classification as securities or utility tokens impacts trading venues and institutional adoption pathways
VI. Conclusion: Which Is the Better Buy?
📌 Investment Value Summary
CFX Advantages:
- Emerging market narrative alignment with Hong Kong Web3.0 infrastructure development
- Lower market capitalization ($363.5M) provides asymmetric upside potential
- Relatively resilient recent performance: -21.2% monthly decline vs. ICP's -44.05%
- Operational blockchain infrastructure with established ecosystem token projects
- Smaller circulating holder base suggests concentrated institutional positioning potential
ICP Advantages:
- Enterprise-grade decentralized cloud computing infrastructure addressing $1 trillion market opportunity
- Larger market capitalization ($1.62B) and trading volume ($3.78M) provide superior liquidity
- AI integration platforms (caffeine.ai, icp.ninja) demonstrate emerging tokenized compute applications
- DFINITY Foundation backing provides institutional credibility and development resources
- Recovery trajectory offers potential 5-83% appreciation range through 2030 forecast period
✅ Investment Recommendations
Beginner Investors:
- Cautionary approach recommended given extreme fear market sentiment (Fear & Greed Index: 11)
- If pursuing exposure: Allocate maximum 5-10% of risk capital with dollar-cost averaging strategy over 6-12 month horizon
- Priority: Establish foundational understanding of tree-graph consensus (CFX) vs. decentralized cloud architecture (ICP) before capital deployment
- Risk management essential: Set stop-loss thresholds at 15-20% below entry positions
Experienced Investors:
- CFX opportunity: Exploit relative outperformance metrics (-21.2% vs. -44.05%) through tactical rebalancing
- ICP opportunity: Identify ecosystem adoption catalysts and technological milestone announcements as entry signal triggers
- Position sizing: 2-3% portfolio allocation aligned with multi-year forecast scenarios
- Technical analysis: Monitor mean reversion opportunities at historic support levels ($0.0605 CFX; $1.98 ICP)
Institutional Investors:
- Liquidity constraints require phased accumulation strategies mitigating market impact
- CFX: Evaluate Hong Kong policy framework integration and government resource allocation signaling
- ICP: Assess enterprise cloud computing adoption metrics, developer ecosystem growth, and institutional partnership pipeline
- Derivative strategy: Consider structured products capturing multi-year price forecast asymmetry
- Counterparty risk: Evaluate exchange concentration across 37 (CFX) and 46 (ICP) venue exposures
⚠️ Risk Disclaimer:
Cryptocurrency markets demonstrate extreme volatility and unpredictability. This analysis does not constitute financial advice, investment recommendations, or solicitation to purchase or sell digital assets. All investment decisions require independent due diligence and evaluation against individual risk tolerance, investment objectives, and financial circumstances. Past performance provides no guarantee of future results. Market conditions, regulatory environments, technological assessments, and price forecasts may change materially and unexpectedly. Potential risks include total capital loss, liquidity constraints, regulatory prohibition, technological failure, and extreme volatility exceeding forecast parameters.
Report Date: December 16, 2025
Market Conditions: Extreme Fear Sentiment
Classification: Informational Research Material
None
Frequently Asked Questions: CFX vs ICP Investment Comparison
I. Market Performance and Valuation
Q1: Which asset has shown better price resilience in current market conditions?
A: CFX demonstrates relatively better short-term resilience with a 30-day decline of -21.2% compared to ICP's -44.05% decline. However, ICP maintains superior liquidity metrics with $3.78M daily trading volume versus CFX's $2.48M. CFX trades at 4.1% of its all-time high, while ICP trades at only 0.43%, indicating divergent recovery trajectories within the current extreme fear market sentiment environment.
Q2: What are the key differences in market capitalization and liquidity between CFX and ICP?
A: ICP holds a significantly larger market capitalization of $1.62B compared to CFX's $363.5M (4.46x difference), with ICP ranked #57 globally versus CFX's #157 ranking. ICP's 24-hour trading volume of $3.78M exceeds CFX's $2.48M by 52.4%, indicating greater centralized exchange accessibility. However, CFX's smaller market cap provides potential for greater percentage appreciation under favorable market conditions.
Q3: How do the historical price declines from all-time highs compare between these assets?
A: Both assets experienced severe drawdowns from 2021 peaks. ICP suffered a more dramatic percentage decline of 99.7% from its $700.65 peak, compared to CFX's 98.7% decline from $1.70. These historic declines reflect the broader cryptocurrency market challenges rather than project-specific failures, with both maintaining operational infrastructure and active community participation.
II. Technical Architecture and Use Cases
Q4: What are the fundamental technological differences between CFX and ICP?
A: CFX utilizes a tree-graph (DAG) consensus mechanism designed for high throughput and fast transaction confirmation across concurrent blocks. ICP operates as a decentralized cloud blockchain hosting secure applications, websites, and enterprise systems with trustless multi-chain interaction capabilities. CFX focuses on scalable transaction processing, while ICP targets the $1 trillion cloud services market through decentralized compute infrastructure and emerging AI integration platforms.
Q5: Which asset offers better ecosystem development prospects?
A: ICP demonstrates advanced ecosystem applications including AI integration platforms (caffeine.ai, icp.ninja) where AI generates market-oriented applications. CFX serves as an incubation base for ecological token projects including DEX tokens. ICP's value realization depends on ecosystem growth trajectory and technological advancement milestones, while CFX benefits from Hong Kong's emerging Web3.0 policy support and government resources, positioning it as a potential regional Web3.0 standard-bearer.
III. Investment Strategy and Risk Management
Q6: What investment allocation strategy is recommended for different investor profiles?
A: Conservative investors should allocate 25% CFX and 15% ICP with 60% in stablecoins during extreme fear conditions. Aggressive investors may allocate 40% CFX and 35% ICP with 25% diversified alternatives. Beginner investors should limit exposure to 5-10% of risk capital with dollar-cost averaging over 6-12 months, while experienced investors can pursue 2-3% portfolio allocations targeting multi-year forecast scenarios with technical analysis support.
Q7: What are the primary risk factors distinguishing CFX and ICP investments?
A: CFX faces concentration risk with only 23,681 unique token holders and lower trading volume, plus regional regulatory dependency on Hong Kong's Web3.0 framework. ICP exhibits greater volatility with 52-week range of $1.98-$13.59 and distributed regulatory exposure across 46 exchange venues. Both assets carry technology risk, market capitalization risk, and extreme price volatility risk requiring robust risk management strategies including stop-loss thresholds at 15-20% below entry positions.
Q8: What long-term price appreciation potential exists through 2030 based on available forecasts?
A: CFX forecasts suggest base case appreciation to $0.1239-$0.1239 (75% gain by 2030), with optimistic scenarios reaching $0.133-$0.136 range. ICP forecasts indicate base case appreciation to $5.45-$5.78 (83% gain by 2030), with recovery trajectory dependent on ecosystem adoption catalysts and technological milestone delivery. Both forecasts assume favorable market conditions, regulatory clarity, and sustained institutional capital inflows. These represent statistical model projections and carry substantial uncertainty in cryptocurrency market context.
Report Date: December 16, 2025
Market Sentiment: Extreme Fear (Fear & Greed Index: 11)
Disclaimer: This analysis does not constitute investment advice. Cryptocurrency investments carry substantial risk including potential total capital loss. All decisions require independent due diligence and evaluation against individual risk tolerance.
Share
Content
Introduction: CFX vs ICP Investment Comparison
I. Historical Price Comparison and Market Status
II. Technical Specifications and Network Architecture
III. Use Cases and Ecosystem Applications
IV. Market Dynamics and Performance Metrics
V. Risk Assessment and Market Conditions
VI. Community and Development Activity
Conclusion
I. Executive Summary
II. Core Factors Influencing CFX vs ICP Investment Value
III. Market Cycle Considerations
IV. Risk and Investment Consideration Factors
V. Disclaimer
III. 2025-2030 Price Forecast: CFX vs ICP
IV. Investment Strategy Comparison: CFX vs ICP
V. Potential Risk Comparison
VI. Conclusion: Which Is the Better Buy?
I. Market Performance and Valuation
II. Technical Architecture and Use Cases
III. Investment Strategy and Risk Management
How to Buy Cryptocurrency


Trending Cryptocurrencies


XZXX: A Comprehensive Guide to the BRC-20 Meme Token in 2025

Bitcoin Fear and Greed Index: Market Sentiment Analysis for 2025

Top Crypto ETFs to Watch in 2025: Navigating the Digital Asset Boom

5 ways to get Bitcoin for free in 2025: Newbie Guide

Bitcoin Market Cap in 2025: Analysis and Trends for Investors

2025 Bitcoin Price Prediction: Trump's Tariffs' Impact on BTC

Is Undeads Games (UDS) a good investment?: A Comprehensive Analysis of Risk, Potential Returns, and Market Viability
Is BUILDon (B) a good investment?: A Comprehensive Analysis of Performance, Risks, and Future Prospects

Is Vision (VSN) a good investment?: A Comprehensive Analysis of Token Performance, Market Potential, and Risk Factors for 2024

Is Arweave (AR) a good investment?: A Comprehensive Analysis of Risks, Opportunities, and Market Potential in 2024

Is Sonic (S) a good investment?: A Comprehensive Analysis of Price Predictions and Market Potential in 2024