API3 vs XLM: Comparing Two Innovative Blockchain Oracle Solutions
Introduction: Investment Comparison of API3 vs XLM
In the cryptocurrency market, the comparison between API3 vs XLM has always been an unavoidable topic for investors. The two not only have significant differences in market cap ranking, application scenarios, and price performance, but also represent different positioning in crypto assets.
API3 (API3): Launched in 2020, it has gained market recognition for its role as a data oracle that allows APIs to provide data directly to blockchain applications without intermediaries.
Stellar (XLM): Since its inception in 2014, it has been hailed as a decentralized gateway for transmitting digital and fiat currencies, facilitating rapid, stable, and low-cost transfers of digital assets between banks, payment institutions, and individuals.
This article will comprehensively analyze the investment value comparison between API3 vs XLM, focusing on historical price trends, supply mechanisms, institutional adoption, technological ecosystems, and future predictions, attempting to answer the question investors care about most:
"Which is the better buy right now?"
I. Price History Comparison and Current Market Status
API3 (Coin A) and XLM (Coin B) Historical Price Trends
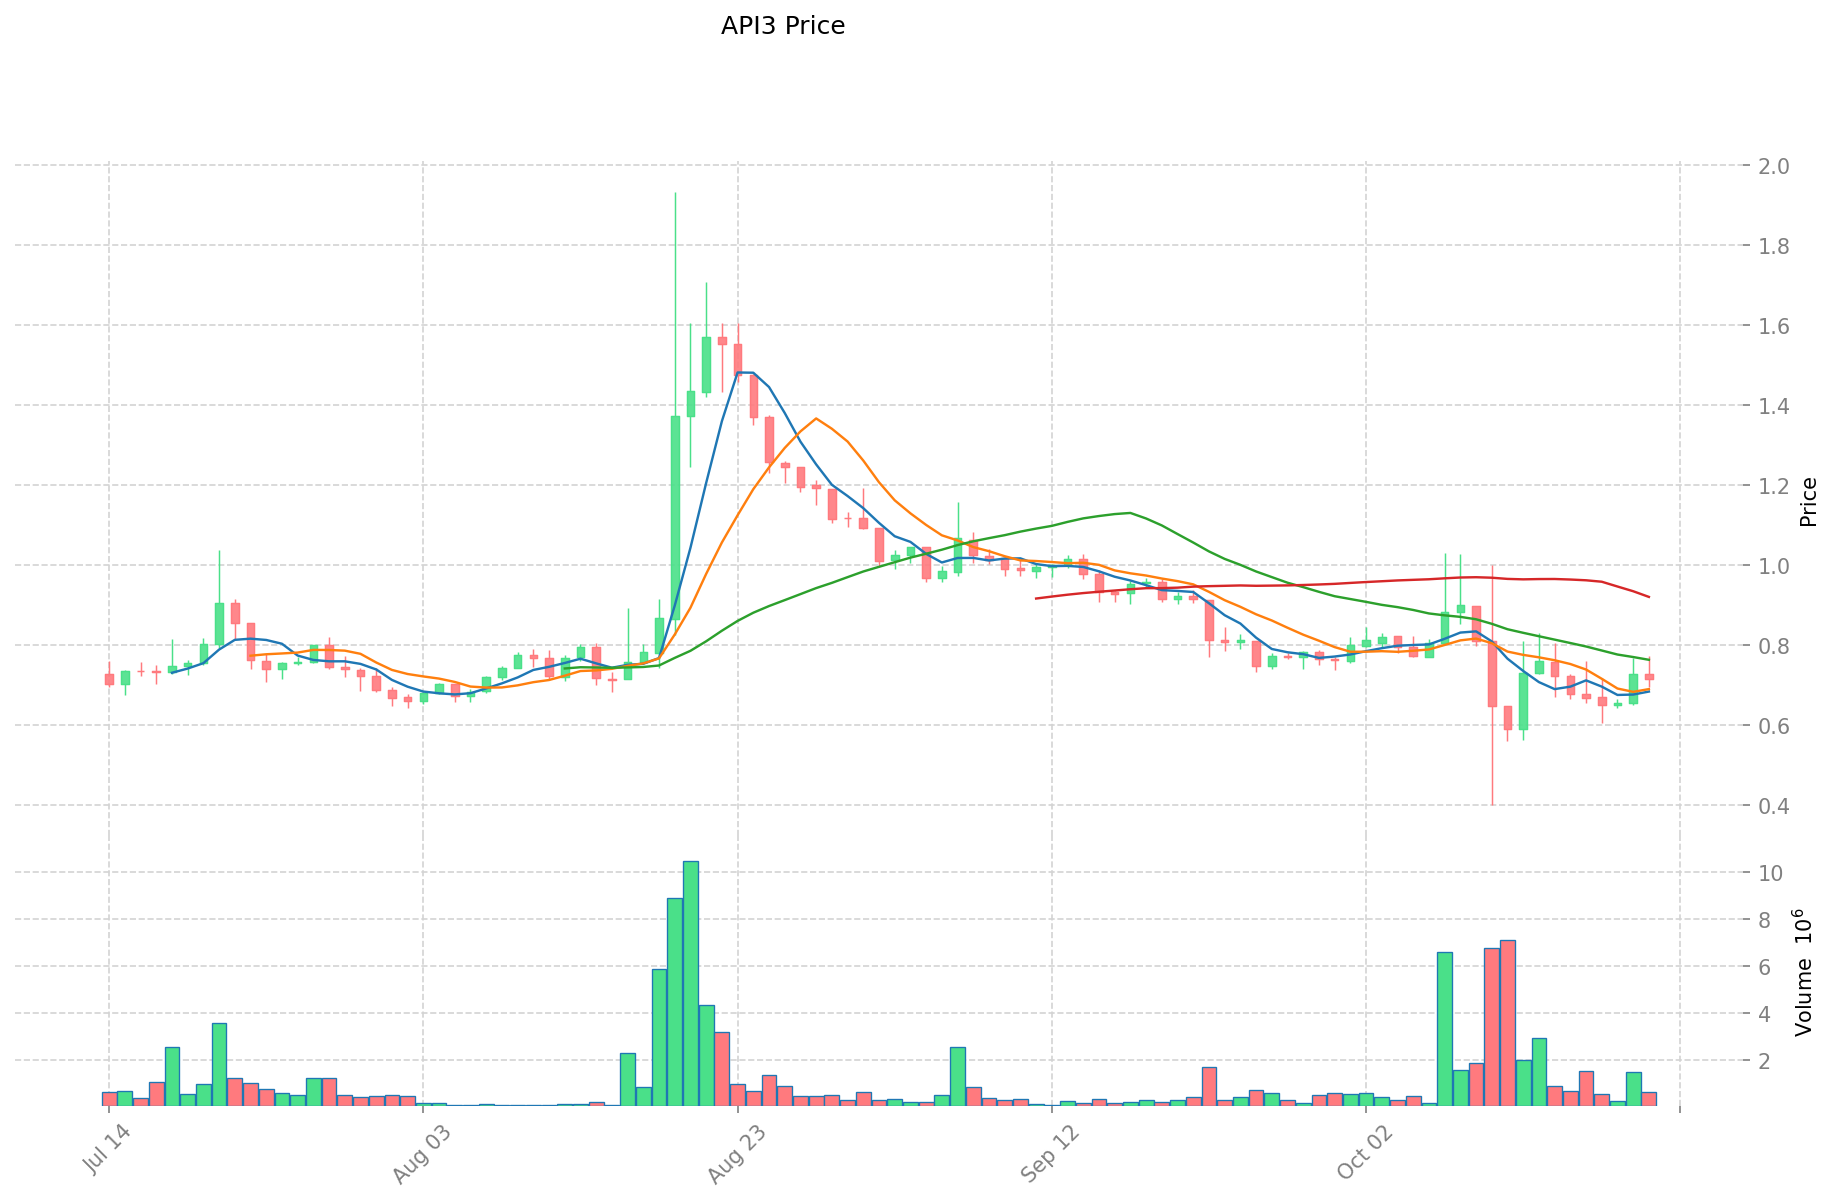
- 2021: API3 reached its all-time high of $10.3 on April 7, 2021.
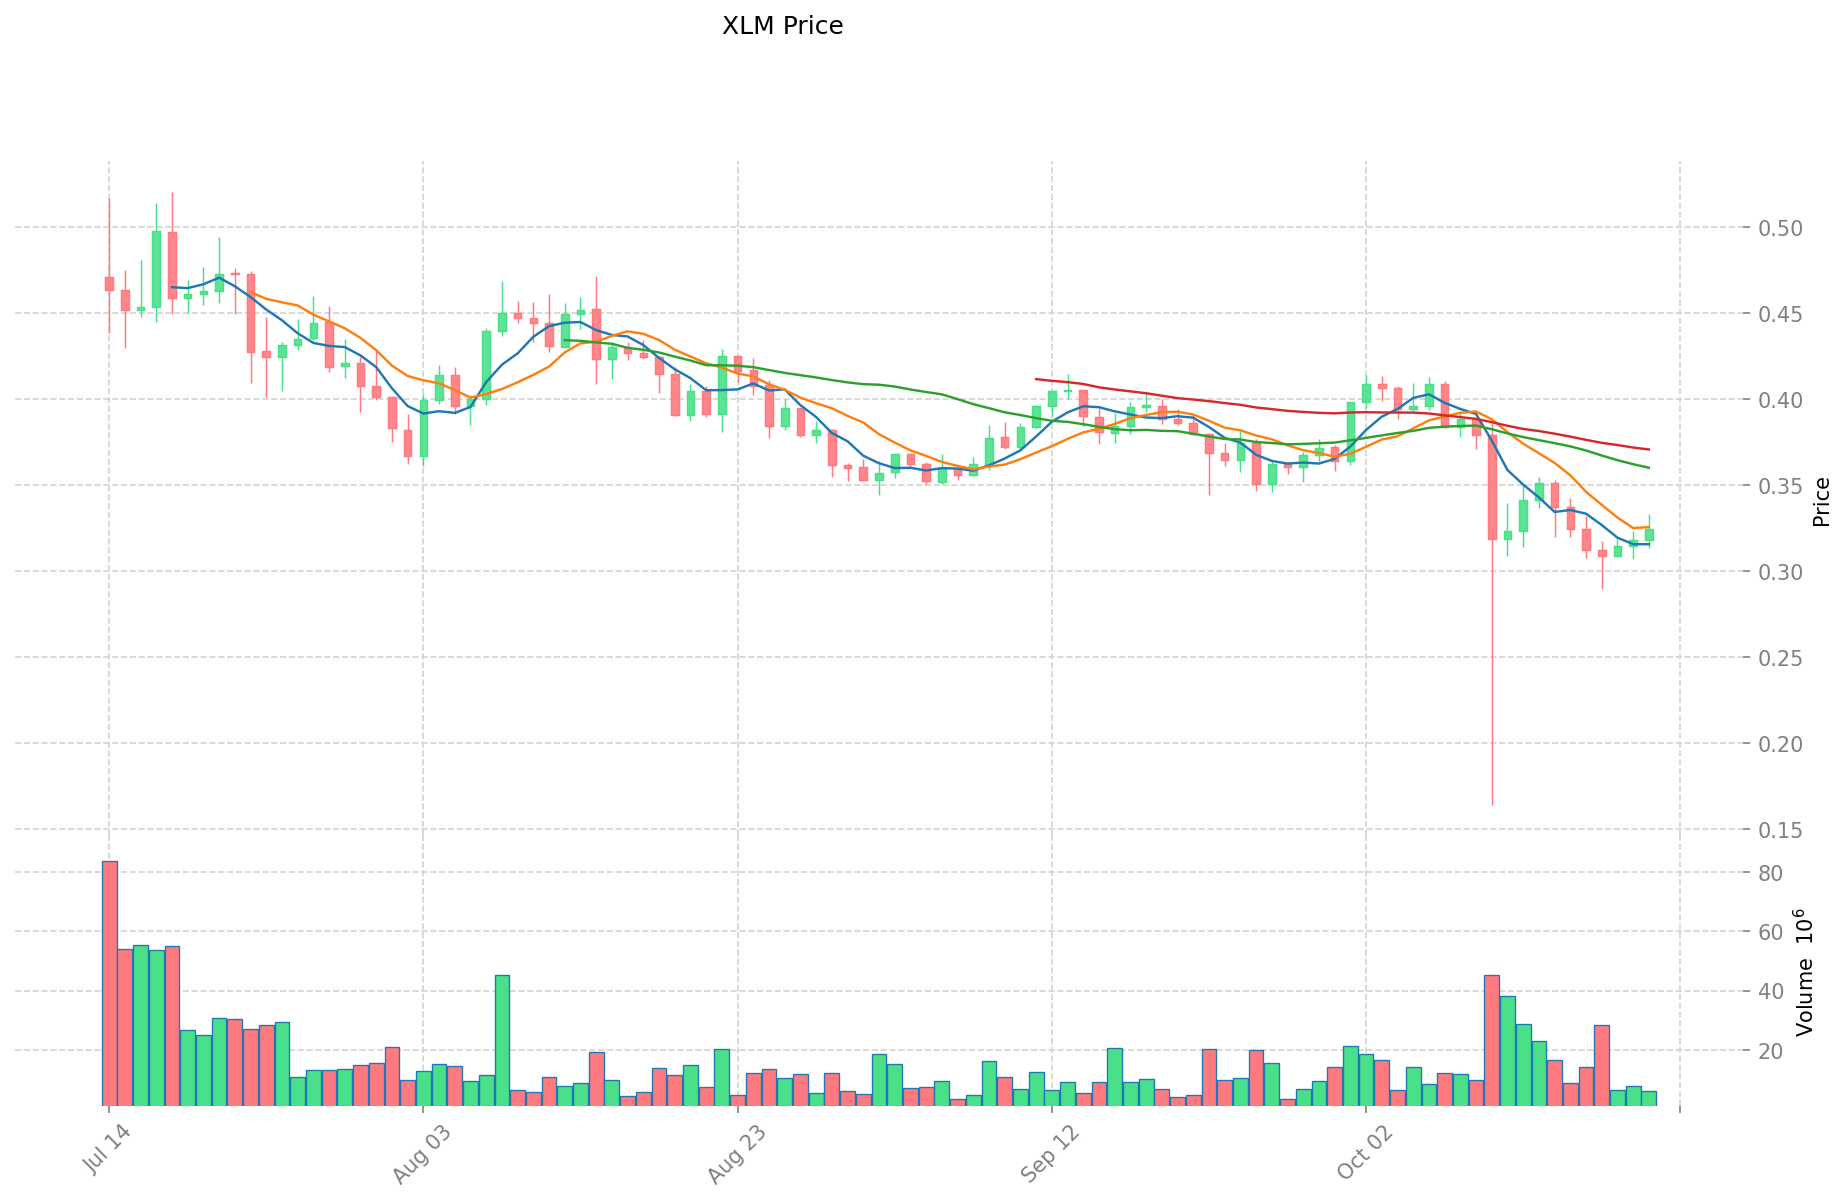
- 2025: XLM has seen significant growth, with its price increasing by 235.74% over the past year.
- Comparative analysis: In the current market cycle, API3 has fallen from its all-time high of $10.3 to its current price of $0.7168, while XLM has shown more resilience, currently trading at $0.32514.
Current Market Situation (2025-10-21)
- API3 current price: $0.7168
- XLM current price: $0.32514
- 24-hour trading volume: API3 $440,508.25 vs XLM $2,008,070.49
- Market Sentiment Index (Fear & Greed Index): 29 (Fear)
Click to view real-time prices:
- View API3 current price Market Price
- View XLM current price Market Price
II. Market Cap and Ranking Analysis
Market Cap Comparison
- API3 market cap: $93,944,743.40
- XLM market cap: $10,406,533,260.24
- Ranking: API3 (#424) vs XLM (#18)
Circulating Supply and Total Supply
- API3: Circulating supply - 131,061,304.97 API3 (85.47% of total supply) Total supply - 153,350,624.54 API3
- XLM: Circulating supply - 32,006,315,003.51 XLM (64.01% of total supply) Total supply - 50,001,786,892 XLM
III. Technology and Development Progress
API3
- Core components: Beacons (lightweight first-party data feeds) and Airnode (Web3 middleware)
- Recent developments: Focus on providing decentralized API services for blockchain applications
XLM
- Key features: Fast, low-cost cross-border transactions and asset tokenization
- Recent progress: Continued adoption for issuing new assets on the Stellar network due to its strong network throughput and low-cost characteristics
IV. Ecosystem and Partnerships
API3
- Governance: API3 token holders can propose and vote on governance proposals
- Partnerships: Information on specific partnerships not available in the given context
XLM
- Ecosystem growth: Stellar has attracted numerous projects to issue new assets on its network
- Partnerships: Specific partnership details not provided in the given context
V. Investment Risks and Opportunities
Potential Risks
- Market volatility: Both tokens have shown significant price fluctuations
- Regulatory uncertainties: Potential impact of evolving cryptocurrency regulations
Potential Opportunities
- API3: Growing demand for decentralized API services in the blockchain space
- XLM: Increasing adoption for cross-border transactions and asset tokenization
Disclaimer: This report is for informational purposes only and should not be considered as financial advice. Cryptocurrency investments carry high risk, and past performance does not guarantee future results.
II. Core Factors Affecting API3 vs XLM Investment Value
Market Sentiment and Volatility
- API3: Shows significant price volatility with fluctuations between 1,425.97 MMK and 1,527.92 MMK (low range) and between 1,059.22 MMK and 1,900.52 MMK (high range)
- XLM: Generally demonstrates higher stability compared to API3 based on market patterns
- 📌 Historical Pattern: API3's higher volatility may offer greater short-term trading opportunities but comes with increased risk
Regulatory Environment
- Regulatory policies directly impact cryptocurrency valuations and adoption rates for both tokens
- Government stance on cryptocurrencies significantly influences the trading environment and investor confidence
- Regional differences in regulatory approaches create varying market conditions across jurisdictions
Technical Development
- API3: Focused on decentralized API connectivity solutions
- Market indicators suggest ongoing technical development across the cryptocurrency sector, including projects like 0G that demonstrate steady progress
- Project development supported by significant investments from listed companies and recruitment of senior talent establishes foundations for long-term growth
Market Metrics and Valuation
- Realized Cap (RC) provides a more accurate reflection of true blockchain network value by excluding lost or long-inactive tokens
- Higher selling/movement price points for tokens generally indicate stronger subsequent performance
- Token unlocks (as seen with IMX) can impact market dynamics through increased circulating supply
III. 2025-2030 Price Prediction: API3 vs XLM
Short-term Prediction (2025)
- API3: Conservative $0.50836 - $0.716 | Optimistic $0.716 - $0.91648
- XLM: Conservative $0.2563313 - $0.32447 | Optimistic $0.32447 - $0.3958534
Mid-term Prediction (2027)
- API3 may enter a growth phase, with estimated price range $0.813342348 - $0.929534112
- XLM may enter a growth phase, with estimated price range $0.34229767968 - $0.5056670268
- Key drivers: Institutional capital inflow, ETF, ecosystem development
Long-term Prediction (2030)
- API3: Base scenario $0.775566537517548 - $1.2310579960596 | Optimistic scenario $1.2310579960596 - $1.366474375626156
- XLM: Base scenario $0.370072997025534 - $0.5363376768486 | Optimistic scenario $0.5363376768486 - $0.686512226366208
Disclaimer
API3:
| 年份 | 预测最高价 | 预测平均价格 | 预测最低价 | 涨跌幅 |
|---|---|---|---|---|
| 2025 | 0.91648 | 0.716 | 0.50836 | 0 |
| 2026 | 0.9713256 | 0.81624 | 0.7264536 | 13 |
| 2027 | 0.929534112 | 0.8937828 | 0.813342348 | 24 |
| 2028 | 1.14868965456 | 0.911658456 | 0.81137602584 | 27 |
| 2029 | 1.4319419368392 | 1.03017405528 | 0.5253887681928 | 43 |
| 2030 | 1.366474375626156 | 1.2310579960596 | 0.775566537517548 | 71 |
XLM:
| 年份 | 预测最高价 | 预测平均价格 | 预测最低价 | 涨跌幅 |
|---|---|---|---|---|
| 2025 | 0.3958534 | 0.32447 | 0.2563313 | 0 |
| 2026 | 0.417787572 | 0.3601617 | 0.234105105 | 10 |
| 2027 | 0.5056670268 | 0.388974636 | 0.34229767968 | 19 |
| 2028 | 0.527838581052 | 0.4473208314 | 0.433901206458 | 37 |
| 2029 | 0.5850956474712 | 0.487579706226 | 0.45344912679018 | 49 |
| 2030 | 0.686512226366208 | 0.5363376768486 | 0.370072997025534 | 64 |
IV. Investment Strategy Comparison: API3 vs XLM
Long-term vs Short-term Investment Strategy
- API3: Suitable for investors focused on decentralized API solutions and ecosystem potential
- XLM: Suitable for investors interested in cross-border payment solutions and asset tokenization
Risk Management and Asset Allocation
- Conservative investors: API3: 20% vs XLM: 80%
- Aggressive investors: API3: 60% vs XLM: 40%
- Hedging tools: Stablecoin allocation, options, cross-currency portfolio
V. Potential Risk Comparison
Market Risk
- API3: Higher volatility and potential for significant price swings
- XLM: Relatively more stable but still subject to overall crypto market trends
Technical Risk
- API3: Scalability, network stability
- XLM: Network congestion during high transaction periods
Regulatory Risk
- Global regulatory policies may have differing impacts on both tokens
VI. Conclusion: Which Is the Better Buy?
📌 Investment Value Summary:
- API3 advantages: Focused on decentralized API services, potential for growth in blockchain applications
- XLM advantages: Established network for cross-border transactions, lower transaction costs
✅ Investment Advice:
- New investors: Consider a higher allocation to XLM for its relative stability
- Experienced investors: Balanced portfolio with both API3 and XLM based on risk tolerance
- Institutional investors: Strategic allocation to both, with emphasis on XLM for its established network and API3 for potential growth
⚠️ Risk Warning: The cryptocurrency market is highly volatile, and this article does not constitute investment advice. None
VII. FAQ
Q1: What are the main differences between API3 and XLM? A: API3 focuses on providing decentralized API services for blockchain applications, while XLM specializes in fast, low-cost cross-border transactions and asset tokenization. API3 has a smaller market cap and is more volatile, while XLM has a larger market cap and is relatively more stable.
Q2: Which coin has shown better price performance recently? A: Based on the provided data, XLM has shown better recent performance, with a 235.74% price increase over the past year. API3, on the other hand, has fallen from its all-time high and is currently trading at a lower price.
Q3: How do the market caps of API3 and XLM compare? A: XLM has a significantly larger market cap of $10,406,533,260.24, ranking #18 in the cryptocurrency market. API3 has a smaller market cap of $93,944,743.40, ranking #424.
Q4: What are the potential risks associated with investing in API3 and XLM? A: Both coins face market volatility and regulatory uncertainties. API3 has higher volatility and potential technical risks related to scalability and network stability. XLM may face network congestion during high transaction periods and is subject to overall crypto market trends.
Q5: Which coin might be better for long-term investment? A: The choice depends on individual investment goals and risk tolerance. XLM may be more suitable for conservative investors due to its established network and relative stability. API3 could offer higher growth potential for those willing to take on more risk and believe in the future of decentralized API services.
Q6: How do the 2030 price predictions compare for API3 and XLM? A: The long-term predictions for 2030 suggest potential growth for both coins. API3's base scenario ranges from $0.775566537517548 to $1.2310579960596, with an optimistic scenario up to $1.366474375626156. XLM's base scenario ranges from $0.370072997025534 to $0.5363376768486, with an optimistic scenario up to $0.686512226366208.
Share
Content