2025 SWARMS Price Prediction: Expert Analysis and Market Forecast for the Leading AI Agent Platform

Introduction: Market Position and Investment Value of SWARMS
SWARMS (SWARMS), an enterprise-scale multi-agent collaboration framework built on the Solana blockchain, has emerged as a notable player in the decentralized AI and automation sector. Since its launch in December 2024, the project has established itself within the crypto ecosystem with growing adoption among early supporters. As of December 21, 2025, SWARMS has achieved a market capitalization of approximately $17.10 million USD, with a circulating supply of approximately 999.98 million tokens, currently trading at $0.0171 per token.
This innovative asset, positioned at the intersection of artificial intelligence and decentralized systems, is gaining traction in enterprise-level agent collaboration applications. Over the past year, SWARMS has experienced significant volatility, with notable price movements reflecting both market sentiment shifts and the evolving maturity of the broader AI-driven crypto sector.
This article will comprehensively analyze SWARMS price trends and movements through 2030, integrating historical performance patterns, market supply-demand dynamics, ecosystem development, and macroeconomic factors to deliver professional price forecasts and actionable investment strategies for investors considering exposure to this emerging technology asset.
SWARMS Market Analysis Report
I. SWARMS Price History Review and Market Status
SWARMS Historical Price Evolution
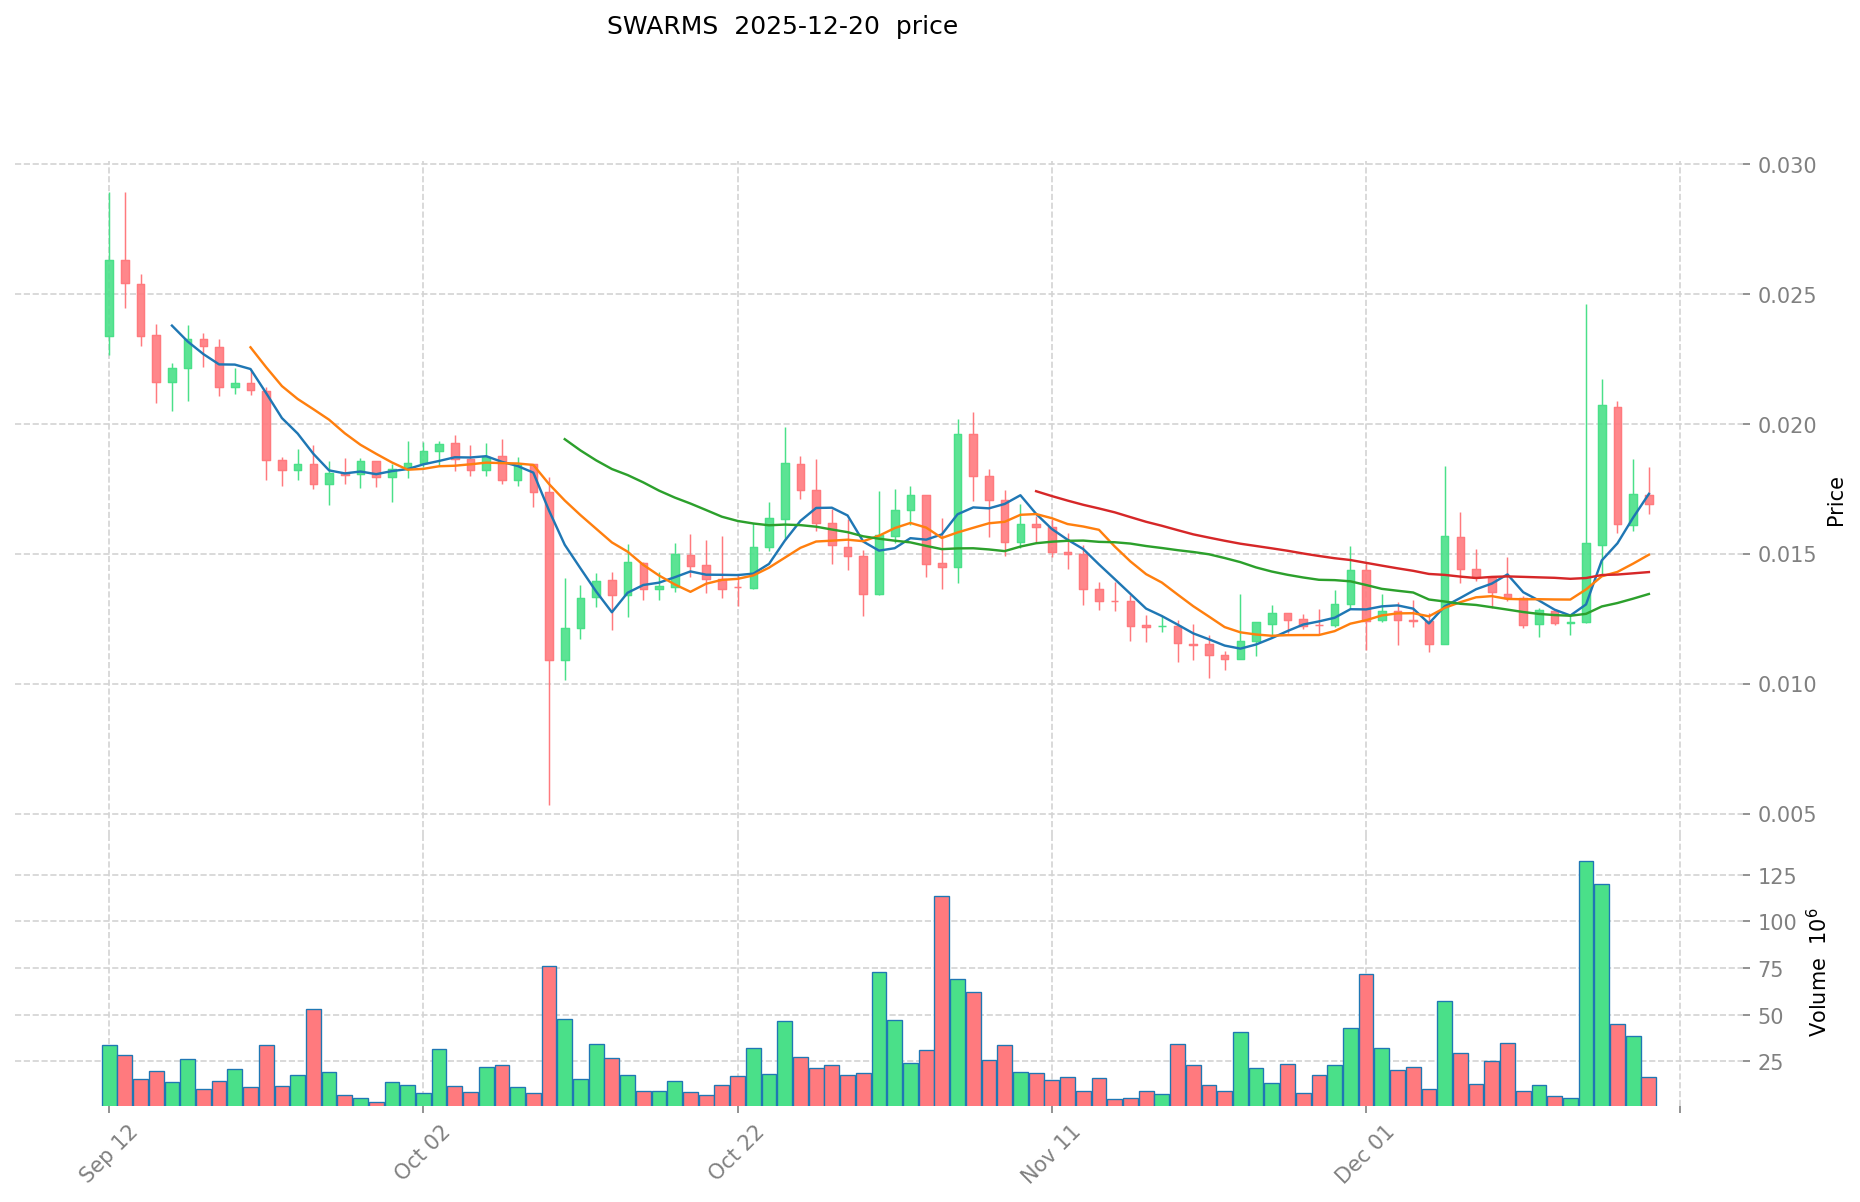
SWARMS reached its all-time high (ATH) of $0.628 on January 7, 2025, representing a significant peak in the token's market performance since its launch. The token subsequently experienced a substantial decline, reaching its all-time low (ATL) of $0.00531 on October 10, 2025. This represents a sharp correction of approximately 91.5% from peak to trough, reflecting considerable volatility in the asset's market valuation.
Over the past year, SWARMS has declined 75.36%, indicating sustained downward pressure on token value from its launch price of $0.0002693.
SWARMS Current Market Status
As of December 21, 2025, SWARMS is trading at $0.0171, reflecting a 24-hour decline of -2.19%. The token shows modest intraday strength with a 1-hour gain of 0.62%, though longer-term momentum remains positive on 7-day (34.58%) and 30-day (48.11%) timeframes.
Key Market Metrics:
- Market Capitalization: $17,099,740.60
- Fully Diluted Valuation (FDV): $17,099,740.59
- 24-Hour Trading Volume: $337,202.03
- Circulating Supply: 999,984,830.56 SWARMS (99.998% of total supply)
- Total Supply: 1,000,000,000 SWARMS
- Market Dominance: 0.00053%
- 24-Hour Price Range: $0.015367 - $0.017329
- Token Holders: 28,875
SWARMS maintains a market cap rank of 925 globally. The token operates on the Solana blockchain and is available for trading across 18 cryptocurrency exchanges, including Gate.com.
View current SWARMS market price
SWARMS Market Sentiment Index
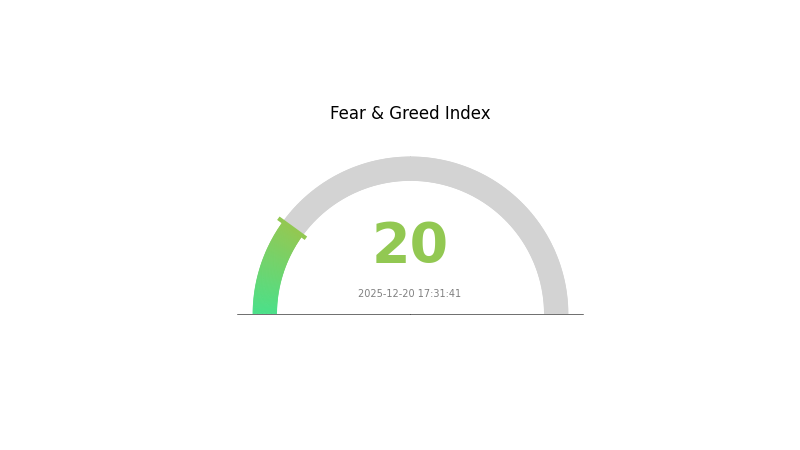
2025-12-20 Fear and Greed Index: 20 (Extreme Fear)
Click to view current Fear & Greed Index
The crypto market is currently experiencing extreme fear, with the Fear and Greed Index hitting 20. This indicates significant market pessimism and heightened risk aversion among investors. When sentiment reaches such extreme lows, it often signals potential capitulation and could present contrarian buying opportunities for risk-tolerant traders. However, caution is advised as further downside remains possible. Monitor key support levels closely and consider dollar-cost averaging into positions rather than making large lump-sum investments during periods of extreme fear.
SWARMS Holdings Distribution
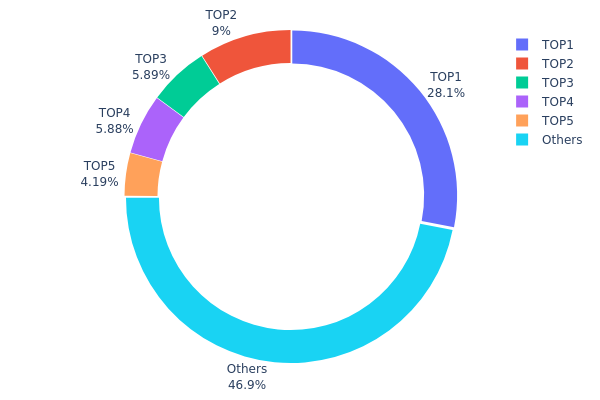
The address holdings distribution chart illustrates the concentration of SWARMS tokens across different wallet addresses on the blockchain. This metric serves as a critical indicator of token distribution health, revealing the degree of centralization and the potential influence that major holders exert over the asset's price dynamics and governance structure.
Currently, SWARMS exhibits a moderately concentrated holding pattern with notable centralization risks. The top five addresses collectively control approximately 53.03% of the total token supply, with the largest holder commanding 28.09% alone. This substantial concentration in a single address represents a significant governance and market control point. The second and third largest holders maintain positions of 9.00% and 5.88% respectively, while the remaining top-five addresses hold between 4.18% and 5.88%. Notably, the dispersed category of "Others" accounts for 46.97% of tokens, indicating that nearly half of the circulating supply remains distributed across numerous smaller addresses.
The current distribution structure presents both opportunities and risks to market participants. While the significant portion held by retail addresses (46.97%) suggests a degree of community participation, the concentration among the top five holders creates potential vulnerabilities. Large holders possess the capacity to execute substantial market moves, potentially triggering increased price volatility during periods of significant token transfers or sales. Furthermore, the top address's 28.09% stake raises questions regarding decision-making authority and the level of decentralization within the SWARMS ecosystem. This holding pattern reflects a semi-decentralized structure where institutional or early investor positions maintain considerable market influence, though the presence of meaningful distributed holdings suggests the token has achieved some degree of community adoption.
Visit SWARMS Holdings Distribution on Gate.com for real-time data
| Top | Address | Holding Qty | Holding (%) |
|---|---|---|---|
| 1 | u6PJ8D...ynXq2w | 280990.18K | 28.09% |
| 2 | 7TWnq4...ueuVuh | 90013.59K | 9.00% |
| 3 | 5Q544f...pge4j1 | 58857.83K | 5.88% |
| 4 | Dsjzh2...3t8T5i | 58807.11K | 5.88% |
| 5 | 9ZPsRW...ZgE4Y4 | 41851.93K | 4.18% |
| - | Others | 469455.63K | 46.97% |
II. Core Factors Influencing SWARMS Future Price
Market Volatility and Liquidity
- High Volatility Characteristics: Like many emerging crypto assets, SWARMS exhibits significant market volatility with potential for substantial short-term price fluctuations in either direction.
- Liquidity Assessment: Market liquidity and trading volume are critical factors affecting price stability and execution quality for investors.
- Current Impact: Careful evaluation of market liquidity is essential for assessing the sustainability of price movements and potential slippage in trading.
Team Execution and Technology Development
- Team Performance: Project team execution capability directly influences investor confidence and market sentiment toward SWARMS.
- Technological Progress: Advancements in underlying technology infrastructure and smart contract deployment impact the project's credibility and utility.
- Smart Contract Infrastructure: The deployment of key smart contracts—including storage incentive contracts, liquidity pool contracts, verification contracts, and postage batch purchase registration contracts—forms the foundation for ecosystem functionality.
Market Sentiment and Trading Volume
- Sentiment-Driven Price Movement: SWARMS price is significantly influenced by overall market sentiment, which can amplify both bullish and bearish trends in the cryptocurrency sector.
- Trading Volume Dynamics: Higher trading volumes typically correlate with increased price discovery and reduced volatility, while lower volumes may indicate concentrated control and manipulation risk.
Macroeconomic Environment
- Interest Rate Impact: Broader macroeconomic conditions, particularly interest rate changes, influence cryptocurrency valuations and investment allocation patterns.
- Market-Wide Conditions: The overall crypto market environment and investor risk appetite play substantial roles in determining SWARMS price trajectory.
III. 2025-2030 SWARMS Price Forecast
2025 Outlook
- Conservative Forecast: $0.01181-$0.01712
- Neutral Forecast: $0.01712
- Optimistic Forecast: $0.02003 (requires sustained market momentum and positive ecosystem developments)
2026-2028 Medium-term Outlook
- Market Stage Expectations: Gradual accumulation phase with potential breakout opportunities as the project matures and adoption expands
- Price Range Predictions:
- 2026: $0.01579-$0.02731 (8% upside potential)
- 2027: $0.01331-$0.02937 (34% upside potential)
- 2028: $0.01752-$0.03296 (52% upside potential)
- Key Catalysts: Increased institutional interest, ecosystem expansion, technological upgrades, and broader market recovery cycles
2029-2030 Long-term Outlook
- Base Case Scenario: $0.01507-$0.04108 (assumes moderate adoption and market stabilization by 2029)
- Optimistic Scenario: $0.02755-$0.04415 (assumes accelerated platform adoption and positive macroeconomic conditions)
- Transformative Scenario: $0.04415+ (contingent on breakthrough technological developments, mainstream institutional adoption, and favorable regulatory environment)
- December 21, 2025: SWARMS demonstrates 0% change, indicating market consolidation phase
| 年份 | 预测最高价 | 预测平均价格 | 预测最低价 | 涨跌幅 |
|---|---|---|---|---|
| 2025 | 0.02003 | 0.01712 | 0.01181 | 0 |
| 2026 | 0.02731 | 0.01858 | 0.01579 | 8 |
| 2027 | 0.02937 | 0.02294 | 0.01331 | 34 |
| 2028 | 0.03296 | 0.02616 | 0.01752 | 52 |
| 2029 | 0.04108 | 0.02956 | 0.01507 | 72 |
| 2030 | 0.04415 | 0.03532 | 0.02755 | 106 |
SWARMS Investment Strategy and Risk Management Report
IV. SWARMS Professional Investment Strategy and Risk Management
SWARMS Investment Methodology
(1) Long-term Holding Strategy
- Target Investors: Institutional investors and long-term believers in multi-agent AI frameworks
- Operational Recommendations:
- Accumulate during market downturns when SWARMS trades below key support levels, leveraging the current -75.36% year-over-year decline as a potential entry opportunity
- Establish dollar-cost averaging (DCA) positions over 6-12 month periods to reduce volatility impact
- Secure holdings on Gate.com with extended timeframes (minimum 12-24 months) to capture potential adoption cycles in enterprise-scale multi-agent collaboration solutions
(2) Active Trading Strategy
- Technical Analysis Tools:
- Resistance and Support Levels: Monitor the 24-hour trading range ($0.015367 - $0.017329) and key historical levels ($0.00531 ATL, $0.628 ATH) for breakout signals
- Volume Analysis: Track the 24-hour volume of $337,202 against average trading velocity to identify momentum shifts and liquidity conditions
- Swing Trading Key Points:
- Execute short-term positions when positive 1-hour (+0.62%) or 7-day (+34.58%) price trends emerge, targeting 5-10% profit-taking levels
- Exit positions if 24-hour momentum turns negative or volume drops below 50% of average daily levels
SWARMS Risk Management Framework
(1) Asset Allocation Principles
- Conservative Investors: 1-2% of portfolio allocation
- Active Investors: 3-5% of portfolio allocation
- Professional/Institutional Investors: 5-10% of portfolio allocation with hedging instruments
(2) Risk Hedging Solutions
- Stablecoin Pairing Strategy: Maintain 40-60% of intended SWARMS position in USDC or USDT to enable rapid rebalancing during volatility spikes
- Diversification Approach: Combine SWARMS exposure with other established enterprise AI or Solana-based projects to distribute concentration risk
(3) Secure Storage Solutions
- Hot Wallet Recommendations: Gate.com Web3 wallet for active trading and frequent transactions with immediate liquidity access
- Cold Storage Option: Transfer long-term holdings to hardware security solutions with multi-signature verification for amounts exceeding $10,000
- Security Precautions: Never share private keys; enable two-factor authentication on all trading accounts; verify contract addresses (74SBV4zDXxTRgv1pEMoECskKBkZHc2yGPnc7GYVepump on Solana) before any transaction
V. SWARMS Potential Risks and Challenges
SWARMS Market Risk
- Extreme Volatility: SWARMS has experienced a -75.36% decline over one year, demonstrating severe price instability that can result in substantial losses for retail investors
- Liquidity Constraints: With only 18 exchange listings and $337,202 daily volume, SWARMS faces significant liquidity risk that may prevent rapid position exits during market stress
- Market Cap Concentration: At $17.1 million market cap with only 28,875 holders, the token exhibits high concentration risk vulnerable to large holder sell-offs
SWARMS Regulatory Risk
- Evolving AI Regulation: Emerging government frameworks targeting AI applications may impose restrictions on enterprise multi-agent systems, impacting SWARMS adoption and token value
- Classification Uncertainty: Regulatory agencies may reclassify SWARMS or similar agent-based tokens, creating compliance challenges for exchanges and investors
- Jurisdiction-Specific Restrictions: Different countries may impose varying restrictions on Solana-based tokens or AI-related crypto assets, limiting market accessibility
SWARMS Technology Risk
- Smart Contract Vulnerabilities: As a Solana-based token, SWARMS relies on blockchain security; any critical vulnerabilities in Solana infrastructure could compromise token holders' assets
- Adoption Execution Risk: The enterprise-scale multi-agent framework must demonstrate tangible adoption and integration before market consensus validates long-term value
- Technical Obsolescence: Competing multi-agent technologies or superior enterprise solutions could render SWARMS framework obsolete if development stalls or community support wanes
VI. Conclusion and Action Recommendations
SWARMS Investment Value Assessment
SWARMS represents a speculative investment thesis centered on enterprise-scale multi-agent collaboration frameworks within the Solana ecosystem. While the project addresses an emerging technology sector with significant long-term potential, current metrics reflect extreme volatility, limited liquidity, and concentrated holder distribution. The -75.36% annual decline suggests market repricing or diminished near-term confidence, presenting both risk and potential opportunity depending on risk tolerance and investment horizon.
SWARMS Investment Recommendations
✅ Beginners: Allocate 0.5-1% of total cryptocurrency portfolio as speculative exposure; execute purchases exclusively through Gate.com with preset stop-loss orders at -20% to contain downside risk; avoid margin trading and leverage.
✅ Experienced Investors: Implement dollar-cost averaging over 6-month periods targeting 2-3% portfolio allocation; utilize technical analysis on 4-hour and daily charts; maintain hedging positions in stablecoins and rebalance monthly.
✅ Institutional Investors: Conduct comprehensive due diligence on development roadmap, enterprise partnerships, and competitive positioning; execute large positions through OTC channels to minimize slippage; maintain 5-10% allocation with strict governance protocols and quarterly performance reviews.
SWARMS Trading Participation Methods
- Direct Purchase: Buy SWARMS on Gate.com using supported fiat or cryptocurrency pairs; transfer to secure storage immediately after purchase
- Spot Trading: Execute market and limit orders on Gate.com platform; monitor 24-hour price trends and volume indicators before entry
- Strategic Accumulation: Establish recurring DCA purchases on Gate.com to average entry prices over extended periods, reducing timing risk
Cryptocurrency investments carry extreme risk. This report does not constitute investment advice. Investors must evaluate personal risk tolerance and consult qualified financial advisors before deploying capital. Never invest more than you can afford to lose entirely.
FAQ
What is the future of the swarms coin?
Swarms coin is projected to reach $0.066403 by 2027 with a 10.25% growth rate. Strong fundamentals and increasing adoption in decentralized networks support bullish long-term prospects.
Is swarm crypto a good investment?
Swarm crypto offers compelling potential with staking rewards for passive income and strong network fundamentals. Its innovative AI integration and growing adoption make it an attractive long-term investment opportunity in the emerging decentralized intelligence sector.
How does Swarms crypto compare to Bitcoin?
Swarms is a newer cryptocurrency with smaller market cap than Bitcoin. While Bitcoin is the most established digital asset, Swarms has shown strong recent performance, outperforming Bitcoin by 1.58% in the last 24 hours.
What are the risks of investing in Swarms coin?
Swarms coin carries high volatility risk with significant price fluctuations. Regulatory uncertainty in crypto markets poses additional challenges. Liquidity risks and potential for substantial losses exist. Market competition and technological changes may impact value. Always conduct thorough research before investing.
Share
Content
Introduction: Market Position and Investment Value of SWARMS
I. SWARMS Price History Review and Market Status
II. Core Factors Influencing SWARMS Future Price
III. 2025-2030 SWARMS Price Forecast
IV. SWARMS Professional Investment Strategy and Risk Management
V. SWARMS Potential Risks and Challenges
VI. Conclusion and Action Recommendations
FAQ
How to Buy Cryptocurrency


Trending Cryptocurrencies


VAI vs SOL: The Battle for Dominance in the Decentralized Finance Ecosystem

Is aiPUMP (AIPUMP) a good investment?: Analyzing the Potential and Risks of this AI-Powered Cryptocurrency

Is Tate Terminal (TATE) a good investment?: Analyzing the potential and risks of this emerging cryptocurrency

Is TOKAI (TOK) a good investment?: Analyzing the potential and risks of this emerging cryptocurrency

2025 TOK Price Prediction: Bullish Outlook as Adoption and Utility Grow
How Does Zerebro's Market Cap of $8.17M Compare to Other Cryptocurrencies in 2025?
Promising Crypto Tokens for December 2024 Investments

Explore Owlto Finance's Efficient Multi-Chain Transfers and New OWL Listing Date
Understanding Pledge Mining: Maximize Your Rewards in the Web3 Ecosystem

A Detailed Analysis of Cryptocurrency Mining Principles and Mechanisms
Unlocking Crypto Payment Solutions: How SPY Connects Digital Currency with Everyday Shopping